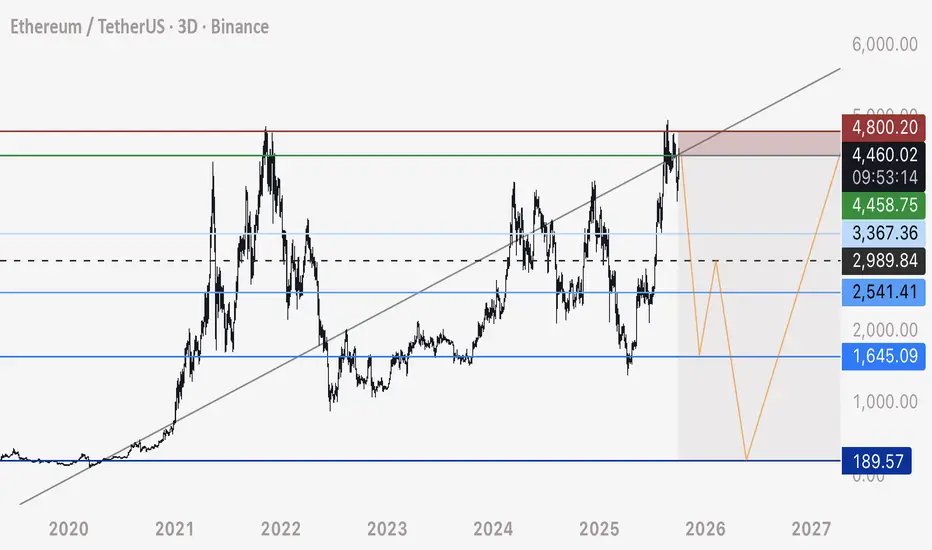
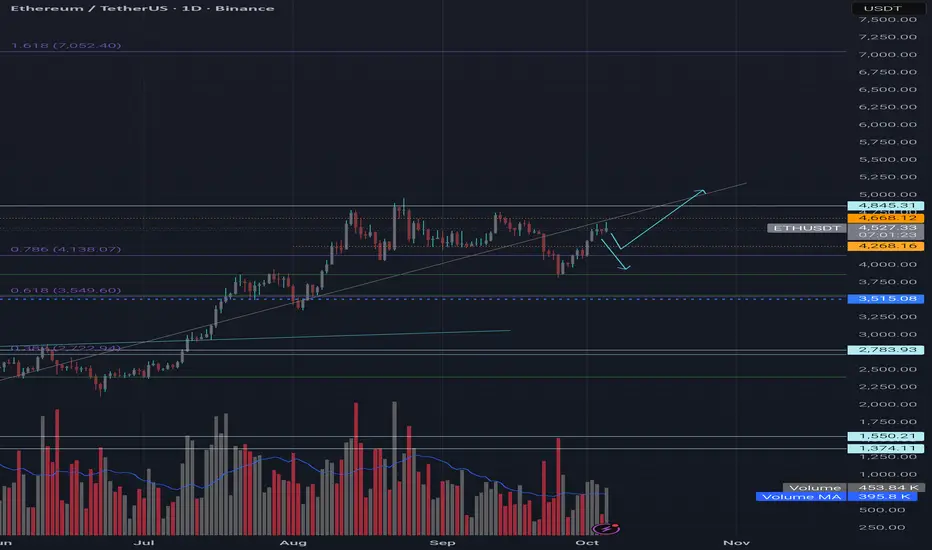
ETH will Tank - Zoomed Out LookHere is a zoomed out look at the ETH chart, which has been working on this ascending channel structure ( single mid point shown ).
Short Entry - 4,460 to 4,500
Stop Loss - 4,800
Target 1 - 3,370
Target 2 - 2,550
Target 3 - 1,650
Target 4 - 200
Don’t believe the stability of this market. God speed.
ETHUSDT.3S trade ideas
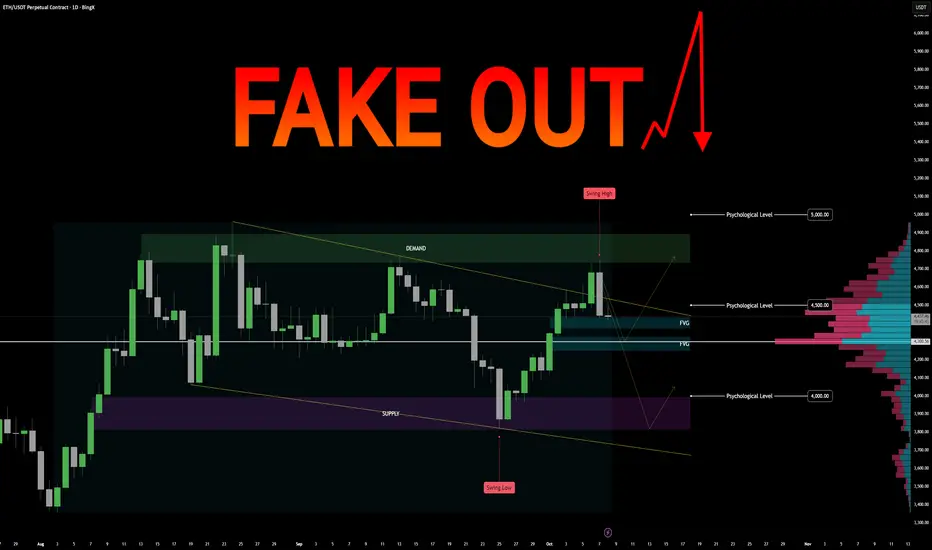
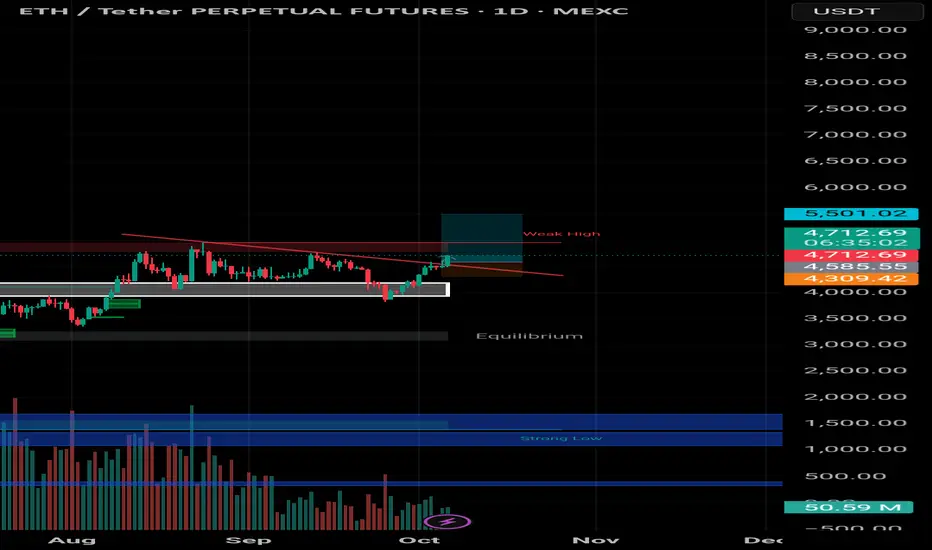
$ETH Market Assessment Incoming FAKEOUT? ETH/USD Perpetual – Market Assessment
Key Zones
Demand: 4737 – 4895
Supply: 3818 – 3994
Fair Value Gaps (FVGs): 4433, 4326
Anchored Volume Node: 4300 (significant liquidity cluster)
Psychological Levels : 4000, 4500, 5000
Recent Swing Points: High 4753, Low 3821
Technical Structure
High-Time Frame (HTF) Analysis:
Pattern: Bullish flag
Interpretation: Indicates potential continuation to the upside if price breaks above the flag resistance.
Daily-Time Frame (DTF) Analysis:
Pattern: Bearish channel
Interpretation: Suggests a slightly bearish pressure on the daily trend; caution required for long positions.
Volume and Liquidity:
Anchored volume node at 4300 aligns closely with FVGs at 4326 and 4433 – this area may act as strong support on pullbacks.
Scenario Planning
Bullish Scenario:
Price holds above demand zone (4737–4895).
Break above recent swing high at 4753 confirms bullish momentum.
Potential targets: 4895, 5000 psychological resistance.
Pullbacks likely to find support at FVGs (4433, 4326) or volume node (4300).
Bearish Scenario:
Price fails to hold demand zone and breaks below recent swing low 3821.
Next support: supply zone 3818–3994, then psychological level at 4000.
FVGs and volume node may temporarily slow the downside movement.
Summary / Notes
HTF indicates bullish continuation potential; daily trend shows bearish pressure.
Demand and supply zones, FVGs, and volume nodes are key levels for trade planning.
Monitor price reactions at swing points, psychological levels, and liquidity clusters to confirm trade setups.
Trade management should consider both bullish and bearish contingencies, with SLs placed near key FVGs or volume nodes.
ETH big long to ATHCRYPTOCAP:ETH BIG LONG TO ATH
5RR Trade
sl: $4520
Let's see how it goes. Manage risk to what you can afford to lose multiple times without getting emotional if following along
The way is clear for eth, just need some fomo longs to stack up

$ETH – Trend Still IntactCRYPTOCAP:ETH has been overall bullish after breaking above the $4,230 neckline and retesting it as support.
We’ll be looking for trend-following longs as long as the red trendline holds, expecting the bullish momentum to continue toward the $4,800 resistance and potentially the $5,000 psychological level.
A break below the trendline would signal a short-term correction before the next leg higher.
⚠️ Disclaimer: This is not financial advice. Always do your own research and manage risk properly.
📚 Stick to your trading plan regarding entries, risk, and management.
Good luck! 🍀
All Strategies Are Good; If Managed Properly!
~Richard Nasr

ETHUSDT Bullish Outlook: Bull Flag and Strong Support Levels👋Hello everyone, it's great to be back with today’s discussion on BINANCE:ETHUSDT .
Currently, ETHUSDT is trading around 4,470 and showing a strong bullish trend, supported by a clear Bull Flag pattern. After a strong rally, the price is now consolidating within a narrow range, creating an opportunity for buying pressure to accumulate and prepare for the next leg up.
The EMA 34 and 89 also support the uptrend, and the immediate support zone aligns with the lower boundary of the flag pattern. If ETH continues to hold strength at this level, the likelihood of a breakout to the upside is extremely high.
I maintain a positive outlook on this analysis. What about you? What are your thoughts on ETHUSDT's trend? Feel free to share your opinions for discussion!
Good luck!

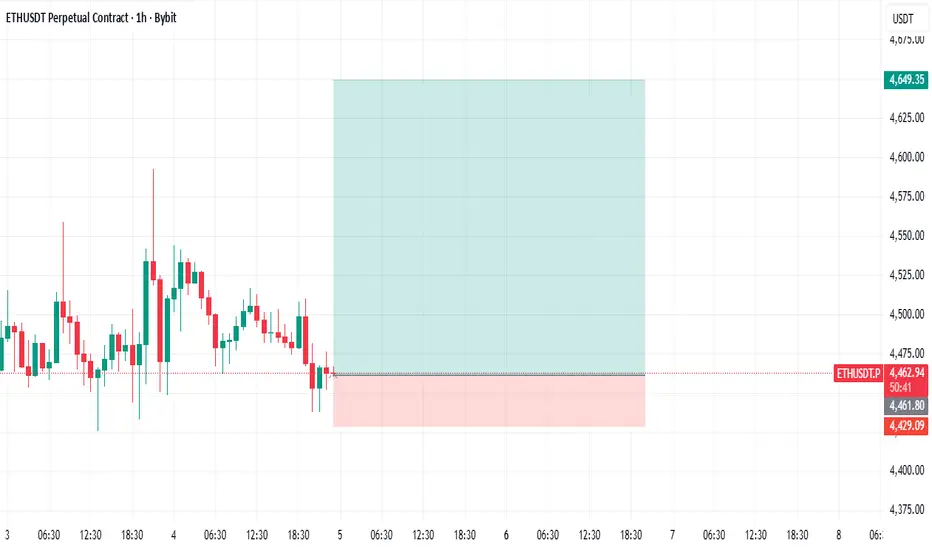
#ETH #CryptoTrading #PriceAction #🚀 ETH/USDT Long Setup Update (1H Chart)
📈 Entry: $4470 | 🎯 Targets: $4512 → $4559 → $4604 → $4648 | 🛑 SL: $4433
💡 Price bouncing off support + MA confluence — risk/reward looking 🔥
Will ETH hold the 4.4k zone and push toward 4.6k next? 👀
Drop your thoughts
Ethereum: Bullish ContinuationEthereum: Bullish Continuation
Ethereum recently broke out of a bullish triangle pattern, which usually signals a bullish move. After this breakout, the price is now pushing higher with strong momentum.
The first target is around 4450, where ETH could face resistance.
If it breaks that level, the next target is around 4600, which is a stronger resistance zone.
Overall, the chart suggests that ETH is in a bullish continuation pattern, and as long as it stays above the breakout zone, it could keep moving upward step by step toward those targets.
You may find more details in the chart!
Thank you and Good Luck!
❤️PS: Please support with a like or comment if you find this analysis useful for your trading day❤️

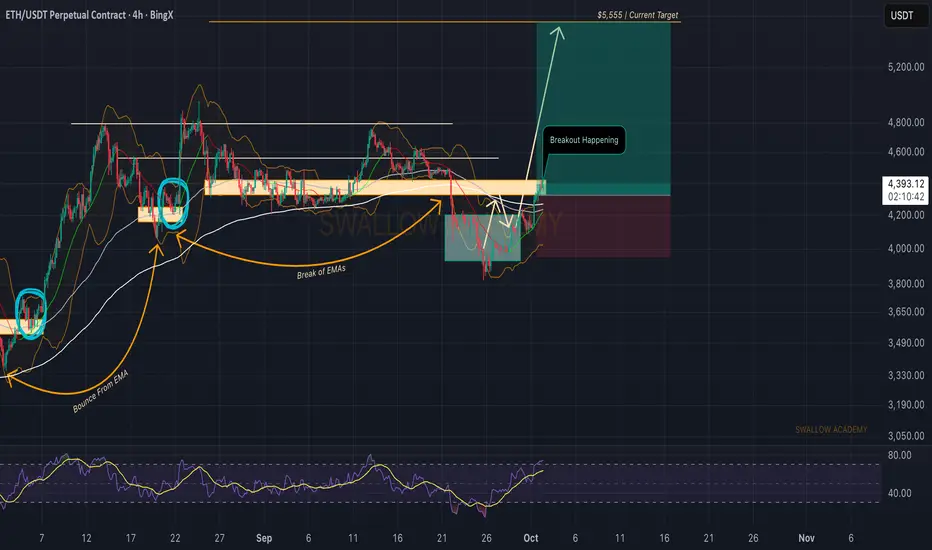
Ethereum (ETH): Secured EMAs + Going For Breakout | BULLISH AFBuyers have secured the lines of EMAs and are now leading ETH for a proper breakout, which will mark the start of upcoming bullish movement, which we think can lead us to a new ATH.
The game plan is simple, so now we just wait for a confirmatory breakout!
Swallow Academy
ETH 6K to 8K !? My analysis atm for ETH
Possible to bounce right back to ATH and price discovery mode to 6K hopefully 8K+
What ya all think, drop it bellow ?

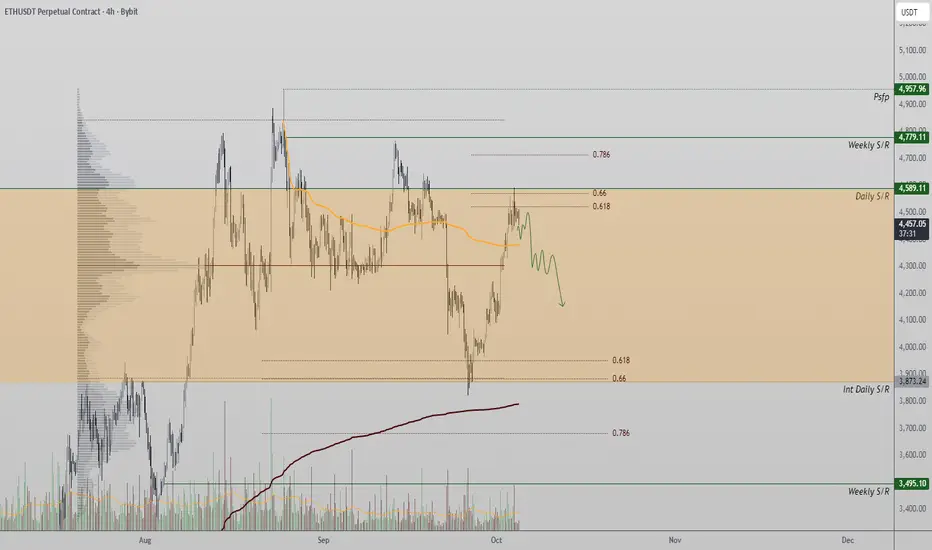
Ethereum Faces Rejection at $4,580Ethereum is testing a major resistance zone at $4,580, where price action shows signs of rejection. The level aligns with the 0.618 Fibonacci retracement, suggesting potential for an intraday correction before continuation higher.
Ethereum’s recent rally has brought price action into a crucial resistance zone on the higher timeframes. The $4,580 region has repeatedly acted as a key level of rejection in previous attempts and now coincides with the 0.618 Fibonacci margin. As price approaches this zone once again, traders are watching closely to see whether Ethereum can break through with volume confirmation or if another rejection will initiate a short-term retracement before a broader continuation move.
Key Technical Points:
- Resistance at $4,580 aligns with the 0.618 Fibonacci retracement.
- VWAP and point of control (POC) are key short-term support levels.
- Failure to hold VWAP/POC could trigger a deeper intraday correction.
Main Analysis:
Ethereum’s climb from lower support has been well-structured, producing higher highs and higher lows consistent with a bullish market phase. However, the current level at $4,580 represents a significant area of supply, where previous rallies have stalled. The overlap of this resistance with the 0.618 Fibonacci retracement adds technical confluence, increasing the probability of a reaction from sellers.
The VWAP and point of control currently sit below this resistance and act as key dynamic supports for the ongoing uptrend. Losing these levels on an intraday basis would likely open the door for a retracement deeper into the previous demand zone. Such a move would be considered healthy within the broader uptrend, allowing the market to reset before establishing another higher low.
Despite this near-term resistance, the macro structure of Ethereum remains bullish. Momentum indicators, including RSI and moving averages, still favor buyers, though they suggest temporary exhaustion at these levels. Traders should closely monitor volume responses at $4,580 — a breakout supported by increasing buy volume would confirm renewed bullish strength, while rejection and declining volume would support a corrective scenario.
What to Expect in the Coming Price Action
Ethereum remains in a bullish trend overall, but short-term resistance at $4,580 could trigger a brief pullback if unbroken. A confirmed breakout above this level would open the door toward higher resistances at $4,750–$4,900, while a failure to reclaim the VWAP or POC could see price retest lower supports before resuming the broader uptrend.
ETH Retest Done – ATH SoonEthereum has pulled back perfectly into its key resistance-turned-support zone and held strong. This successful retest is a healthy sign for the trend, showing buyers are stepping in to defend the level.
If momentum builds from here, CRYPTOCAP:ETH could gear up for another big leg higher toward new highs.
Stay tuned.
DYOR, NFA
Follow us for more market insights and daily updates on Tradingview.
#PEACE ✌

ETH/USDT | ETH Weekly Setup – Strong Demand Pushes Toward $6K!By analyzing the Ethereum chart on the weekly timeframe, we can see that after entering the $3,800 demand zone, ETH gained strong buying pressure and reached the $4,200 and $4,600 targets.
Currently, Ethereum is trading around $4,500, up about 19%, and I expect further bullish movement soon. The next upside targets are $4,950, $5,500, and $6,000.
THE LATEST TA :
Please support me with your likes and comments to motivate me to share more analysis with you and share your opinion about the possible trend of this chart with me !
Best Regards , Arman Shaban

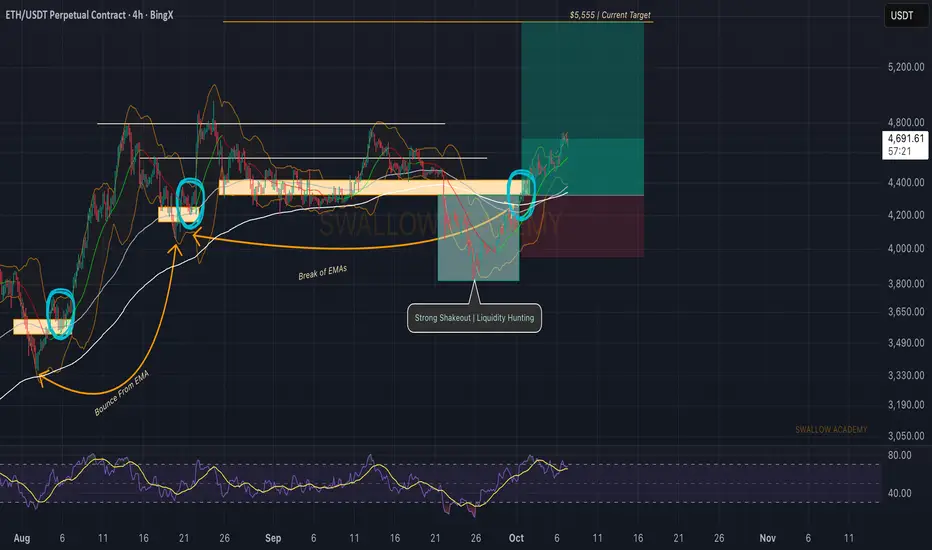
Ethereum (ETH): Price in Bullish Momentum | Breakout BreakoutETH is back above the EMAs after that strong liquidity hunting that we had on the markets, which shook out billions from the markets. Nevertheless, price is back in bullish momentum and since our entry, we are already up by 8-9%.
The game plan remains the same; we want to see the new ATH to be at least $5555 (if not more).
Swallow Academy
Ethereum ATH Incoming - As soon as BTC goes back to sleep.
Our BINANCE:ETHUSDT.P algorithm triggered a long position.
All of our technical indicators calculate a 77.8% arithmetic average long signal strength . The most important piece of "evidence" for our speculation that Ethereum will reach new ATH levels within the next month is the fact that Extreme Trend BREAKOUTS and the High-Volatility TREND FOLLOWER conditions triggered the trade together and sit at 100% long signal strength at the time of writing.
Our other breakout condition - Double-Filtered Channel BREAKOUTS sits at 80% long signal strength too. Why is all that relevant? Because these conditions (made up out of 5-6 technical indicators each) are meant to detect and enter breakouts, following the trend from the very start.
While it is programmed to exit at 2%, we believe that a bigger move is in preparation. We recently saw BINANCE:BTCUSDT.P reach unprecedented highs. Historically, when Bitcoin stops it's parabolic growth and money starts flowing back into fiat and other cryptos - ETH benefits first.
Fundamentally, Ethereum is the backbone of the smart-contract and Web3 revolution. Solana, PolkaDot, BNB and other alt-coins are all derived from and inspired by the Ethereum virtual machine. This makes us ask the question - why is Ethereum lagging behind so much behind Bitcoin?
Well, there are a couple of possible answers and they all lead to the same conclusion:
- Solana, with it's lower barriers for entry, profited the most from the retail excitement around meme-coins. The easy coding language and simple, but functional and cheap websites for creating these "meme-coins" took away a large chunk of the retail volume that would otherwise go towards Ethereum.
- Ethereum's switch from proof-of-work to proof-of-stake is just now completing. The release of pre-PoS era staked ETH to large investors over the last year is finally reaching a point in time and price where it is more profitable for large ETH stakers to be incentivized to start keeping their original investment. Basically - there is less and less incentive to sell your staked Ethereum and more incentives to stake more (and therefore buy on Spot).
From the picture above we can see that the $4700 level is a major resistance level. Once that is broken, we have very little historical references for what may happen.
Or in other words - 4700 is the level from which we will bounce into price discovery after hopefully turning into support.
Not a lot of time is left in this crypto cycle. And Ethereum tends to finish it's parabolic increase towards the end of the classical 4-year cycle.

ETHEREUM - THE TRAP IS UNFOLDING – EXPECT A BLOODBATH!As I mentioned in my latest Bitcoin and ChainLink analysis , I believe the crypto market is setting up for a huge long squeeze. Let’s break down why this move looks fragile and why you should be cautious.
What do we need for a healthy rally?
Spot demand – Real buyers (spot market) need to step in and absorb supply. Without this, rallies are built on leverage and tend to collapse quickly.
Controlled leverage – A healthy move isn’t fueled by overleveraged longs. If open interest keeps spiking while spot demand is flat or negative, that’s a recipe for a squeeze.
Auction structure support – Price should build strong bases (value areas, balanced profiles) instead of just ripping up through inefficiencies.
Right now? We don’t have these ingredients.
Step 1: Look at CRYPTOCAP:TOTAL3
For those unfamiliar, CRYPTOCAP:TOTAL3 is the crypto market cap excluding BTC and ETH. It’s a great index to measure the “altcoin market” and often shows where broader crypto is heading.
Now let’s apply some tools:
Anchored VWAP (AVWAP): Tracks the average position of buyers/sellers from a specific swing (like a cost-basis anchor).
Fixed Range Volume Profile (FRVP): Shows where most trading occurred (value area, POC, low/high volume nodes).
What CRYPTOCAP:TOTAL3 shows:
The upper AVWAP band from the swing low (A) is at 1.12T.
The upper AVWAP band from the swing high (B) is also at 1.12T.
Price is retracing into the Value Area High (VAH). This lines up with:
An ascending trendline retest and a Fib retrace (0.75–0.786 zone).
When AVWAP bands from opposite swings collide like this, it’s a double-sided supply zone.
Longs from the low see this area as “expensive” → they reduce risk.
Shorts from the top defend their break-even.
This creates a congestion zone where strong reversals often happen unless fresh spot demand breaks through.
Example: Imagine two teams pushing on opposite sides of a door at the same time. Unless one side gets backup (spot demand), the door doesn’t move — it slams shut.
Step 2: Apply This to CRYPTOCAP:ETH
Now, let’s clear one thing up: CRYPTOCAP:TOTAL3 excludes both Bitcoin and Ethereum. It’s basically the “altcoin index,” showing how the rest of the market behaves without the two giants.
But here’s why it still matters for ETH:
ETH often moves in strong correlation with altcoins, especially during risk-on or risk-off events.
When CRYPTOCAP:TOTAL3 is at a critical resistance or AVWAP collision zone, it usually signals that risk appetite across alts is stretched.
And since ETH trades like a “bridge asset” between BTC and alts, it tends to get caught in the same flows.
So while ETH isn’t included in CRYPTOCAP:TOTAL3 , the technical structure of CRYPTOCAP:TOTAL3 gives us strong hints about where ETH and the altcoin market could be heading.
Step 3: Check USDT Dominance (USDT.D)
Yes, you can chart USDT dominance, and it’s often a leading indicator. Why?
If USDT.D goes up → money flows into stablecoins → crypto selling pressure.
If USDT.D goes down → money flows into crypto → bullish risk-on move.
Right now:
USDT.D broke out of a descending trendline and is retesting the breakout region.
It’s also printing a harmonic pattern that suggests upside continuation.
Step 4: Order Flow – who’s really buying ETH?
This is where the story gets clear:
Aggregated Spot CVD = trending down heavily.
Price goes up while spot CVD goes down = spot is selling into strength → no real demand.
Futures CVD (stablecoin-margined) = trending up heavily.
This means perps are pushing price higher with leverage.
Futures CVD (coin-margined) = trending down.
Another divergence → no strong confirmation from that side either.
Stablecoin OI:
First impulse up = OI dropped → shorts closing, not buyers entering.
Since Oct 1, OI rising → new longs piling in.
ByBit Order Flow: heavy leveraged longs entering, but looks like absorption.
For those that don't understand it:The rally is built on FOMO leverage longs, not real buyers. That’s fragile.
Conclusion
All the ingredients are here for a mega squeeze:
CRYPTOCAP:TOTAL3 at double AVWAP + VAH + Fib confluence,
ETH backfilling inefficiencies into double AVWAP supply,
USDT dominance signaling risk-off,
Order flow showing no spot demand, only leveraged perp longs.
When this unwinds, it won’t just be ETH. Expect broad crypto to follow.
The trap is unfolding. Don’t get caught on the wrong side.
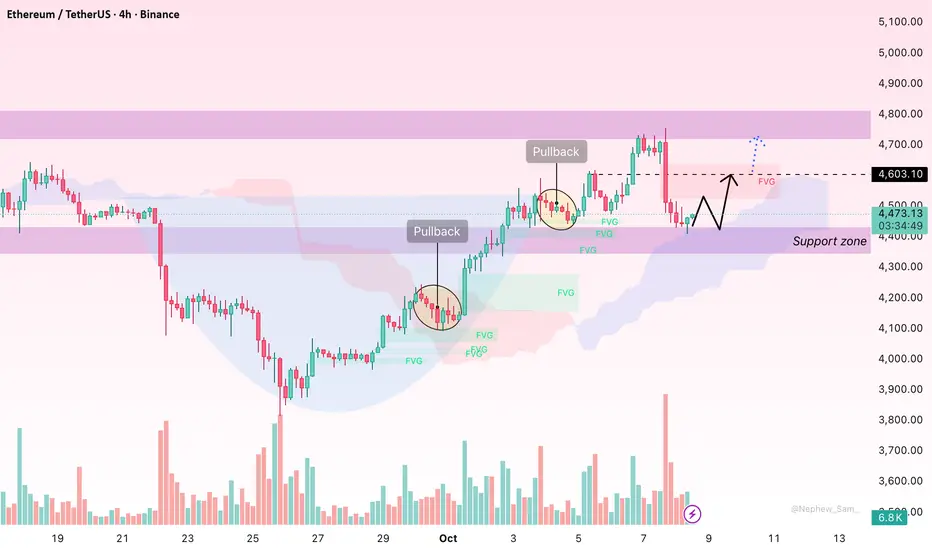
ETHUSDT: Minor Pullback After Rally, Signs of Ongoing RecoveryHello everyone, after reaching the recent peak near $4,500, Ethereum is showing signs of a mild correction. However, the decline quickly stabilised around $4,440, where buyers re-entered, and the Ichimoku cloud continues to provide solid support on the 4H chart.
Technically, ETH remains in a bullish structure with a consistent pattern of higher highs and higher lows. The Fair Value Gaps (FVG) created during the previous rally are yet to be fully filled, suggesting the market could see brief retests before resuming its upward movement.
The recent pullback is mainly driven by macro factors. Comments from several Fed officials hinted that monetary tightening could persist longer than expected, strengthening the USD and real yields, thereby putting pressure on risk assets like cryptocurrencies. At the same time, stronger-than-expected CPI and PCE data in the US have reignited inflation concerns, further boosting the dollar. This, combined with a temporary rotation into safe-haven assets, triggered short-term profit-taking in Ethereum.
Nonetheless, the medium-term uptrend remains intact. As long as the price stays above $4,400–$4,350, Ethereum is likely to recover towards $4,500 and potentially extend to $4,600. The short-term invalidation level lies at $4,350 — a close below that could open the door to a deeper pullback towards $4,250.
Personally, I believe this is just a “breather” in Ethereum’s broader bullish trend.
What about you — do you think ETH will soon reclaim $4,500, or will it need one more dip before rallying higher again?
ETHEREUM $10,000 TARGET by 2030When GCR said that $10k #ETH by 2030, then most likely the journey will be like this

Clean rejection from trend lineEth couldn't able to break through the trend line , lets see if it can hold the 4200 ish level.
failed to hold above 4200 ish then it will go to next support, particularly keep the eyes on BTC movement
ETH Consolidation Range Levelled up to $4227 to $45272025-10-02
ETH is likely to enter into a pullback and consolidation period.
Range: $4227 to $4527

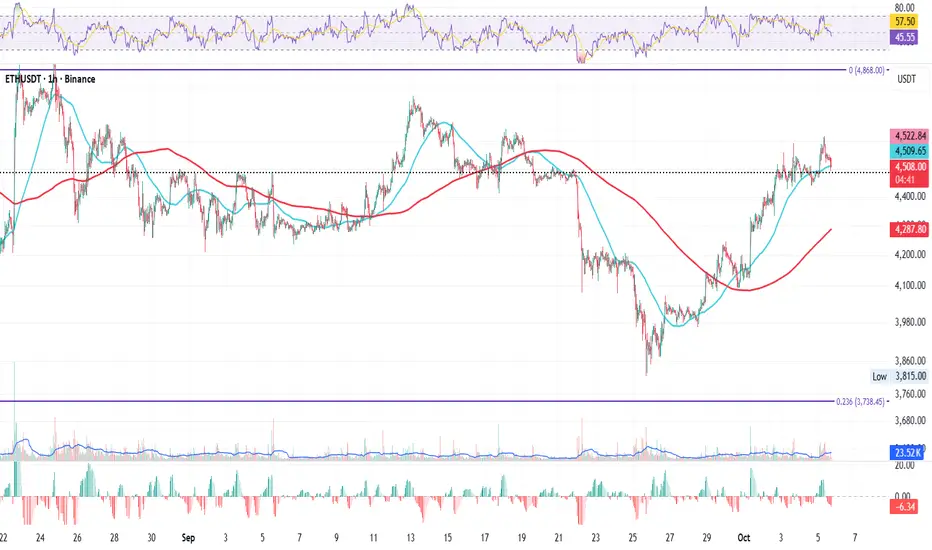
ETH 1H – Holding the Line or Breaking It?ETH 1H – Holding the Line or Breaking It?
Just like BTC, ETH on the 1H is currently testing the 50MA, the short-term line between strength and weakness.
The question now: will it hold as support, or will price break below and look for shelter near the 200MA?
Right under the 50MA sits yesterday’s close, adding an extra layer of support for the short-term structure.
Today’s close could be decisive for next week’s momentum. 👀
Key notes:
ETH testing the 50MA on 1H
200MA below as next support
Yesterday’s close acting as buffer
Close today could shape next week’s direction
Bias:
Neutral-bullish — momentum intact as long as the 50MA holds.
Always take profits and manage risk.
Interaction is welcome.
ETH/USDT – Ready for a Bullish Move (Daily Chart)Ethereum is showing strong signs of a potential bullish breakout on the daily timeframe. Price is consolidating above key support with higher lows forming, indicating accumulation. A breakout above resistance could trigger a strong upward move. Watch for volume confirmation and sustained close above resistance for trend continuation.
#ETH #Ethereum #Crypto #Trading #Breakout #Bullish
TOTAL2 & ETH – On the Edge of Price DiscoveryTOTAL2 & ETH – The Next in Line for Price Discovery
Today, TOTAL2 has officially broken above its previous all-time high, while ETH is still just below it, getting closer with each daily candle.
This tells an interesting story: altcoins as a whole have already entered price discovery, but ETH being the largest component of TOTAL2, hasn’t quite joined yet. This usually means one of two things: either smaller-cap altcoins are currently outperforming ETH, or ETH is simply building strength for a delayed breakout, a move that often pulls the entire market even higher once it happens.
Still, confirmation matters: TOTAL2 needs a daily close above its ATH, while ETH’s reaction around its own ATH in the coming days will likely decide whether it joins the move.
And let’s not forget: we’ve just entered Q4, and this one might be the strongest Q4 the crypto market has ever seen. Everything that once stood against crypto, from regulation to sentiment, is now turning in its favour, across the US, Asia, and even Europe.
That’s why I believe ETH will soon follow TOTAL2 into price discovery, potentially marking the start of the next major leg up for the entire market.
Bias:
Bullish! TOTAL2 confirmed breakout, ETH close behind. Q4 momentum could be the catalyst that sends both into new territory.
Always take profits and manage risk.
Interaction is welcome.

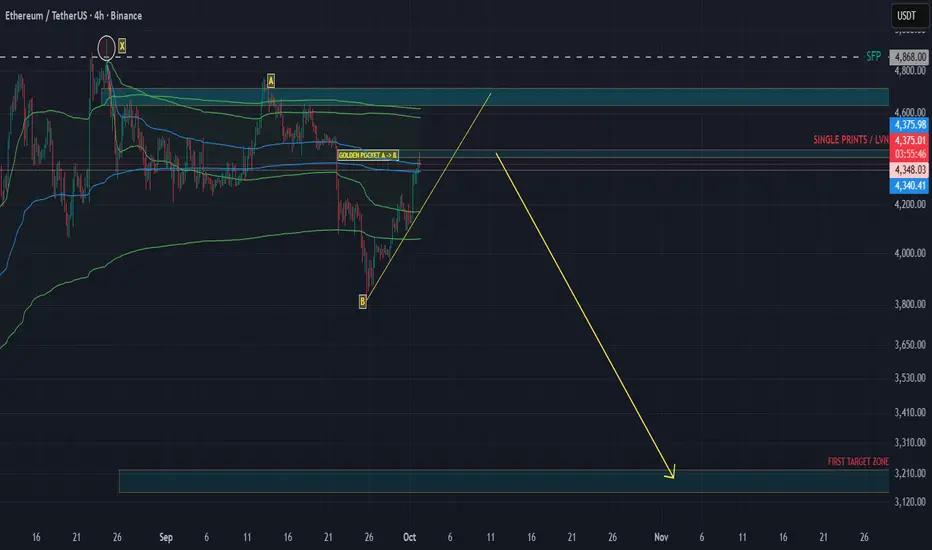
ETHUSDT Daily Analysis – Key Downtrend & Swing SetupEthereum is currently in a downtrend after the sharp surge toward $5,000. This move lower was expected following the extended bullish rally.
Looking ahead, I see a high probability of ETH reaching the $3,730 daily support. This level is a key swing trade setup and could serve as the foundation for the next big leg upward, potentially supporting a push toward a new all-time high in the longer term.
🔑 Technical Levels – Support & Stop Loss
📍 $3,730 | SL: $3,536 (Daily support – key swing setup)
📍 $2,680 | SL: $2,481 (Weekly support – deeper retracement zone)
Bias: Bearish in the short term while ETH remains under $4,400, but turning strongly bullish long term if $3,730 holds as support.
📊 Fundamental Insight
Regulatory uncertainty continues to weigh on crypto sentiment in the short term.
On-chain activity shows resilience, with active addresses and DeFi usage stabilizing.
Institutional demand remains present, with ETH staking and ETF developments reinforcing long-term value.
Overall, ETH is consolidating after an extended run. A retest of support zones could present high-probability swing opportunities for patient traders.
👉 If you find this content helpful, don’t forget to like & follow for more daily analysis.
