[SeoVereign] ETHEREUM BEARISH Outlook – September 30, 2025Hello everyone,
As of September 30, I would like to share my perspective on an Ethereum short position.
At present, I believe that Bitcoin, among others, still has one more downward wave remaining. Therefore, I am closely monitoring Bitcoin’s movement to capture the timing of its bearish reversal. Given that Bitcoin is likely to enter a declining phase, I am presenting a bearish scenario for Ethereum as well.
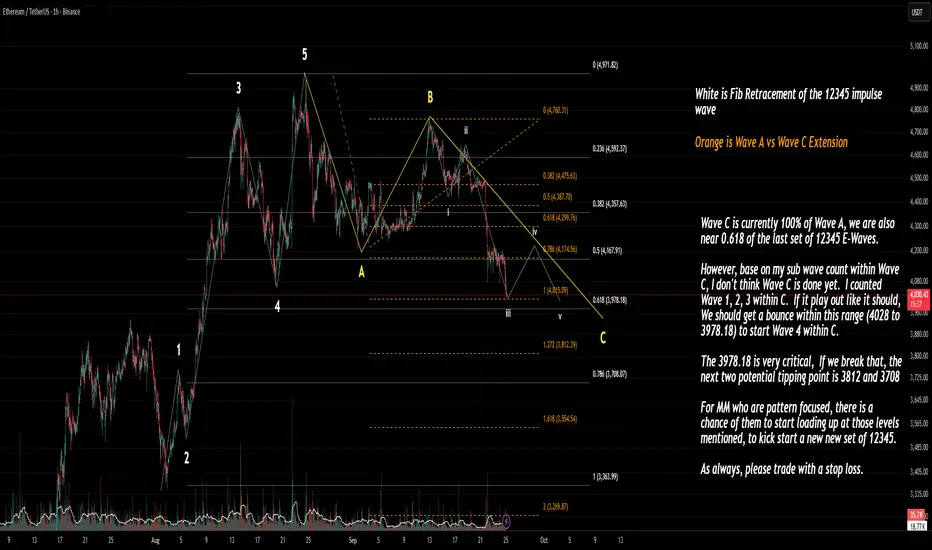
The basis of this idea is relatively clear: the entire structure is formed according to the classical ratio relationships of Elliott Wave Theory. All detailed ratios and projections have been drawn on the chart for your reference.
-Ratio Relationships
1. WAVE.C = WAVE.A * 1.618
2. WAVE.C = WAVE.A * 0.786
3. WAVE.C = WAVE.A * 1.272
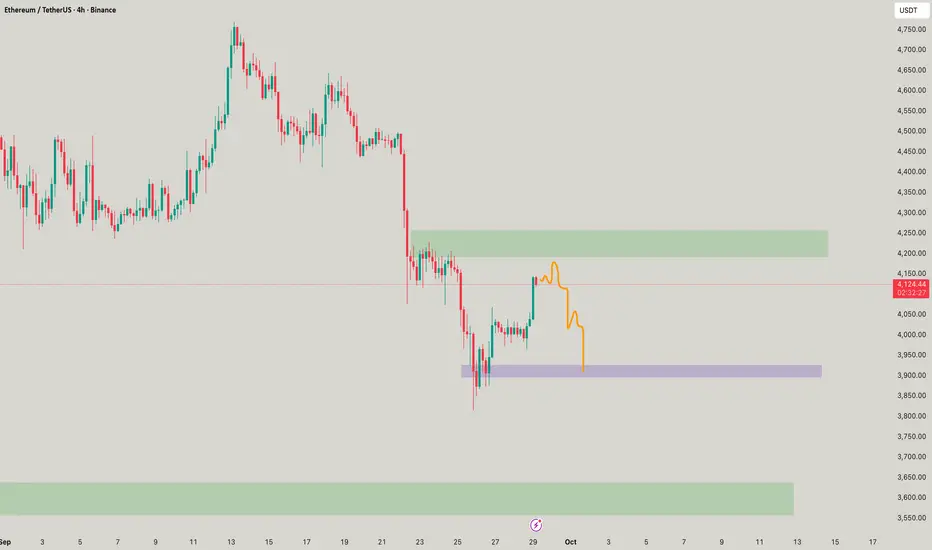
The average target price for this decline is set around 4030 USDT.
As always, I will continue to share updates on position management based on this idea as the chart develops.
Thank you for reading.
ETHUSDT.3S trade ideas

Is ETH Bottomed?
Observations from ETH 4 Hour Charts – 2025-09-28
• ETH is currently in a downtrend
• Key Support is $3945, Key resistance is $4202
• Projected time for trend reversal is early November with the following two Consolidation Ranges (CR): $3945 and $4202 then break and hold above $4200 level.
Warning Sign (Further Dropping)
1). Cannot make new lower lows than $3821.02
Play Strategy
Swing Trader: Trade the ranges.
Long-term Investor: Buy in dip, 20% - 30% buy

ETH - SUpercharged? Or Yet a move to be faked?ETH is charging itself up but the move was rather a fake one, ecpecting reversals in full
ETH Salaam
Just see and share a possible scenario.
ETH could make a bull flag on daily time frame just below the weekly key level of 4,000.
Also in weekly time frame, ETH broke the large triangle to the upside and now retesting, it should build it there is any will to contribute rise!
Look at 4h candle with high volume make it like accumulation.
For now confirmation wait for daily and weekly close above 4k.
Break the bill flag, retest and go for tp1 and 2.
Have great trade
Consider risk management

Ethereum Price Hits 6-Week Low, But Here Lies An OpportunityAt press time, Ethereum is trading at $3,938, attempting to establish $3,910 as a support floor. This decline marks a crucial break below the $4,000 level, highlighting short-term weakness.
Given current signals, ETH may remain rangebound under $4,074 resistance until stronger bullish cues emerge. Market sentiment suggests consolidation rather than sharp recovery, keeping investors cautious.
However, if Ethereum flips $4,074 into support, a push toward $4,222 could follow. This move would require investor participation and sustained inflows to counter bearish momentum, ultimately invalidating the short-term negative outlook.

Hot Investment Sectors to Watch in 2025:Future of Global Capital1. Artificial Intelligence and Machine Learning
Artificial Intelligence (AI) and Machine Learning (ML) continue to be at the forefront of technological innovation. In 2025, AI is increasingly integrated into various sectors, including healthcare, finance, and manufacturing, driving efficiency and creating new business models. The proliferation of AI-as-a-Service platforms and advancements in natural language processing and computer vision are expanding the applicability of AI across industries.
Key Investment Areas:
AI Software and Services: Companies developing AI algorithms and providing AI solutions are experiencing rapid growth. Investments in AI startups and established tech firms focusing on AI capabilities are gaining momentum.
Automation and Robotics: The adoption of AI-driven automation in manufacturing and logistics is enhancing productivity and reducing operational costs. Investors are keen on companies leading in robotics and automation technologies.
AI Infrastructure: The demand for specialized hardware, such as AI chips and data centers optimized for AI workloads, is rising. Investments in semiconductor companies and cloud infrastructure providers are attracting attention.
Risks and Considerations:
Ethical and Regulatory Challenges: The rapid development of AI raises concerns about privacy, security, and ethical implications. Investors must stay informed about evolving regulations and public sentiment regarding AI technologies.
Market Volatility: The AI sector is characterized by high volatility, with startups experiencing significant fluctuations in valuations. Diversification and thorough due diligence are essential for mitigating risks.
2. Renewable Energy and Clean Technologies
The global shift towards sustainability is accelerating investments in renewable energy and clean technologies. In 2025, the International Energy Agency (IEA) projects global energy investment to reach a record $3.3 trillion, with $2.2 trillion allocated to renewables, nuclear, and energy storage—double the amount for fossil fuels.
Key Investment Areas:
Solar and Wind Energy: Solar energy leads clean technology spending with $450 billion expected, driven by increased exports to emerging economies. Wind energy financing, both onshore and offshore, grew by about 25%, particularly in China and Europe.
Energy Storage Solutions: Battery storage investment is rising to about $66 billion, addressing the intermittency of renewable power sources.
Grid Infrastructure: Investments in grid modernization and smart grid technologies are essential to accommodate the increasing share of renewable energy in the power mix. The IEA highlights a shortfall in grid infrastructure spending, currently at $400 billion annually, which lags generation investments and poses risks to electricity security.
Risks and Considerations:
Policy and Regulatory Risks: Changes in government policies and subsidies can significantly impact the profitability of renewable energy projects. Investors should monitor policy developments and government incentives in key markets.
Technological Risks: Advancements in energy storage and grid technologies are critical for the integration of renewable energy. Investors should assess the technological maturity and scalability of solutions offered by companies in this sector.
3. Healthcare Technology and Biotechnology
The healthcare sector is experiencing a technological renaissance, with innovations in biotechnology, digital health, and personalized medicine transforming patient care and treatment outcomes. The "biotech boom" refers to a period of rapid growth in the biotechnology sector, fueled by groundbreaking innovations, increasing investments, and expanding global demand for advanced medical, agricultural, and environmental solutions.
Key Investment Areas:
Biotechnology: Advancements in gene editing technologies like CRISPR, immunotherapies, and regenerative medicine are opening new frontiers in disease treatment. The biotech market is projected to grow from $1.74 trillion in 2025 to $5.04 trillion by 2034.
Digital Health: Telemedicine, wearable health devices, and AI-driven diagnostics are revolutionizing healthcare delivery. Investments in healthtech startups and digital health platforms are gaining traction.
Pharmaceuticals: The development of personalized medicines and targeted therapies is enhancing treatment efficacy and patient outcomes. Pharmaceutical companies focusing on innovative drug development are attracting investor interest.
Risks and Considerations:
Regulatory Hurdles: The healthcare industry is heavily regulated, and changes in regulations can impact the approval and commercialization of new therapies and technologies. Investors should stay informed about regulatory developments in key markets.
Clinical Trial Uncertainties: The success of biotech investments is often contingent on the outcomes of clinical trials. Investors should assess the risk profiles of companies based on their clinical trial pipelines and success rates.
4. Cybersecurity
As digital transformation accelerates, the need for robust cybersecurity measures becomes paramount. In 2025, the cybersecurity sector is experiencing heightened demand due to increasing cyber threats and regulatory requirements for data protection.
Key Investment Areas:
Cybersecurity Software and Services: Companies providing endpoint security, cloud security, and threat intelligence services are witnessing increased adoption across industries.
Identity and Access Management: Solutions that ensure secure user authentication and access control are critical as organizations move towards zero-trust architectures.
Security Infrastructure: Investments in hardware and infrastructure that support secure networks and data centers are essential for protecting organizational assets.
Risks and Considerations:
Evolving Threat Landscape: Cyber threats are constantly evolving, and companies must continuously update their security measures to address new vulnerabilities. Investors should assess the adaptability and innovation capabilities of cybersecurity firms.
Market Competition: The cybersecurity market is highly competitive, with numerous players offering similar solutions. Investors should evaluate companies based on their market positioning, technological differentiation, and customer base.
5. Infrastructure and Real Estate
Infrastructure development and real estate investments remain attractive in 2025, driven by urbanization, population growth, and government spending on public works. The global infrastructure investment gap presents opportunities for private capital to participate in large-scale projects.
Key Investment Areas:
Smart Cities: Investments in urban infrastructure, including transportation, utilities, and communication networks, are essential for developing smart cities.
Green Building Projects: Sustainable construction practices and energy-efficient buildings are gaining popularity, driven by environmental regulations and consumer preferences.
Public-Private Partnerships: Collaborations between governments and private investors in infrastructure projects offer opportunities for stable returns and long-term growth.
Risks and Considerations:
Political and Regulatory Risks: Infrastructure projects are subject to political decisions and regulatory approvals, which can impact project timelines and profitability. Investors should assess the political stability and regulatory environment of the regions where they invest.
Capital Intensity: Infrastructure investments often require significant capital outlays and have long payback periods. Investors should consider the liquidity and financial stability of infrastructure funds and projects.
Conclusion
The investment landscape in 2025 offers a plethora of opportunities across various sectors, each driven by unique technological advancements, societal shifts, and economic factors. While these sectors present promising growth prospects, they also come with inherent risks that require careful consideration and strategic planning. Investors should conduct thorough due diligence, diversify their portfolios, and stay informed about global trends to navigate the complexities of the evolving investment environment successfully.

ETH short trade Eth is very downtrend. Price is approaching to supply area with rsi indicating overbought level. We have a clean break of Structure which shows selling pressure is still active.
Moreover, with the multi time frame analysis, the price is below 200 ema which correlates with the 4hr, 1hr, 30m, and 15m, signaling a bearish bias.

Ethereum ShortAs U.S. Treasury yields and the U.S. dollar continue to strengthen, The crypto market continues its selloff. I have outlined some key areas where bulls will start to nibble on longs. Shorts are still open for at least another 2% down.

$ETH Bearish Short-Term (September 24, 2025)BINANCE:ETHUSDT
Summary of Price Action:
Recent Movement: In the last 24 hours, ETH has dropped by about 1.12%, reaching around $4,133 - $4,175 this morning (UTC). This follows a slight recovery from lows near $4,092 on September 22, but it's now retesting support at $4,100 amid strong institutional redemptions. In your 2H chart, we see a series of red candles (bearish) indicating selling pressure, with trading volume increasing during the decline, confirming seller interest.
Key Levels:
Support: $4,100 (immediate level, tested today) and $4,000 - $4,092 as a stronger lower zone. If $4,100 breaks, we could see a drop toward $3,900.
Resistance: $4,180 - $4,200 (strong level with recent rejections). A break above $4,200 would signal recovery toward $4,300.
Volume and Liquidity: 24-hour volume is around $34.8 billion, with large liquidations tied to $141 million in spot ETF outflows over the past day, mostly from institutional longs. This shows smaller traders suffering from bearish pressure.
MACD Indicator Analysis :In the chart you sent, the MACD line (blue) is crossing below the signal line (orange), with the histogram turning more negative (red bars growing). This indicates a bearish divergence – the price is weakening while momentum is losing strength. MACD is below the zero line, confirming a weak short-term trend. RSI (at similar levels) is around 40-50, signaling lightly oversold, but still without strong buy signals.
Overall Trend:
Bearish Short-Term, Bullish Long-TermShort-Term (Today/Next Day): Bearish.
The price is consolidating in a bearish channel, with predictions for further downside toward $4,000 - $4,092 today or tomorrow, due to fear sentiment and pressure from ETF outflows. This matches your chart, where we see a potential descending triangle pattern (but still uncertain). Avoid immediate buys – wait for confirmation below $4,100 for shorts or above $4,180 for longs.

Critical Moment for ETH – Support or Breakdown?Ethereum is sitting on the key $4,000 level with strong downward momentum. The big question: will this support hold or break? I’ve been saying for a while that $3,500 is still on the table.

Ethereum $ETH similar price action to late JuneIt's not perfect look to see CRYPTOCAP:ETH losing the daily range
However, the current PA oddly reminds me of one from late June
RSI and AO are similar as well
The next few days will be interesting to see if they are trying to scare the paper hands before the generation run, or the generational run is getting postponed for now

Elliott Wave Ethereum / Fibonacci LevelWave C Progress:
Wave C has already reached 100% of Wave A.
Price is sitting near the 0.618 retracement of the previous 12345 impulse wave.
Subwave Count Inside Wave C:
I have counted Waves 1, 2, 3 inside C.
If this sub-count is correct, a Wave 4 bounce is expected soon in the 4028 – 3978 zone.
Critical Levels
4028 – 3978.18: Expected bounce range (Wave 4 inside C).
3978.18: Key level — breaking it opens the door to deeper downside.
If broken, the next supports are:
3812 (1.272 extension)
3708 (0.786 retracement of entire impulse)
Implications
If 3978 holds, ETH may stage a corrective bounce (Wave 4) before a possible Wave 5 inside C.
If 3978 fails, 3812 and 3708 are the next tipping points where market makers/pattern traders might start accumulating for a new 12345 impulse set.
Watch for a bounce between 4028–3978.
Lose 3978, and 3812/3708 become the big decision zones for the next move.
ETHUSDT 1D chart Review1. Trendline (orange) - was clearly pierced down → it is a signal of weakening the growth moment.
2. Horizers of support / resistance:
• Resistance: $ 4,604 (strong), above $ 4,960.
• Support: $ 4 150 (currently tested), next $ 3,958 and $ 3,696.
3. Price - currently ~ 4 169 $, i.e. right with the support of $ 4 150.
4. Candles - a strong inheritance candle after piercing the trend → weakness signal.
5. STOCHASTIC RSI - in the sales zone (<20), which may suggest the possibility of short -term reflection.
⸻
🔹 Application:
• Short date: possible reflection from $ 4 150 thanks to the sale (technical bounce).
• average date: If level $ 4 150 breaks and the candle closes below → the road opens to $ 3,958 and even $ 3,696.
• Only a return above $ 4 272 and a retest trendline from below would give a signal of buyers.
⸻
👉 To sum up: The market is in the critical zone - support $ 4 150 decides.
• Bull: keeping the defense of this level + reflection from the sale.
• Bear: loss $ 4 150 = greater correction in the direction of $ 3 950–3 700.

ETHDCA zone 4100-4000 , Targeting 4384. Losing the 4150 area could potentially lead us down to the lower range where steeper liquidity is. considering BTC will be bouncing from 110k to 114k.

#ETHUSDT 4H ChartPrice is still consolidating with no major changes. MACS is neutral, RSI is sold and EMAs are turning bearish. Price needs to break and close above the resistance at $4,275 in order to expect further bullish movements. Waiting for confirmation.

Ethereum: Bounce From Support, Eyes on $4,740Ethereum: Bounce From Support, Eyes on $4,740
Ethereum has bounced from the $4,050–$4,100 support zone.
If momentum continues, the next targets are $4,335 and $4,495, with the main resistance at $4,740.
As long as ETH holds above the support, the outlook is bullish with potential continuation upward.
We are still in an uptrend and the current downtrend may have been a moment of accumulation before ETH moves further. We may be in something more complex and growing still.
A drop below the support zone of 4050 could change the scenario.
You may find more details in the chart!
Thank you and Good Luck!
❤️PS: Please support with a like or comment if you find this analysis useful for your trading day❤️

ETH Update📊 Current Setup
ETH’s just floatin’ in consolidation mode 😴. But zooming out on the higher TFs, the tide looks like it’s leanin’ toward an upward retrace 🌊.
🚦 Scenarios
👉 If this range breaks to the upside, first target’s hangin’ around $4400 🎯.
👉 If not, we’re stuck in chop city — no clean wave, no clean ride.
🧭 My Take
Patience = profits 💯. Sometimes the best move is lettin’ the chart tell its story instead of forcing a trade.
❓ What’s Your Read?
You think ETH’s ready to break out, or do we drift sideways longer? Drop your vibe below 👇

ETH Accumulation Trap ENTRY NOWI put analysis in previous ETH setup today.
TP Sl entry are good to go on this trade. The next hour might need to temporarily lift SL. Trade smart?!

Ethereum Bounces From $4,161 Zone as Bulls Eye ReversalEthereum is holding firm at $4,161, a level reinforced by the 0.618 Fibonacci retracement and VWAP SR. Traders are watching for a bottoming structure to confirm a potential reversal.
Ethereum’s correction has carried price into one of its most technically significant zones. The $4,161 level is not only structurally important but also aligns with multiple technical tools, including the 0.618 Fibonacci retracement and VWAP SR. This confluence makes the current area a strong candidate for reversal, though confirmation of a bottoming structure is still required on the lower timeframes.
Key Technical Points:
- $4,161 Support Zone: Anchored by Fibonacci and VWAP SR.
- Bottoming Structure Needed: Short-term reversal hinges on confirmation.
- Macro Trend Intact: ETH remains within long-term bullish trajectory.
Main Analysis:
Ethereum’s ability to respect confluence zones has been a hallmark of its market structure in recent months. The current bounce at $4,161 is another example, aligning with both the 0.618 Fibonacci retracement and the VWAP SR. These tools highlight the strength of this level, making it a technical battleground between bulls and bears.
While the bounce is encouraging, traders must wait for confirmation of a bottoming structure. Without a clear reversal signal — such as a double bottom, higher low, or bullish divergence — the risk of another leg down remains. However, given Ethereum’s placement in a macro bullish uptrend, the probability of this zone holding is strong.
Momentum indicators are also beginning to stabilize after recent corrective pressure. This suggests selling exhaustion, which often precedes accumulation phases before the next impulse. If bulls can sustain demand here, Ethereum could rotate back into resistance levels, continuing its larger uptrend.
Market structure context further supports the bullish case. ETH has consistently established higher lows, and another hold here would reinforce that pattern. Historical reactions from confluence zones like this have led to meaningful rallies, adding conviction to the current setup.
What to Expect in the Coming Price Action:
Ethereum is likely to confirm a reversal if a bottoming structure forms at $4,161. A bounce from this confluence could drive price back into resistance zones, while failure would open the door for deeper testing. Overall, the macro bullish structure remains intact.

ETH is Sinking Deep: Strong Downtrend and Big SELL Opportunity!Currently, ETH/USDT is under strong selling pressure due to both fundamental and technical factors . According to the latest news, over 2.6 million ETH (equivalent to about $11.7 billion ) is waiting to be withdrawn from the Ethereum network. When these ETH are released, it will create significant selling pressure, greatly affecting ETH's price in the short term. This could lead to investor anxiety and a potential sell-off, diminishing confidence in the market.
From a technical perspective , the chart shows a descending wedge, with lower highs and the current bottom becoming weak. It is highly likely that ETH will drop to the support level at $4,110 before making any new moves.
Given these factors, the appropriate trading strategy is to open a SELL order if the price cannot break through the resistance at $4,410 and falls below the support at $4,110. The Stop Loss should be placed at $4,450, just above the resistance, and Take Profit at $4,110.
In conclusion, ETH is facing a strong downtrend in the short term. Investors should keep an eye on the market and open a SELL order as the price continues to drop.

ETH Accumulation TrapdoorTrade Type: Controlled Bounce Long
Smart-money accumulation schematic, not trend breakout
3x Leverage (Max)
Valid potential 3–7 day tactical window
Pre-October macro bull run move
🔸 Entry Zone 1: $3,999 – $4,010
Must see all:
Only if 5m/15m BOS + FVG tap
LTF volume spike into structure
Bullish engulfing over previous 3 candles
Low skew in funding (<0.1%)
No macro weakness on BTC/ES
🔸 Entry Zone 2: $3,880 – $3,900
Must see all:
4H order block/FVG fill
LTF CHoCH + BOS
Wicking below $3,888 followed by fast recovery
No 4H close below $3,850
Entry 1 fills first, Entry 2 follows only if pullback comes.
Hard Stop: $3,800
Stop details: 1H/4H close + follow-through. Total exit. No re-entry without full reanalysis.
Soft Exit Protocols
At $3,850 sweep + spike: reduce 50%
$3,820 close without reversal: scale out 75%
HTF bearish engulfing near $3,800: full exit
TP Protocol
TP1: $4,130
Auto-sell 60% of position
TP2: $4,250
Close remainder or trail to $4,320
Optional TP3: $4,320 – $4,350
For breakout runners only
Trail SL under 1H swing low every $15 move
For Emergency Re-Entry
Scenario: ETH dumps to $2,950 – $3,050
Do not long immediately
Wait for:
Long lower wick rejection
New bullish FVG on 15m/1H
BOS back above $3,150
Then: Long with original TP plan, new SL = $2,850
Risk
Risk per Trade: 1.5% max account equity
Entry 1: 40% allocation
Entry 2: 60% allocation
NO compounding or pyramiding
Leverage Rules
Max 3x isolated
Must have 4H stop loss placed in system
Immediate invalidation:
If BTC breaks below $110.6K: close all ETH longs
If funding spikes above 0.18%: scale down or exit
Not financial advice.

Ethereum analysisIt’s been nearly 44 days that the price has been moving inside a range, and now it has reached the bottom of the range channel.
On the higher cycles, Ethereum’s trend is bullish, and as long as the 3700 support zone is not broken, we should continue to look for long positions.
There’s also a high probability that the price will move toward the decision-making zone. ✅
ETH ANALYSISETH has broken above the long-term trendline, a major structural shift on the weekly chart.
From here, I think price may pull back to retest the trendline along with the bull market support band.
If that retest holds and momentum stays constructive, ETH could bounce strongly and eventually push toward making a new all-time high.
🎯 Conclusion: My view is bullish in the bigger picture — I expect ETH to retest the trendline and bull market support band before attempting a major breakout to new highs.
