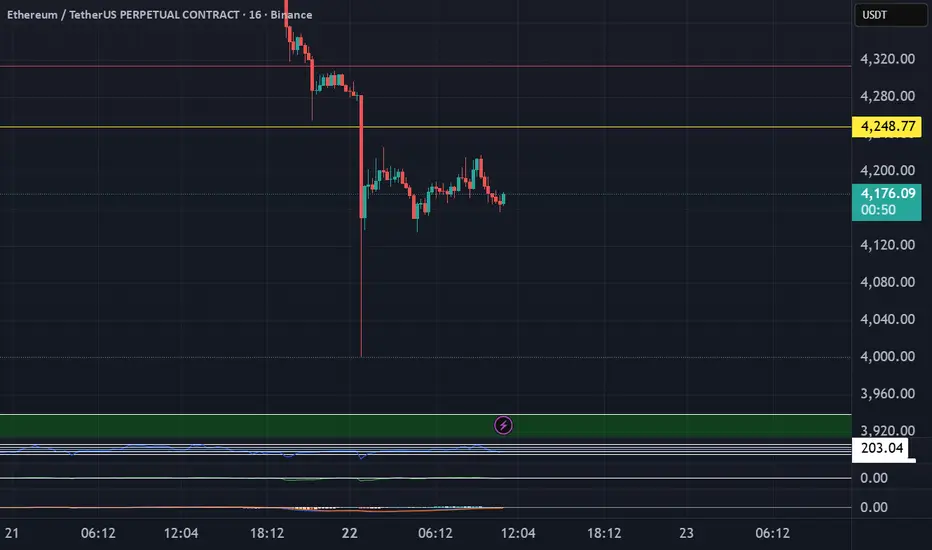
ETH Short Trade Trend: Bearish
Divergence: None
Continuation Pattern: Bearish Flag
Harmonics : AB=CD
Bias: Bearish
Scenario: Sell Stop entry at B point Breakout
*Trade Plan*
Stop Loss: 4220
Entry Level: 4040
TP1: 3860
ETHUSDT.3S trade ideas

ETH all time high or reverse????Ethereum has returned to the top after a long time and is on the verge of breaking the top, but in my opinion this will not happen. Of course, it is possible to see new prices, but then it will enter a correction and this will happen in the next move that will start in the future.
So we should wait for a very good entry with a cheap and lower price.
Stay with me and boost me after introducing me to your friends.
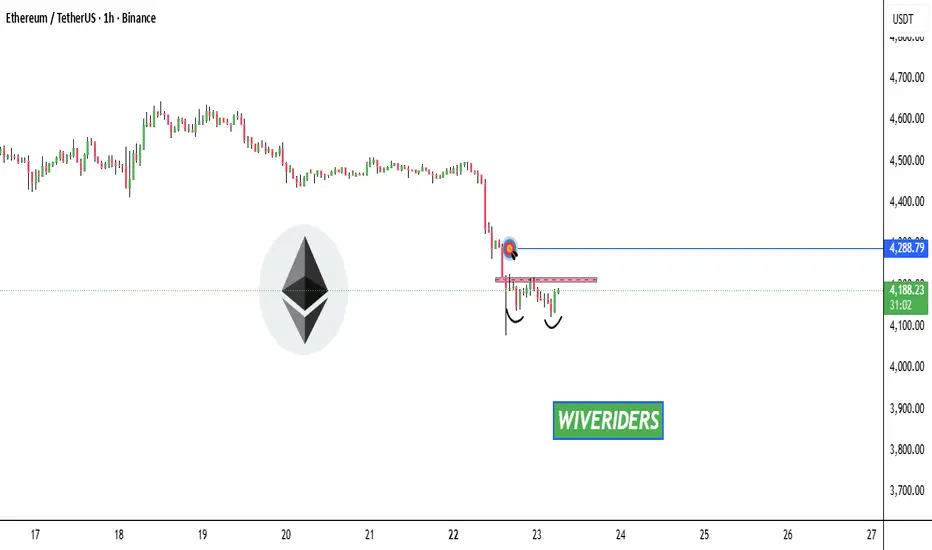
ETH has formed a potential Double Bottom pattern 📊 CRYPTOCAP:ETH Market Update
CRYPTOCAP:ETH has formed a potential Double Bottom pattern ✅
It’s now testing the red resistance zone 🔴 — if it breaks out with confirmation, the first target will be the blue line level 🎯
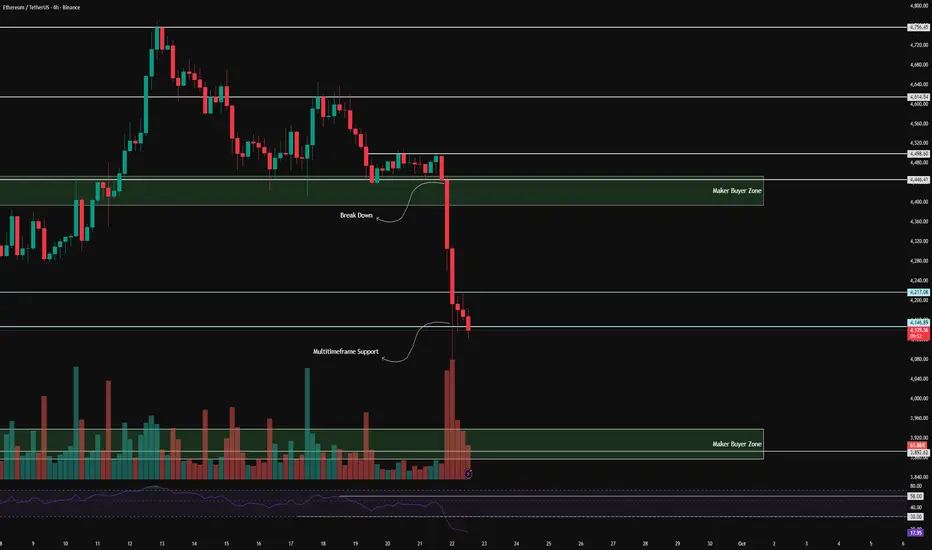
ETH 4H Analysis - Key Triggers Ahead | Day 25😃 Hey , how's it going ? Come over here — Winter got something for you!
⏰ We’re analyzing ETH on the 4-Hour timeframe.
👀 On the 4H timeframe for Ethereum, we can see that after breaking below its maker-buyer zone, ETH moved down toward lower support levels, experiencing a **7% drop** — an unexpected move that even pushed major holders to sell. Ethereum is now sitting at a **multi-timeframe support zone**, and if this level is lost, it could head toward the next lower maker-buyer area, where we’ll need to observe how price reacts.
🧮 The **RSI oscillator** shows ETH deep in the **oversold zone** with heavy selling pressure. Buyers have yet to step in, meaning that with more sell-side momentum, Ethereum could remain oversold for an extended period.
🕯 The **size and volume of red candles** have increased sharply in a short span of time. This fast move down with fewer candles signals **strong selling sentiment**, while price itself looks uncertain about its next direction.
💸 Looking at **ETHBTC**, the pair experienced a sharp drop and deep correction with the start of the new week. It is also resting at a multi-timeframe support zone. If that breaks, Ethereum could face a further correction.
🧠 As for positioning, it’s still early. We’d prefer to wait for the market to build a stronger structure and possibly a wider range before entering. A **short position below the 4147 support** is possible with low risk, but since RSI remains heavily oversold, we must also consider the potential for a **price rebound**.
❤️ Disclaimer : This analysis is purely based on my personal opinion and I only trade if the stated triggers are activated .
EthusdMarket sentiment is in fear mode , a good buying opportunity for institutions . High daily inflows means they are buying . a high weekly net outflows from exchanges means accumulation likely . a very high open interest means volatility it dropped 6% today This is just liquidation of over leverage longs. I think the price moves up from here

Ethereum 4250 breakAs i said in my last post, A daily close below $4,250 will take Eth down at least 8% from that level.
Showing second chance wayching multi timeframe RSI'sShowing second chance wayching multi timeframe RSI's - More of swing ideas using Price Action Reader

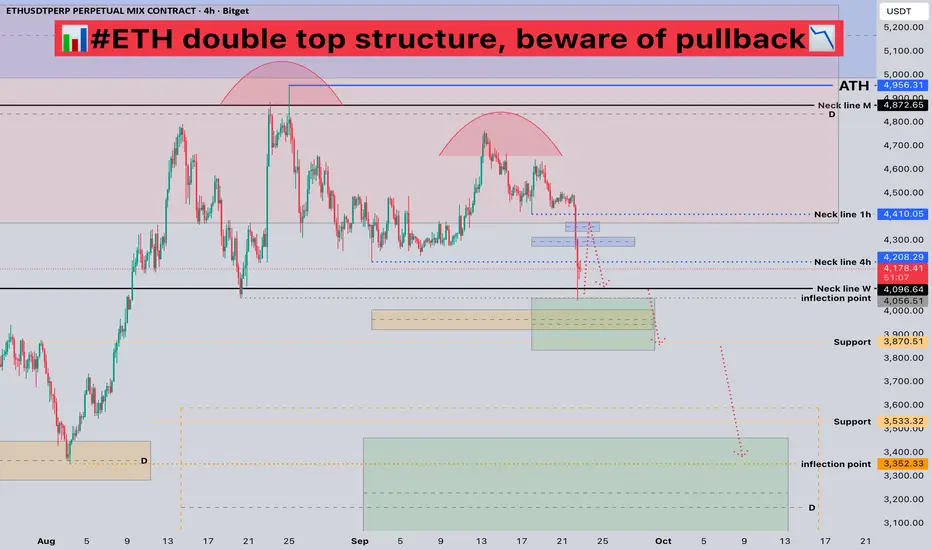
#ETH Double Top Structure, Beware of Pullback📊#ETH Double Top Structure, Beware of Pullback📉
🧠From a structural perspective, we've formed a bearish double top structure within the red target zone, so be wary of a deeper pullback.
➡️After today's plunge, we retested the weekly neckline support. We're currently in a rebound phase and have encountered resistance at the 4H neckline. Don't chase the rally here! Strong resistance lies around 4300-4400. If price reaches this level, look for shorting opportunities.
🤜If you like my analysis, please like 💖 and share 💬
BITGET:ETHUSDT.P
Trading plan for EthereumToday, Ethereum showed a sharp drop, reaching the support zone and now showing a local bounce. An ABC correction is clearly visible on the chart.
If the 4,000 level breaks, we could see a decline toward 3,600 . Before that, the price may show an upward correction toward 4,300 . Bullish sentiment will only return after breaking 4,500 — until then, the price remains in correction.

ETH - 17/09 VS TODAY - MASTERCALL AGAIN! 🏆 #ETH - 17/09 vs Today - Update 🔄
Medium-Term Outlook: “Insane Plays Ahead!” 🔥
🎯Targets hit: $4,000–$4,050 liquidity zone ✔️
Current TA:
🔸Price rejected sharply; H4 looks bearish, RSI is highly oversold.
🔸Short-term: potential for a relief bounce!
🔸Possible scenario: Retest of the $4,300–$4,350 former support ahead? 📈
Weekly Structure
🔹Bias stays bullish long-term.
🔹BUT: Structure reminds me a lot of #BTC right before its massive run!
🔹Are we about to see an extra dip towards $3,700- $3,800 before the next moon mission? (Check chart for context!)📉💣
Short-Term Bias
🔹Price action = Neutral & tricky.
🔹Bulls want a reclaim above $3,780 to keep the upper hand.
🔹Big risk: If we break below $3,780 → likely drop to $3,300–$3,200 range!⚠️
Local Support Zones
$4,070
$4,000
💡Summary
Still bullish medium/long term, but a further correction is very possible before liftoff!
Bulls need to hold $3,780. Below = trouble…Above = game still on for ATH attempts later. 📉

ETH Swing Long Idea - RDM is in playETH Swing Long Idea
📊 Market Sentiment
FED has resumed its rate-cutting cycle, starting with a 0.25% cut in September, with two more 0.25% cuts expected in the coming months. Additionally, institutional liquidity inflows have accelerated as the U.S. officially adopts crypto as part of its reserves. While inflation remains elevated, the weakening labor market is forcing the FED to ease, driving more capital into risk-on assets.
📈 Technical Analysis
Price is in HTF bullish order flow, so I will only be looking for long setups.
ETH made its all-time high and is currently retracing to gather more energy for higher moves.
Price also ran the HTF Range Low liquidity, which contained significant liquidity — an engineered move I expect to lead the market higher.
📘 Range Deviation Model (RDM)
In this model, I define the HTF Range High/Low. I wait for price to run one side of the range liquidity (either Range High or Range Low), then close back inside the range. That becomes the entry trigger, targeting internal range liquidity first. If HTF trend supports, the opposite range liquidity becomes the full target.
📌 Game Plan
I will be playing the Range Deviation Model (RDM) here.
Looking for a daily close above 4065$ as validation.
🎯 Setup Trigger
Entry after daily close above 4065$.
📋 Trade Management
Stoploss: 4000$
Targets:
TP1: 4484$
TP2: 4700$
TP3: 4965$
💬 Like, follow, and comment if you find this setup valuable!
⚠️ Disclaimer: This content is for informational and educational purposes only and does not constitute financial, investment, or trading advice. Always DYOR before making any financial decisions.

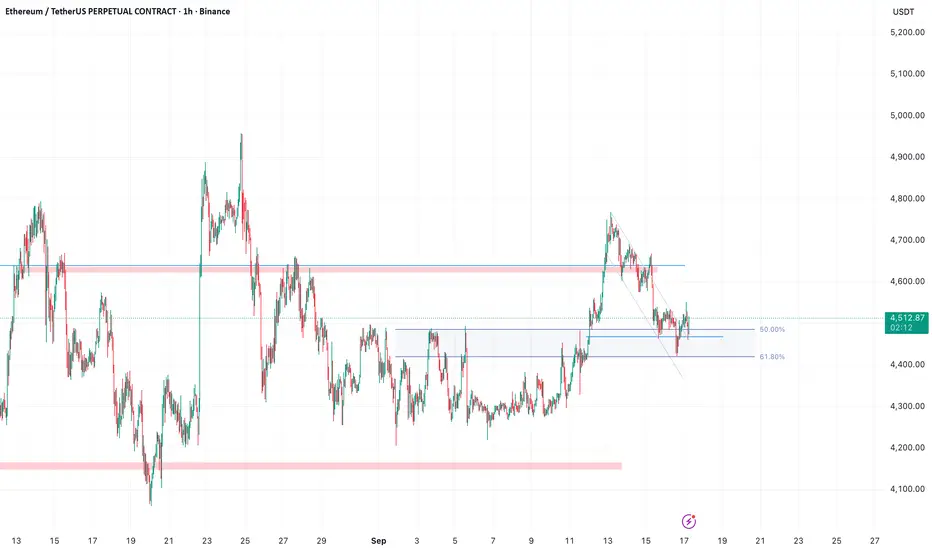
$ETH Cup and Handle --> around ATH {Breakout possibility}While we dance around the break of the previous ATH, there's a likelihood that we see newer, higher prices by the end of the week/month.
Price is around $4500 and sees recurring sponsorship to stay above $4400 (61.8% fib)
Could this be the >$5k/ETH month?
Bullish indicators described in chart
cup and handle pattern
price above 50% fib swing
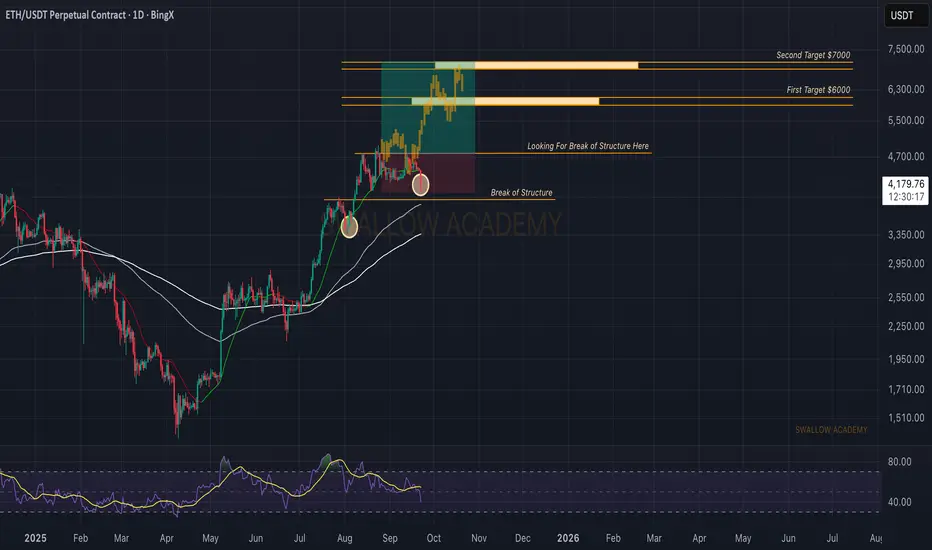
Ethereum (ETH): Bloody Hell, What a Sharp Start of MondayEthereum is showing similarities to the earlier push where we saw a shakeout (marked in the previous circled zone) before continuation to the upside. Currently, we’re seeing another break of structure, but as long as price holds above EMAs, the setup remains bullish. This could very well be another trap before the next leg up. First target stays $6,000, with the second target at $7,000 if buyers maintain control and secure higher levels.
Swallow Academy
Ethereum (ETH): Failed To Breakout | Waiting For MomentumEthereum is still pressing right against the breakout zone, but buyers haven’t secured it yet. We’re seeing rejection wicks near resistance, showing clear hesitation in the market. As long as the price holds above the lower channel and EMAs, the structure remains bullish. A confirmed breakout here could open the path toward $7,000 first, with $9,000 as the major target.
Swallow Academy

#ETHUSDT 12H ChartPrice broke below the 4h demand zone at $4,400 turning it into a 4h breaker zone. MACD is bearish, RSI is nearly oversold and EMAs are neutral. Price bounced off the support at $4,080 after sweeping the equal lows at $4,200 and we should see a retest of the S/R flip at $4,260 as a short-term target.

Long trade
30min TF overview
Pair: ETHUSDT
Direction: Buyside trade
Date/Session: Fri 19th Sept 2025, NY Session PM
Timeframe: 30-Min
🔹 Trade Details
Entry: 4461.47
Profit Level: 4855.75 (+8.89%)
Stop Level: 4416.04 (-1.00%)
Risk-Reward (RR): 8.59
🔹 Technical Structure
Fair Value Gaps (FVGs):
Overhead FVGs at ~4655 – 4855 are acting as a potential magnet for liquidity.
Liquidity Levels:
Clear sweep of prior lows around 4460 (stop hunt/liquidity grab).
Buyside liquidity resting above 4650–4700.
Order Blocks / Demand Zones:
Strong demand block at ~4450–4460 region, now acting as support.
🔹 Indicators
RSI: Deeply oversold (below 30), hinting at bullish reversal probability.
Volume: Large spike at lows, confirming stop run and potential smart money entry.
Moving Averages: Price reclaiming short-term EMA, indicating early momentum shift.
🔹 Narrative / Trade Rationale
Market engineered a stop hunt into demand at 4460 before reversing.
High volume and RSI oversold strengthen the buy-side reversal case.
The trade aims to capitalise on the move back into inefficiencies (FVGs) left behind by the previous sell-off.

ETH New Update (4H)This analysis is an update of the analysis you see in the "Related publications" section
Honestly, as you know, the market had been ranging for several days without much movement. On the chart, we had signs of a drop, but the drop didn’t happen, and instead the market dropped in a way that was shown.
Considering that the demand zone has held and the market is still ranging, we can return to the scenario of (this analysis () and expect to see some recoveries from Ethereum.
Either Ethereum can get rejected from the identified supply zone, or it can make a new all-time high afterwards.
For risk management, please don't forget stop loss and capital management
When we reach the first target, save some profit and then change the stop to entry
Comment if you have any questions
Thank You

ETHUSDTHello Traders! 👋
What are your thoughts on Ethereum?
Ethereum has recently broken above the key resistance area near 4100, printing a new high slightly above the previous peak. After this breakout, price action has entered a corrective phase, suggesting a healthy pullback.
This correction is currently forming a bullish flag pattern, which may act as a continuation setup.
As long as ETH remains above the highlighted support zone, the bullish scenario remains valid. A confirmed breakout from the flag formation could trigger the next impulsive wave, potentially leading to fresh all-time highs.
Keep a close eye on the flag breakout and watch for bullish momentum to resume once the consolidation completes.
Don’t forget to like and share your thoughts in the comments! ❤️

Understanding Currency Derivatives: Types and Trading Roles1. Types of Currency Derivatives
Currency derivatives come in several forms, each designed to serve specific purposes. The main types are:
1.1 Currency Forward Contracts
What they are: A forward contract is a private agreement between two parties to exchange a specific amount of currency at a predetermined rate on a future date.
Key features:
Customized terms (amount, rate, settlement date)
Traded over-the-counter (OTC), not on exchanges
Use in trade:
Companies use forwards to hedge against currency fluctuations. For example, an exporter expecting $100,000 in 3 months can lock in a rate today, ensuring revenue stability regardless of market movements.
1.2 Currency Futures
What they are: Futures are standardized contracts to buy or sell a currency at a fixed price on a future date. They are traded on exchanges, unlike forwards.
Key features:
Standard contract sizes
Daily settlement (marked-to-market)
Reduced counterparty risk due to exchange involvement
Use in trade:
Futures allow both hedgers and speculators to manage risk. For example, an importer can lock in costs for future purchases in foreign currency using futures contracts.
1.3 Currency Options
What they are: Options give the holder the right, but not the obligation, to buy or sell a currency at a specific price within a certain period.
Types:
Call option: Right to buy
Put option: Right to sell
Use in trade:
Options are popular for hedging with flexibility. For example, an exporter may buy a put option to protect against a falling foreign currency while still benefiting if the currency rises.
1.4 Currency Swaps
What they are: A swap is a contract to exchange cash flows in one currency for cash flows in another over a period.
Key features:
Can involve both principal and interest
Often used between banks or large corporations
Use in trade:
Swaps help companies obtain foreign currency loans at better rates than borrowing directly in foreign markets.
1.5 Cross-Currency Contracts
What they are: These contracts allow the exchange of currencies without involving a common base currency like the USD.
Use in trade:
Useful for companies trading between countries whose currencies are not widely paired, e.g., INR and JPY.
2. Role of Currency Derivatives in Trade
Currency derivatives serve multiple roles in global commerce:
2.1 Hedging Against Currency Risk
Companies engaging in international trade face unpredictable currency movements.
By locking in exchange rates using derivatives, businesses stabilize revenue and costs.
Example: An Indian IT company exporting to Europe can hedge against the euro weakening against the rupee.
2.2 Speculation
Traders and investors use currency derivatives to bet on currency movements to make profits.
Speculation adds liquidity to the market, which indirectly benefits businesses by making it easier to execute hedging strategies.
Example: A trader may buy USD futures if they anticipate the dollar will rise against the rupee.
2.3 Arbitrage Opportunities
Arbitrage involves exploiting price differences in the same currency across different markets.
Currency derivatives allow arbitrageurs to profit from mismatches while keeping markets efficient.
Example: If EUR/USD is slightly higher in one exchange than another, a trader can simultaneously buy low and sell high.
2.4 Portfolio Diversification
Investors use currency derivatives to diversify their portfolios by gaining exposure to foreign currencies.
This can help mitigate risks from domestic market volatility and improve returns.
Example: A mutual fund in India may use currency options to reduce risk exposure from foreign investments.
3. Market Participants
The main participants in currency derivatives markets include:
Hedgers – Companies or institutions aiming to reduce currency risk.
Speculators – Traders aiming to profit from currency movements.
Arbitrageurs – Market participants exploiting price differences across markets.
Market Makers – Entities providing liquidity, ensuring smoother trading operations.
4. Regulatory Framework
In India, currency derivatives are regulated by:
SEBI (Securities and Exchange Board of India): Ensures transparency and fair trading practices.
RBI (Reserve Bank of India): Ensures participants have genuine foreign currency exposure to prevent excessive speculation.
This regulatory framework ensures the market remains safe, transparent, and reliable.
5. Advantages of Currency Derivatives
Risk Management: Protects businesses against unexpected currency fluctuations.
Flexibility: Especially with options, businesses can choose to benefit from favorable movements while limiting losses.
Liquidity: Standardized contracts in futures and options provide liquidity to the market.
Efficient Global Trade: Reduces uncertainty in cross-border transactions, encouraging international business.
6. Challenges and Risks
Market Risk: Currency values can be volatile; wrong predictions can lead to losses.
Counterparty Risk: In OTC contracts, one party may default.
Complexity: Some derivatives like swaps are complex and require expertise.
Regulatory Constraints: In some countries, rules may limit derivative usage or impose restrictions.
Conclusion
Currency derivatives are indispensable tools for modern international trade. They allow businesses to manage risk, stabilize cash flows, and plan effectively. At the same time, they provide opportunities for traders and investors to profit from currency movements and engage in arbitrage.
By understanding and using these instruments responsibly, companies can reduce uncertainty in global transactions, while financial markets benefit from improved liquidity and efficiency.
With increasing globalization and cross-border trade, the importance of currency derivatives will continue to grow, making them a critical part of financial markets worldwide.
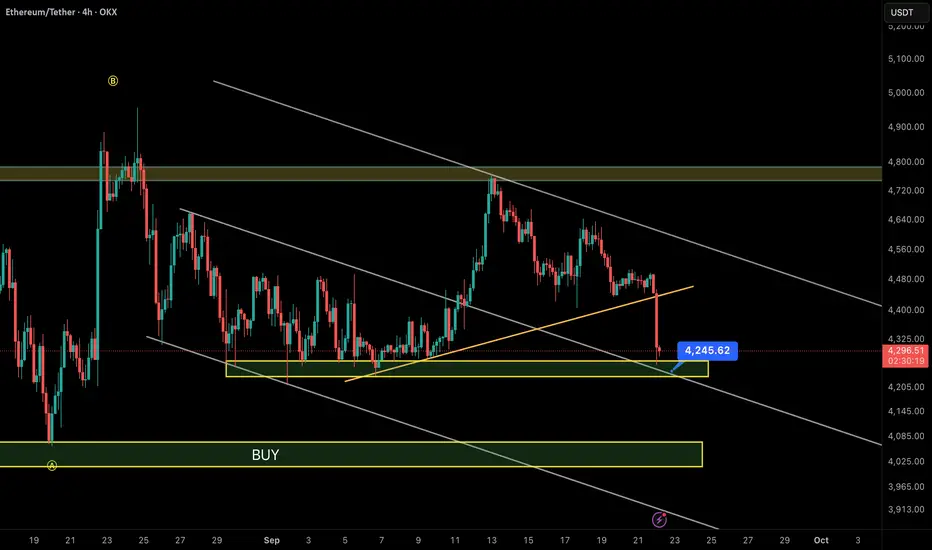
Ethereum at Critical Support – What’s Next?📊 ETH/USDT – 4H Chart Analysis
1️⃣ Descending Channel:
Ethereum is still moving inside a clear descending channel. Sellers remain in control as every rally to the channel top has been rejected.
2️⃣ Trendline Break:
The short-term ascending trendline (orange) has just been broken with strong selling pressure, dragging the price into the $4,200 – $4,250 support zone.
3️⃣ Key Support Zone:
The first major support lies at $4,200 – $4,250. If this level holds, ETH could see a short-term rebound toward $4,400 – $4,600.
4️⃣ Main Buy Zone:
If $4,200 fails, the next strong demand zone sits at $3,950 – $4,100, aligning with the lower boundary of the descending channel. This is where stronger buying interest is expected.
5️⃣ Resistance Levels:
• Near-term: $4,450 – $4,600
• Major: $4,750 – $4,800
⚖️ Summary:
• Bullish scenario: Holding $4,200 → bounce to $4,400 / $4,600.
• Bearish scenario: Losing $4,200 → drop to $4,000 – $3,950 (main BUY zone).
👉 At this stage, trading in the middle of the channel is risky. Safer entries come either near $4,000 – $4,100 or after a confirmed breakout above $4,600.
ETH - Roll back - Its coming baack to 4500SO mods told me to write it big, so eth looks good for a pullback like I have drawn and corresponding to it, moves super well as seen and what.i drew

Volatility Period: Around September 18th (September 17th-19th)
Hello, fellow traders!
Follow us to get the latest information quickly.
Have a great day!
-------------------------------------
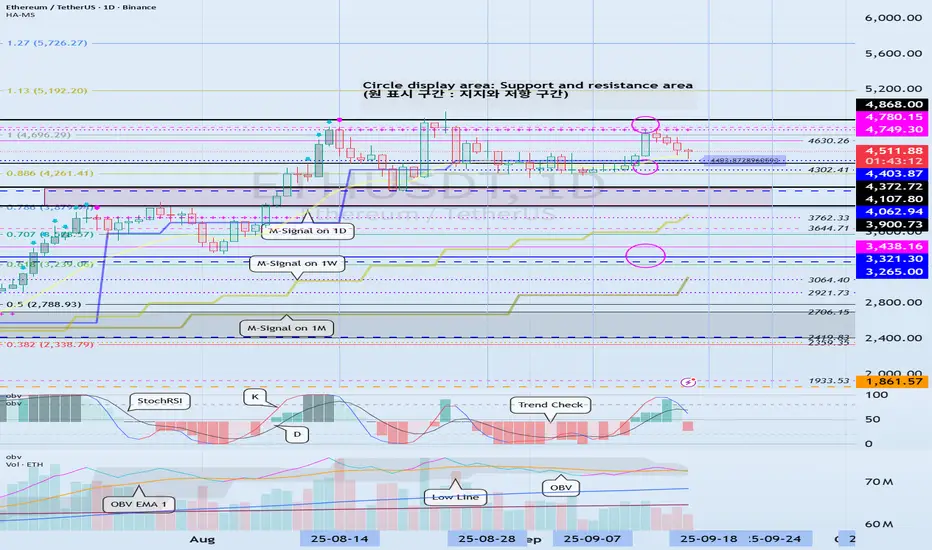
(ETHUSDT 1D Chart)
The 4403.87-4749.30 range, which is the HA-High ~ DOM (60) range, represents a resistance zone.
Therefore, we need to monitor the price movement after the current volatility period, around September 18 (September 17-19).
To sustain the uptrend, the price must remain above the 3900.73-4107.80 range.
From a medium- to long-term perspective, the 3265.0-3321.30 range is a key area.
Considering the above, if it falls below 4403.87,
1st: 4107.80-4372.72
2nd: 3265.0-3321.30
Therefore, it is likely to fall to the first and second levels above.
Therefore, the key question is whether it can find support near 4403.87 after this period of volatility.
-
When trading, it's important to understand the current price level.
I believe there are several ways to determine this.
My basic trading strategy is to determine when to trade.
My basic trading strategy is to buy when support is found in the DOM(-60) ~ HA-Low range and rise, and to sell when it touches the HA-High ~ DOM(60) range.
However, if the price rises in the HA-High ~ DOM(60) range, a step-like upward trend is likely, while if it falls in the DOM(-60) ~ HA-Low range, a step-like downward trend is likely.
Therefore, the basic trading strategy should be a segmented trading strategy.
If you were unable to buy in the DOM(-60) ~ HA-Low range, but the current price is within the DOM(-60) ~ HA-Low range, you should check for support.
Support is determined by checking whether support is found near the HA-Low or DOM(60) indicators.
If you bought when support was found near the HA-Low indicator, the first sell position would be near the DOM(60) indicator.
If you bought when support was found near the DOM(60) indicator, you should execute the trade quickly and effectively.
If the price falls below the purchase price, it would be considered a buy at the high.
To prevent this to some extent, we've utilized several indicators for verification.
First, we utilize the M-Signal indicator on the 1M, 1W, and 1D charts.
That is, if the M-Signal indicator is passing near important support and resistance levels, the presence of support in that area is likely to play a more important role.
Currently, the M-Signal indicator on the 1D chart is passing near 4403.87, so we should consider the area around 4403.87 as a potential important support and resistance level.
Second, we should monitor the movements of auxiliary indicators such as the TC (Trend Check) indicator, the StochRSI indicator, and the On-By-Signal (OBV) indicator.
For the price to continue its upward trend in this important support area,
- the StochRSI indicator must show an upward trend. If possible, it's best to avoid entering the overbought zone.
- The OBV indicator should be showing an upward trend. If possible, it should remain above the High Line.
- The TC (Trend Check) indicator should be showing an upward trend. If possible, it should remain above the 0 level.
By monitoring the movements of the three indicators above, you can determine whether there is support near important support and resistance levels.
However, you should not blindly trust the movements of auxiliary indicators. Even if you have identified the movements of auxiliary indicators, you should always monitor the price movement.
To determine support, you should monitor the price movement for at least 1-3 days.
This is especially important during periods of volatility.
Volatility is a period where you cannot predict the direction of movement, so extra caution is required.
Therefore, if possible, it's better to observe the situation and find a trading opportunity after the volatility period has passed rather than entering a new trade during a volatile period.
-
Thank you for reading to the end. I wish you successful trading.
--------------------------------------------------
- Here's an explanation of the big picture.
(3-year bull market, 1-year bear market pattern)
I'll explain more in detail when the bear market begins.
------------------------------------------------------
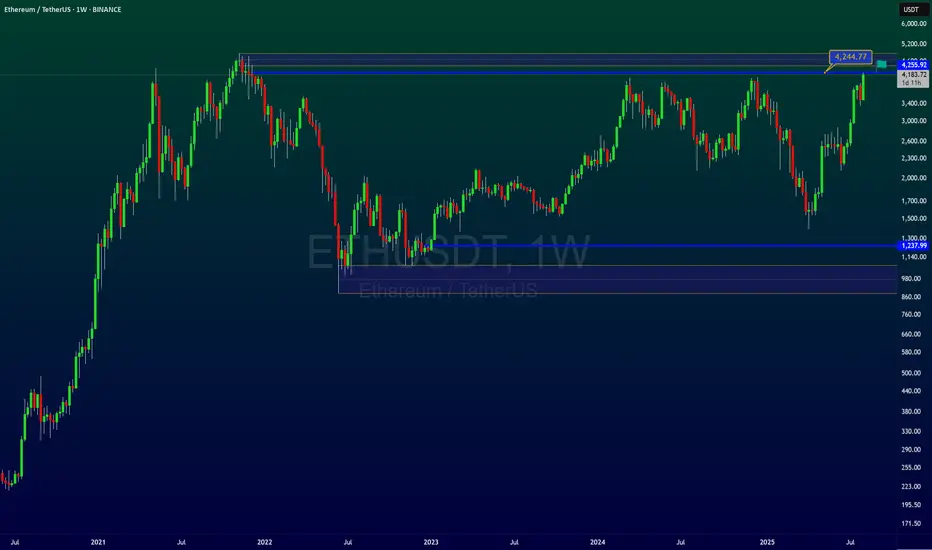
Ethereum at Weekly Supply Zone – Possible Drop AheadHello everybody,
Price is currently at the weekly supply zone.
It has broken an upward trendline and pulled back to retest it.
A decline from this area is expected.
The most likely target is the nearest demand zone, around 3800.
Manage your risk and trade safe!
