Ethereum Price Steady at $4,500—Here’s What’s Ahead For ETHEthereum’s price is currently trading at $4,468, just shy of the $4,500 resistance. The altcoin has been consolidating near this level, showing resilience even as broader market trends remain mixed.
Given the supportive market sentiment and accumulation trend, Ethereum is poised to reclaim $4,500 as a support floor. Successfully flipping this level could pave the way for ETH to challenge the $4,775 resistance in the coming days.
However, downside risks remain if bearish pressure builds. In such a scenario, Ethereum could lose footing and slip to the $4,307 support level. A drop to this zone would invalidate the bullish thesis temporarily and deepen potential investor losses
ETHUSDT.3S trade ideas

ETH 1H Analysis - Key Triggers Ahead | Day 24😃 Hey , how's it going ? Come over here — Winter got something for you!
⏰ We’re analyzing ETH on the 1-Hour timeframe.
👀 On the 1-hour timeframe for Ethereum, we can see that after testing its major buyer zone, ETH bounced and entered a consolidation phase. This sideways movement is mainly due to the weekend slowdown. I’ve highlighted the range boundaries — a breakout above or below will provide us with trading opportunities. ETH is one of the few coins that has managed to hold its ground at a solid price level, showing strong potential for further growth.
🧮 Looking at the RSI oscillator, we’ve identified two key levels 30 (oversell) & 58 (local RSI ceiling) If ETH breaks these levels, it could trigger a breakout from this tight range and start a stronger move.
🕯 Currently, the green candles are larger in size and volume, but since it’s the weekend, ETH has been mostly off traders’ watchlists. We need to wait for the new weekly open to see how market participants will react.
💸 On the ETHBTC pair (1H timeframe), we’re seeing a similar setup to ETHUSDT. A breakout above or below the current range could start the next move. Adding this pair to the watchlist can provide confirmation for Ethereum setups.
🧠 For a long position on ETH, it’s important that the coin enters a clear buying phase — similar to the strong pumps we’ve seen before. Recently, however, ETH has faced profit-taking and sharp sell-offs after rallies. The coming week will show us whether this pattern continues or a stronger bullish move emerges.
❤️ Disclaimer : This analysis is purely based on my personal opinion and I only trade if the stated triggers are activated .

ETH-bias long once breaks the resistance Bullish indications:
HHHL
Trend line support respected.
MA 21 being respected.
Fib level 0.6618 respected
Bullish engulfer candle from support in 4 hr
IHS formation in 30 min.
Bullish divergence in 15 min.
Days support respected
Bearish indications:
Bearish divergence in daily
MA 21 being respected in 2 hr
Trade plan bias long @4489 buy stop
SL:4434
TP1:4542
TP2:4595

ETH Potential 4X profitsI will make it simple
The triangle has been broken and close above.
Loading . . . few months later

Ethereum: AI Models Signal Imminent Bear MarketOn August 24, 2025, Ethereum reached a new all-time high of $4,958, just below the $5,000 mark. The price is now about 10% lower but remains within striking distance. While investors are still hoping for further records, leading AI models warn that the next bear market could begin sooner than expected.
Historical Patterns
According to ChatGPT 5.0, Ethereum has historically shown sharper and faster corrections compared to Bitcoin:
During the 2017–2018 cycle, after reaching an all-time high of around $1,430 in January 2018, the price collapsed to $85 by December the same year. This represented a decline of roughly –94%, lasting about 11 months.
The next cycle in 2021–2022 followed a similar pattern, though less dramatic. ETH peaked at $4,870 in November 2021, but by June 2022 it had dropped to $880. The correction amounted to about –82% and took roughly 7 months.
ETH losses were both deeper and faster than BTC during past downturns.
ChatGPT 5.0 Forecast
• Bull Market ATH (2025): conservative $8,000, optimistic $12,000–$15,000
• Bear Market Low: $1,200–$3,000
• Timeline: Q2–Q3 2026
Other AI Forecasts
• Gemini 2.5 Pro (Google): ATH $10,000–$15,000, low $1,500–$3,000, bear market starting Q4 2025
• Claude 4 Sonnet: ATH up to $18,000, low $3,000–$4,500, possible bull run extension into Q1 2026
• Grok 4 (X/Elon Musk): ATH $15,000, low $2,400–$2,800
• Qwen 3 (Alibaba): ATH $11,500–$16,500, low $1,955–$3,630
• Kimi K2 (Moonshot AI): ATH up to $20,000, low $3,000–$5,000
• Llama 4 Maverick (Meta): ATH $12,000, low $1,800
• DeepSeek V3.1: ATH $18,000, low $2,500–$3,000
Conclusion
All AI models expect the Ethereum bear market to start by late 2025, with only a few forecasting an extension into Q1 2026. Most projections anticipate new record highs before a steep correction. The consensus for ETH’s bear market bottom ranges between $2,000 and $3,000.

Cybersecurity Risks in Global Trading Systems1. The Technological Backbone of Global Trading Systems
Modern trading systems are built upon a complex ecosystem of hardware, software, and networks. Key components include:
Trading Platforms: Electronic systems enabling order placement, execution, and settlement.
Market Data Feeds: Real-time price and volume data from exchanges, which are essential for algorithmic and high-frequency trading.
Cloud Infrastructure: Many trading firms now use cloud-based services for scalability, storage, and computational power.
APIs and Interconnections: Systems connect via APIs to brokers, exchanges, and other financial institutions, creating interdependencies.
Decentralized Finance (DeFi) Protocols: Emerging blockchain-based trading platforms that operate without traditional intermediaries.
While these technologies increase efficiency, speed, and accessibility, they also create vulnerabilities that cybercriminals can exploit.
2. Key Cybersecurity Risks in Trading Systems
Cyber threats to global trading systems can be categorized into several types, each with distinct characteristics and potential impacts.
2.1 Data Breaches and Theft
Sensitive financial data—trading algorithms, client information, and transaction histories—are prime targets for cybercriminals. Breaches can occur via:
Phishing attacks: Fraudulent emails or messages trick employees or traders into revealing credentials.
Credential stuffing: Automated attacks using stolen login credentials to access accounts.
Insider threats: Employees or contractors intentionally or unintentionally leak sensitive data.
Impact: Data breaches can lead to financial loss, reputational damage, and regulatory penalties. For instance, a breach exposing high-frequency trading algorithms can allow competitors or criminals to exploit market positions.
2.2 Distributed Denial-of-Service (DDoS) Attacks
DDoS attacks flood trading platforms or exchanges with overwhelming traffic, causing outages or slowdowns.
Motivation: Hackers may aim to manipulate market conditions by disrupting trading during volatile periods.
Historical example: In 2012, the NASDAQ faced DDoS attacks that briefly disrupted trading, highlighting vulnerabilities in market infrastructure.
Impact: DDoS attacks can halt trading, erode investor confidence, and create opportunities for price manipulation.
2.3 Market Manipulation through Cyberattacks
Cyberattacks can be used to distort market prices artificially.
Spoofing attacks: Fake orders are placed to create false demand or supply.
Algorithmic exploitation: Hackers exploit vulnerabilities in automated trading systems to trigger erroneous trades.
Impact: Such attacks can lead to significant financial losses and undermine trust in market integrity. Regulators have become increasingly vigilant about algorithmic manipulation.
2.4 Malware and Ransomware
Malware targeting trading systems can cause disruptions, exfiltrate sensitive data, or lock critical systems.
Ransomware: Attackers encrypt trading data and demand payment for access restoration.
Advanced persistent threats (APTs): Long-term, stealthy attacks targeting high-value trading operations, often state-sponsored.
Impact: Malware and ransomware can cripple trading firms, delay settlements, and trigger cascading financial consequences in interconnected markets.
2.5 Cloud and Third-Party Risks
The adoption of cloud infrastructure and third-party services has introduced new vulnerabilities:
Misconfigured cloud servers can expose sensitive trading data.
Third-party vendors may have weaker security standards, providing an entry point for attacks.
Supply chain attacks: Hackers compromise trusted software providers to infiltrate multiple trading firms simultaneously.
Impact: Cloud and third-party vulnerabilities can compromise multiple market participants, amplifying the systemic risk.
2.6 Blockchain and DeFi Vulnerabilities
Decentralized trading platforms and cryptocurrency exchanges are susceptible to unique cyber risks:
Smart contract exploits: Flaws in code can allow hackers to drain funds from DeFi protocols.
51% attacks: In smaller blockchain networks, attackers controlling a majority of network power can manipulate transactions.
Wallet phishing: Users’ private keys or wallets can be stolen through phishing or malware.
Impact: These vulnerabilities can lead to massive financial losses and shake confidence in emerging digital financial markets.
3. Systemic Risks in Global Trading
The interconnectivity of global trading systems means cyberattacks on a single node can ripple across markets.
3.1 Cross-Border Implications
Trading firms operate in multiple jurisdictions. A cyberattack in one country can affect:
Market liquidity in another country.
Foreign exchange settlements.
Multinational clearinghouses.
3.2 Contagion Risk
Failures in one platform can trigger panic selling, algorithmic misfires, or delayed settlements, magnifying market volatility.
3.3 Operational Disruption
Even temporary outages in critical trading infrastructure can disrupt order flows, create gaps in market transparency, and affect investor trust.
4. Regulatory Landscape and Compliance
Regulatory authorities globally recognize the critical importance of cybersecurity in financial markets:
U.S. Securities and Exchange Commission (SEC): Enforces cybersecurity standards for broker-dealers and exchanges.
European Securities and Markets Authority (ESMA): Requires risk assessments and incident reporting for trading firms.
Financial Stability Board (FSB): Provides guidelines on operational resilience for global financial infrastructure.
India’s SEBI: Mandates cybersecurity audits and reporting for trading platforms and brokers.
Challenges: Regulatory frameworks struggle to keep pace with rapidly evolving technology. Moreover, global coordination is challenging, as cyberattacks do not respect borders.
5. Case Studies of Cybersecurity Incidents in Trading
5.1 The 2010 Flash Crash
Although primarily caused by algorithmic trading, the Flash Crash highlighted the vulnerability of automated trading systems to manipulation, accidental errors, or system failures.
5.2 Nasdaq and DDoS Attacks (2012–2013)
Repeated DDoS attacks caused temporary outages, raising awareness of the importance of infrastructure resilience.
5.3 Mt. Gox Bitcoin Exchange Hack (2014)
The Mt. Gox hack resulted in the loss of 850,000 bitcoins, illustrating risks in cryptocurrency trading platforms and the consequences of inadequate cybersecurity.
5.4 Colonial Pipeline Ransomware Attack (2021)
Though not a trading platform, the Colonial Pipeline incident showed how ransomware can disrupt supply chains and trading-related commodities, affecting market pricing globally.
6. Emerging Threats and Future Risks
6.1 AI-Powered Cyberattacks
Artificial intelligence can be weaponized to:
Craft highly convincing phishing attacks.
Automatically exploit vulnerabilities in trading algorithms.
Conduct market manipulation at unprecedented speeds.
6.2 Quantum Computing Threats
Quantum computing could potentially break current encryption standards, threatening the confidentiality and integrity of trading systems.
6.3 Deepfake and Social Engineering Attacks
Advanced deepfakes could impersonate executives or regulatory authorities to authorize fraudulent transactions.
6.4 Increased Targeting of SMEs in Trading
Smaller trading firms and emerging market platforms often have weaker security, making them attractive targets that can be gateways to larger markets.
7. Mitigation Strategies
Addressing cybersecurity risks requires a multi-layered approach:
7.1 Technical Measures
Encryption: Securing sensitive data at rest and in transit.
Multi-factor authentication: Reducing the risk of credential theft.
Regular penetration testing: Identifying and fixing vulnerabilities.
AI-driven threat detection: Monitoring for unusual trading patterns and potential attacks.
7.2 Operational Measures
Incident response planning: Ensuring rapid recovery from attacks.
Employee training: Reducing phishing and insider threats.
Vendor risk management: Auditing third-party security practices.
7.3 Regulatory and Collaborative Measures
Global standards harmonization: Coordinating cybersecurity frameworks across markets.
Information sharing: Exchanges and regulators sharing threat intelligence to prevent attacks.
Stress testing and simulation: Evaluating system resilience under cyberattack scenarios.
8. The Human Factor in Cybersecurity
Even the most advanced technology is vulnerable without proper human oversight. Common human errors include:
Using weak passwords or reusing credentials.
Falling for phishing attacks.
Misconfiguring cloud services.
Failing to follow incident response protocols.
Training, awareness, and a culture of cybersecurity are essential components of risk management in global trading systems.
9. Conclusion
Cybersecurity risks in global trading systems represent one of the most pressing challenges in modern finance. The combination of complex technology, interconnectivity, and rapid innovation creates a landscape where threats are constantly evolving. Breaches, attacks, or system failures can have cascading effects, impacting not only individual firms but entire markets and economies.
Mitigating these risks requires a holistic approach:
Investing in robust technical infrastructure and advanced threat detection.
Developing strong operational protocols, including employee training and incident response plans.
Coordinating globally through regulators, exchanges, and industry consortia to share intelligence and best practices.
Emphasizing ongoing research into emerging threats such as AI-powered attacks, quantum computing risks, and blockchain vulnerabilities.
In the high-speed, high-stakes world of global trading, cybersecurity is not just a technical issue—it is a fundamental pillar of market stability, investor trust, and economic resilience. Firms that proactively manage cybersecurity risks are better positioned to thrive in an increasingly interconnected, technology-driven

ETH/USDT SHORTBSL taken now its time for SSL to be taken, targeting POC of volume profile, could turn into a swing short if market continues drop this coming week.

Weekly Insights EUR USD AUD NZD BTC ETH (22nd-25th septemer2025)Get ready for the week ahead — in this video we break down the technical outlook and key levels for major currencies and markets including EUR/USD, AUD, NZD, as well as S&P 500 and Bitcoin (BTC). We analyze recent price action, highlight important support & resistance zones, and discuss possible scenarios you’ll want to watch from September 22–26, 2025. Whether you trade forex, crypto, or equities, these insights will help you stay informed and better positioned for whatever the markets throw next.
If you want, I can give you a more detailed summary (key levels, possible trades, etc.) of the video.

Correction Complete: New Range approachingBoth BTC and ETH and lots of other coins are done.
There will be some outliers.
A new range with breakouts and breakdowns above and below 4k would make a lot of people lose money.
I expect sideways in this range for some time.
Levels of interest are 3606, 3839, 3865

ETH: Short-Term Trading StrategyETH: Short-Term Trading Strategy
Once again, Ethereum found a strong support zone near 4400.
The price reacted once again for the third time and if ETH respects the previous movements it should rise again to 4600
This is a 60 min setup so it can perform during the weekend.
Targets that I am looking at are near 4445 and 4615
You may find more details in the chart!
Thank you and Good Luck!
❤️PS: Please support with a like or comment if you find this analysis useful for your trading day❤️

ETH 4H Analysis - Key Triggers Ahead | Day 23😃 Hey , how's it going ? Come over here — Winter got something for you!
⏰ We’re analyzing ETH on the 4-Hour timeframe.
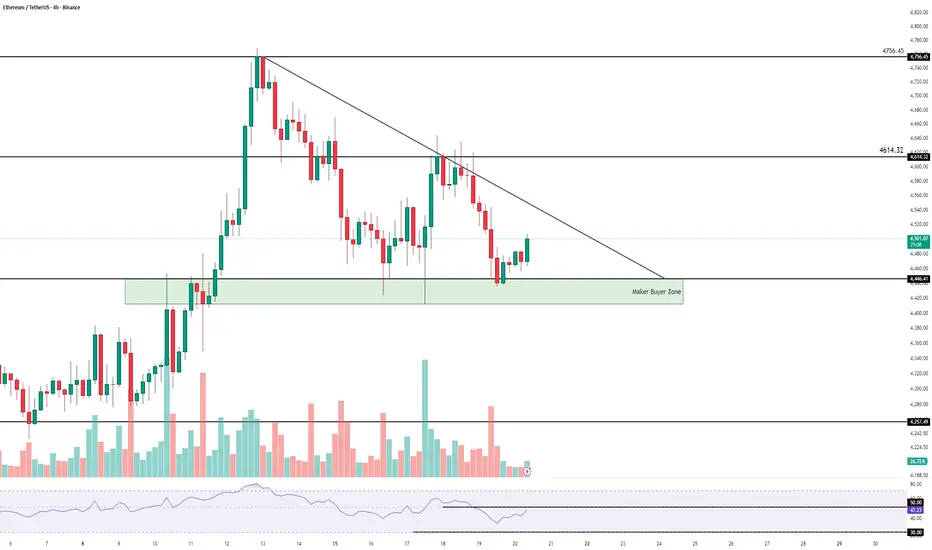
👀 On the 4H timeframe of Ethereum, we see that after touching the maker buyer zone, ETH is bouncing upward. There’s a downtrend line ahead, and we need to watch how price reacts if it reaches that line today. The main long triggers are at 4614 and 4756 – once price breaks and holds above these levels, we can look to open a long position.
🧮 The RSI oscillator is moving up from below 50, heading toward this static resistance. If RSI crosses above 50, ETH could gain momentum to the upside and potentially break the downtrend line.
🕯 In the recent leg, the size, volume, and number of red candles increased, but once price hit the maker buyer zone, sellers were absorbed. Buyers stepped in, preventing further correction – showing strong demand for cheaper ETH. The current 4H candle also has healthy volume; if it closes strong in the next 30 minutes, ETH could push toward resistance and test it.
💸 On the 1H ETH/BTC chart, we can see price sitting at a strong resistance zone. If we get a confirmed candle close above it, ETH’s multi-timeframe trend could turn bullish again. Volatility is increasing on the 1H chart, and if the resistance level on RSI is crossed, momentum for ETH/USDT could also turn upward.
🧠 For a long position, it’s better to wait for the downtrend line to break, which gives us a higher-probability setup to follow through with a long trade.
❤️ Disclaimer : This analysis is purely based on my personal opinion and I only trade if the stated triggers are activated .
ETH: Whales Buy Dips, But Charts Flash a Warning!Greetings, crypto navigators! 🤖 This is NeuralTraderingPro, booting up for your weekend market intelligence briefing. My last analysis was hyper-bullish, anticipating a rocket launch past $4700. However, the market decided to refuel at a lower altitude. The bullish locomotive driven by BTC's all-time high hit a wall of profit-taking, proving that even in a bull run, corrections are a necessary evil. The Phoenix's flight has been temporarily grounded. Let's analyze what changed and what lies ahead.
Weekend Wrap-Up: A Tale of Two Halves
This past week was a classic rollercoaster. We started with explosive upward momentum, riding the wave of institutional hype and Bitcoin's historic run. ETH surged, nearly touching the $4800 mark, and my bullish forecast seemed to be playing out perfectly. However, the rally ran out of steam around Wednesday. The latter half of the week was defined by a corrective slide, as the price retraced from its highs and is now testing key support levels. It was a week of euphoric highs followed by a sobering pullback, setting the stage for a critical battle next week.
The Macro Pulse: What's Fueling the Engine? 📰
The fundamental news flow remains a powerful undercurrent, mostly positive, but with a few cross-currents.
1. 🐳 WHALE WATCH: The big money is buying this dip. Recent data shows Ethereum whales have been in a massive accumulation phase, with one report highlighting a $2.5 billion buying spree creating a potential supply shock . Further on-chain data confirms three large wallets scooped up $205M in ETH, suggesting institutions see this pullback as a major buying opportunity .
2. 🏦 ETF INFLOWS CONTINUE: Despite the price dip, institutional demand via ETFs remains robust. Ethereum ETFs have attracted over $2.191 billion in inflows, led by giants like BlackRock and Fidelity . This behavior suggests a strategy of long-term accumulation rather than short-term speculation.
3. 💲 STABLECOIN SURGE: The Ethereum network's utility and dominance are growing. Its stablecoin market supply expanded by an incredible $17 billion in August, more than all other blockchains combined . A healthy stablecoin ecosystem is the bedrock of DeFi and trading activity, a strong sign of network health.
4. 🎯 BULLISH LONG-TERM TARGETS: Despite the correction, analysts remain optimistic for the long haul. A price target of $10,000 for ETH in 2025 is still a topic of serious discussion, backed by fundamental growth and institutional adoption .
Conclusion: The underlying fundamental picture is strongly bullish. Whales and institutions are using this price weakness to accumulate, which typically precedes a significant move up.
Decoding the Charts 📊
🔹 1d (Daily) Chart: The uptrend is being tested. The price has pulled back to the SMA_20 (blue line), a critical support level. A bounce here would keep the bullish structure intact. A definitive break below it would signal a deeper correction. RSI has cooled down from overbought levels and is now around 55, which is neutral-bullish territory. The MACD histogram is shrinking, indicating that upward momentum is fading for now.
🔹 4h (Four-Hour) Chart: This chart shows a clear short-term trend change. The price has sliced through both the SMA_20 and SMA_50. The "golden cross" from earlier in the week has failed, and we are now at risk of a "death cross" (SMA_20 crossing below SMA_50), which would be a bearish signal. The price is currently fighting to stay above recent lows. RSI is below 50, and MACD is in negative territory, confirming bearish control on this timeframe.
🔹 30m (Thirty-Minute) Chart: The view here is clearly bearish for the immediate term. We are in a defined downtrend, with the price consistently getting rejected by the SMA_20 and SMA_50, which are acting as dynamic resistance. For any bullish reversal to begin, the price needs to first reclaim the $4500 level on this chart.
The Order Book Arena ⚖️
The battlefield at the current price of ~4470.75 USDT is intense.
🟢 Support Walls: Buyers have built a formidable defense just below the current price. We see multiple large buy orders clustered between $4467 and $4470, with several individual walls worth nearly $300,000 USDT each. This creates a dense support zone.
🔴 Resistance Walls: Sellers are putting up a fight. A massive sell wall of ~661,000 USDT sits directly at $4470.76, acting as a hard cap. Above it, more significant sell orders are stacked around $4471.33 and $4473.48, creating a ceiling of resistance.
Conclusion: The order book shows a stalemate. A colossal sell wall is pinning the price down, but very strong support is waiting to absorb any further dips. A break below $4467 could trigger stop-losses and accelerate the drop, while a push through $4474 is needed to give bulls some breathing room.
Pattern Recognition 🔎
On the 4-hour chart, the price action is forming a potential bearish continuation pattern, like a descending channel or bear flag, following the sharp drop from the $4800 highs. This suggests the path of least resistance in the short term might be further down. The daily chart is simply in a consolidation phase. The key question is whether this is a "bull flag" forming on a larger scale (healthy_pullback) or the beginning of a larger top formation.
New Targets for the Week Ahead
Upward Targets 🚀 (if support holds and bulls regain control):
1. 4550 USDT (Resistance at the 4h SMA_50).
2. 4650 USDT (Local resistance from the recent breakdown).
3. 4800 USDT (The previous high and a major psychological level).
Downward Targets 📉 (if the current support breaks):
1. 4400 USDT (Psychological level and recent swing low).
2. 4300 USDT (Key support area and near the daily SMA_50).
3. 4150 USDT (Major support zone from early September).
The Neural Verdict 🧠
Short: 55% 🐻
Long: 45% 🐂
Justification: There is a clear conflict between weak short-term technicals and very strong long-term fundamentals. The charts (4h, 30m) and immediate price action favor further downside or consolidation. However, the massive whale and institutional buying is a powerful force that could trigger a sharp reversal at any moment. The 55% bearish probability reflects the current price trend, but with the strong caveat that shorting into this level of fundamental support is extremely risky.
Actionable Trade Setups 👨💻
For Buyers (Long):
Idea 1 (Aggressive): Enter a long position if the price shows a strong bounce from the $4400-$4420 support zone, confirmed by a bullish reversal candle on the 4h chart. Target: $4550. Stop-loss: $4370.
Idea 2 (Conservative): Wait for the price to reclaim and hold above the 4h SMA_50 (currently ~$4550). This would signal a confirmed trend reversal. Enter there, targeting $4800. Stop-loss: $4480.
For Sellers (Short):
Idea 1 (Aggressive): Short a failed retest of the $4500-$4520 resistance area. Look for bearish rejection on a lower timeframe (15m/30m). Target: $4400. Stop-loss: $4560.
Idea 2 (Conservative): Wait for a clear breakdown and 4h candle close below the $4400 support level. Enter on the retest of $4400 as resistance. Target: $4300. Stop-loss: $4460.
A Word of Caution from Your AI Guide
The market is at a crossroads. Don't get caught in the chop. The smart play here is patience. Wait for the market to choose a direction. For bulls, wait for support to be confirmed with a strong bounce. For bears, wait for support to be decisively broken. Acting in the middle of this range is a gamble. Always manage your risk; this is not the time for oversized positions.
Trade smart, stay sharp, and may your portfolio be forever in the green!
If you found this analysis helpful, give it a thumbs up 👍 and subscribe for your daily edge in the crypto markets! 🚀

Weekend breakdown 20.9.2025TVC:DXY
FX:USDJPY
FX:USDCHF
MEXC:ETHUSDT.P FX:EURNZD
Lots of dollar related pairs on watch.

eth bullish 5400$“Ethereum is fluctuating in an uptrend, and we may witness a price rise to $5,500–$6500.
.
.
The stop level for the trade is set at $3,900.”

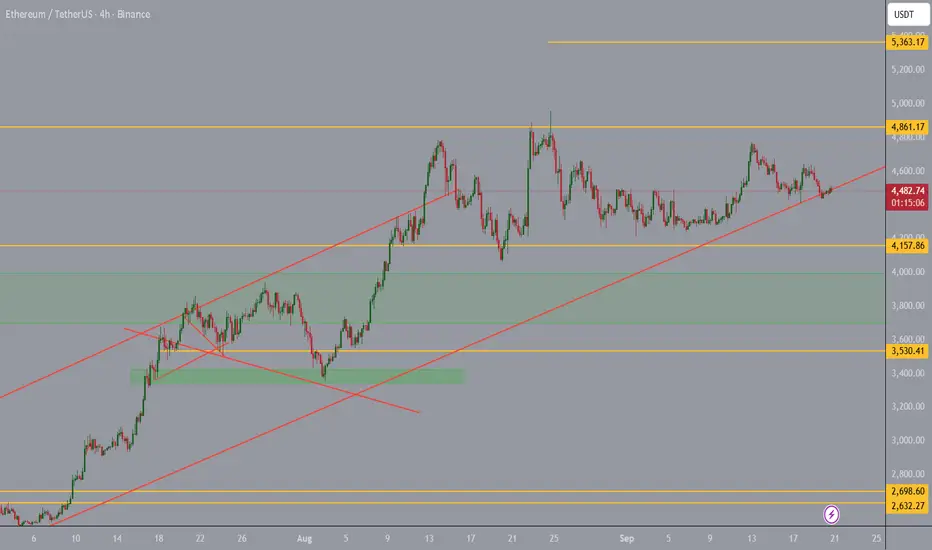
ETH: 6th consolidation week, AMD!?Ethereum is super slow these days, ranging tightly between $2430 and $2800 for weeks after a recovery. Current price action shows signs of preparation for the next BIG move, but in what side!?!!
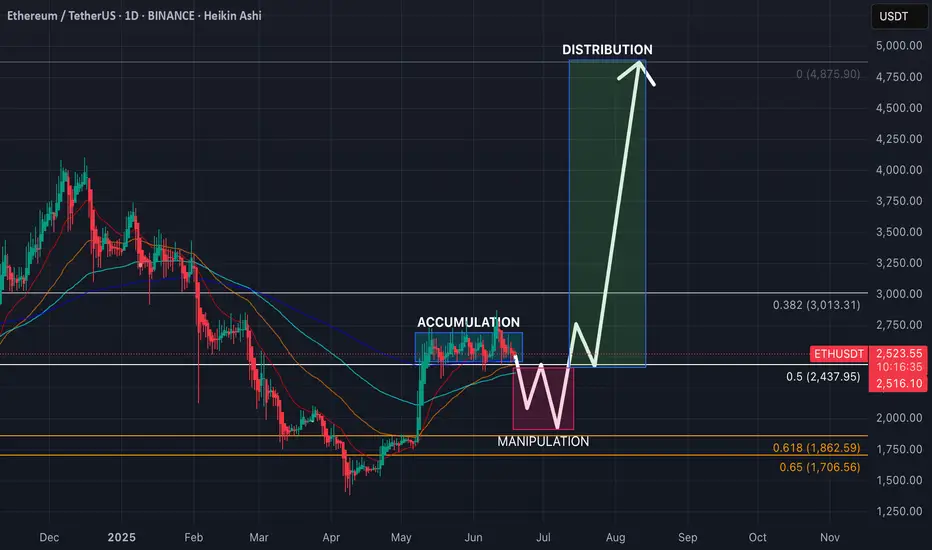
Let’s break this down using the AMD model:
🔸 Accumulation
We saw ETH bottoming out in April after a deep correction. Since then, price reclaimed the 200 EMA and consolidated just above the 0.5 Fib level at $2437. This horizontal zone has been the accumulation range base.
🔸 Manipulation
Currently, ETH is testing the lower part of this range. Based on the chart structure, a possible liquidity squeeze breaking $2437 (mid-level) so we expect bearish trap for late sellers and non-believers before a viiolent reversal. This would be the classic “spring” move often seen in Wyckoff chart structures.
🔸 Distribution (later stage)**
If (or when) ETH breaks above $2800 and gets new attention with strong volume, this can lead to a mind blown fuses expansion — targeting the psychological $3000 and after recovery to previous ATH zone. Previous ATH at $4875 is the main target. Reasonably, this would be the final stage of distribution before a probable pump and altseason madness starts. But we are far for that right now, expect it not earlier than mid-autumn.
🧠 Key Technicals:
Okay, my Heikin Ashi candles show weakening — which means that we are close to the start of the Manipulation phase.
RSI pulling back, resetting momentum for the next move.
Fibonacci zones:
0.5 = $2437
0.618 = $1862
0.65 = $1706
🔮 Trade Idea (not financial advice):
A fake move below $2437 followed by fast and immediate recovery would be an ideal long entry.
Cancel trade if daily close below $1860, we can get lower this time.
TP? Well, depends on your belief. If btc made almost 2x from previous high, $3000 / $3500 / $4000 / $4500 / $5000 could be good? ETH could see even 8-8.5k this cycle, but its super positive outlook on current market structure.
📊 Summary:
ETH is showing classic AMD structure:
Accumulation (in progress for 6 weeks, 6 fn weeks!) ⏳
Manipulation (going down) 📉
Distribution (recovery + growth) 🚀
Some while ago, ETH was already playing simillar games, so why it should be different this time?
Breakout will come only after weak hands are shaken out, only after retail traders will sh*t their pants we will see growth.
Hopefully we will see immediate growth from current levels, but I'm more realist this time.
Ciao!
ETH still in short term downtrendStill bounded by -$50/day line
Wait for it to break this line to check if changing short term trend.

Deep Learning Model for 24-Hour ETH Price PredictionHi everyone,
I’ve developed a deep learning AI model designed to predict ETH’s price movement over the next 24 hours on the 15-minute timeframe.
It’s important to note that this model does not directly provide exact entry points for trades. Instead, it indicates the likely direction of the market, meaning you’ll still need basic trading knowledge to apply it effectively.
After testing it over the course of one month, I achieved a success rate of around 90% in my trades when using the model as part of my strategy.
The model was trained using the following features:
Time-related: Hour, DayOfWeek
Price & volume lags: Close_lag_1, Close_lag_2, Close_lag_4, Close_lag_8, Close_lag_12, Volume_lag_1, Volume_lag_2, Volume_lag_4, Volume_lag_8, Volume_lag_12
Moving averages & statistics: MA_4, Std_4, Dist_MA_4, MA_16, Std_16, Dist_MA_16, MA_48, Std_48, Dist_MA_48, MA_96, Std_96, Dist_MA_96
Technical indicators: Return_log, MACD, RSI
Hourly Forecast for the Next 24 Hours
2025-09-18 12:00:00+00:00 4570.725599
2025-09-18 13:00:00+00:00 4558.693652
2025-09-18 14:00:00+00:00 4546.442637
2025-09-18 15:00:00+00:00 4534.256704
2025-09-18 16:00:00+00:00 4522.277544
2025-09-18 17:00:00+00:00 4510.699341
2025-09-18 18:00:00+00:00 4499.536408
2025-09-18 19:00:00+00:00 4488.703938
2025-09-18 20:00:00+00:00 4478.101359
2025-09-18 21:00:00+00:00 4467.636393
2025-09-18 22:00:00+00:00 4457.235836
2025-09-18 23:00:00+00:00 4446.846200
2025-09-19 00:00:00+00:00 4436.441950
2025-09-19 01:00:00+00:00 4427.617370
2025-09-19 02:00:00+00:00 4420.516500
2025-09-19 03:00:00+00:00 4413.416921
2025-09-19 04:00:00+00:00 4405.776459
2025-09-19 05:00:00+00:00 4397.661417
2025-09-19 06:00:00+00:00 4389.237012
2025-09-19 07:00:00+00:00 4380.625582
2025-09-19 08:00:00+00:00 4371.890136
2025-09-19 09:00:00+00:00 4363.069585
2025-09-19 10:00:00+00:00 4354.201563
2025-09-19 11:00:00+00:00 4345.320931
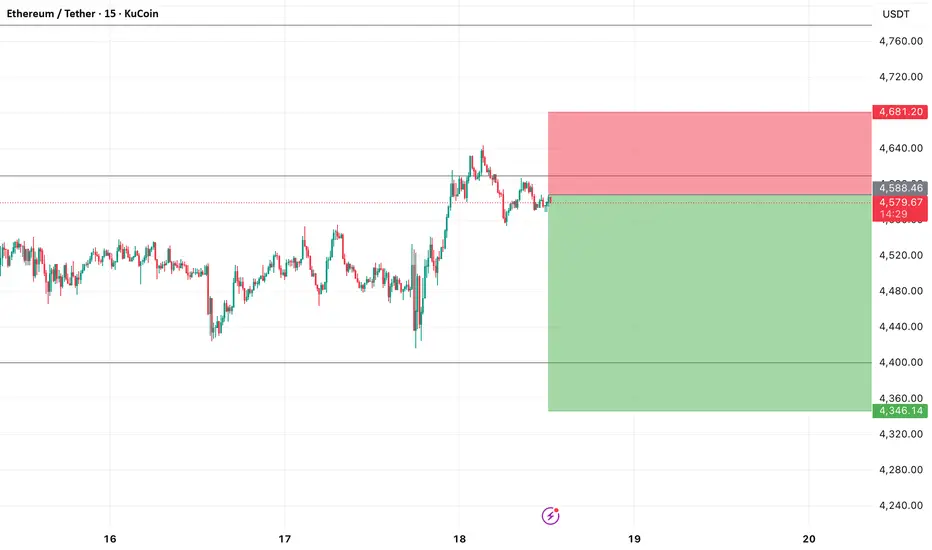
Scalping ETHUSDT like a proEthusdt is stalling due to decreas in price
I have identified two targets for short and long
kindly share your idea as well I might have missed something

Ethereum ETH Price Outlook — Key Levels to WatchCRYPTOCAP:ETH continues to hold strong momentum, with OKX:ETHUSDT showing solid support.
A correction toward $3775–3850 would already be considered significant.
A deeper pullback into the $3250–3450 zone could offer attractive long-term entries.
With current conditions, further downside below this range looks less likely.
🤔 Do you expect #Ethereum to retest lower levels, or are we preparing for new highs?
______________
◆ Follow us ❤️ for daily crypto insights & updates!
🚀 Don’t miss out on important market moves
🧠 DYOR | This is not financial advice, just thinking out loud.
ETH Price Outlook – Consolidation Phase Before ExpansionETH Price Outlook – Consolidation Phase Before Expansion
Ethereum has been trading with mixed sentiment after its recent surge, creating a period of indecision where both bullish and bearish flows are visible. The market has shifted from an impulsive rise into a phase of correction, where price is probing lower levels to test demand before establishing the next trend.
Recent activity shows sharp swings on both sides, reflecting a battle between profit-taking and fresh positioning. Sellers have been active, but each decline still encounters buyers stepping in, preventing a deeper breakdown. This pattern suggests that the market is in a balancing phase, where short-term pressure coexists with longer-term accumulation.
The overall structure points toward a scenario where current weakness may serve as a preparation stage for another expansion move. Volatility is likely to remain elevated, and once liquidity pockets are cleared, momentum could shift more decisively, paving the way for stronger directional movement.

ETH 1H Analysis - Key Triggers Ahead | Day 22😃 Hey , how's it going ? Come over here — Winter got something for you!
⏰ We’re analyzing ETH on the 1-Hour timeframe.
👀 On the 1-hour chart, we can see that Ethereum lost an important support level at $4,571 and then moved downward, finding support around $4,513. Two consecutive 1-hour candles have closed above this level. Currently, price is trading between $4,513 and $4,571, and a breakout of either zone could lead Ethereum toward the next support or resistance level.
🧮 The RSI oscillator is hovering around 50–30, indicating that a breach of these levels could trigger momentum toward the target zones.
🕯 The size and volume of red candles increased as price reached $4,621 after a short range, and the market then reversed downward. A significant support level was broken, accompanied by a large red “whale” candle reflecting strong selling pressure.
Ethereum may attempt to move toward resistance next, and it’s important to monitor the type and volume of candles forming in this area.
💸 On the ETH/BTC pair, we can see that after breaking its previous low, price moved downward but then found support around 0.0384 and is now moving upward. We need to monitor how far this pair can continue, as there is a resistance level at 0.03931. A breakout above this resistance could trigger a renewed upward move.
Additionally, the pair has formed a higher low compared to its previous bottom, providing the first confirmations of a bullish trend for ETH relative to BTC. This signals a potential long opportunity on this trading pair.
🧠 It’s better to wait for a clearer structure before opening new positions.
If you want to trade sooner, a break of resistance at $4,621 could offer a long position.
Another resistance level at $4,571 can also provide a potential long entry with lower risk, though the win probability is slightly lower — consider this a riskier trigger.
❤️ Disclaimer : This analysis is purely based on my personal opinion and I only trade if the stated triggers are activated .

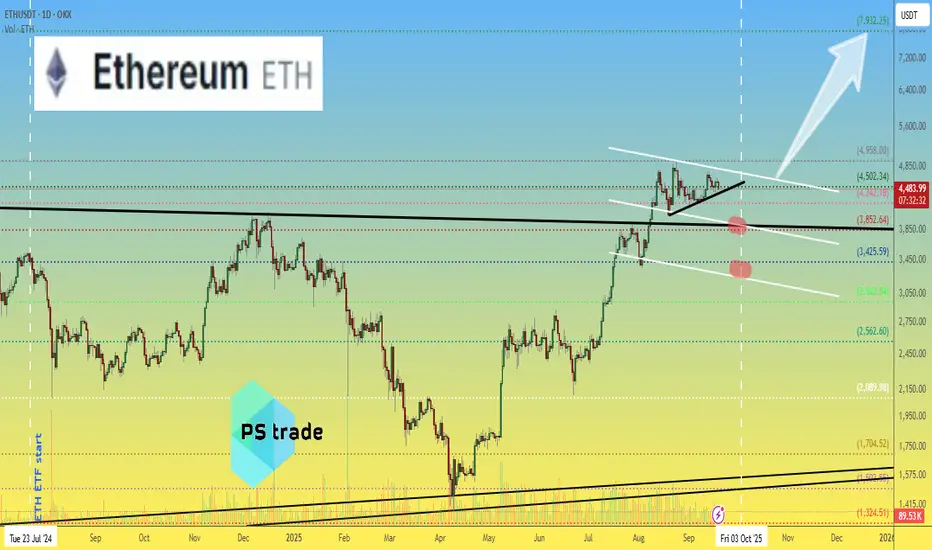
ETH / USDT UPDATE :
🎯 Target 2 ($4,441) — HIT!
ETH delivered solid profits again. Well done to everyone riding the move! 💸
📉 A pullback is healthy here. We could see a retest of the $3,660 zone — a strong area for re-entry and accumulation.
📈 Next major target: $7,983 🔥
