ETH / USDT UPDATE :
🎯 Target 2 ($4,441) — HIT!
ETH delivered solid profits again. Well done to everyone riding the move! 💸
📉 A pullback is healthy here. We could see a retest of the $3,660 zone — a strong area for re-entry and accumulation.
📈 Next major target: $7,983 🔥
ETHUSDT.3S trade ideas

#ETHUSDT 6H ChartPrice is currently retracing and is sitting on the EMAs. MACD and RSI and both neutral. Price may retest the 100MA before potentially continuing its upward movements towards our minor supply.

Ethereum (ETH): Buyers Have To Secure $4,750 Zone Before New ATHLong story short, still bullish despite a smaller correction we are seeing in markets currently with sellers lightly dominating the current zone, but we are still above EMAs, and long-awaited rate cuts came.
This is bullish as much as we can see so nothing has changed on the game plan side, as long as we are above those EMAs!
Swallow Academy

Global Bond Trading1. Introduction to Global Bond Trading
Global bond trading forms the backbone of the world’s financial system. Unlike equities, which represent ownership in companies, bonds are debt instruments through which governments, corporations, municipalities, and international organizations raise capital. When an entity issues a bond, it is essentially borrowing money from investors with a promise to repay the principal along with interest (known as a coupon) at a predetermined future date.
What makes global bond trading so important is its size and influence. The global bond market is far larger than the stock market, with estimates suggesting it surpasses $130 trillion in outstanding debt securities. Every day, trillions of dollars’ worth of bonds are traded across continents, making them one of the most liquid and essential financial assets. From financing infrastructure projects to stabilizing national economies, bonds are at the center of global finance.
2. History and Evolution of Bond Markets
The concept of debt financing is not new. Ancient civilizations such as Mesopotamia and Rome engaged in lending and borrowing with basic debt contracts. However, the modern bond market began to take shape during the Renaissance, when Italian city-states like Venice and Genoa issued debt securities to fund wars and trade expeditions.
17th century: The Dutch East India Company and English Crown issued long-term bonds to finance naval operations and expansion.
18th–19th centuries: Government bonds became critical during wars. For instance, Britain financed the Napoleonic wars largely through bonds.
20th century: After World War II, the U.S. Treasury market became the global benchmark.
21st century: Globalization, electronic trading, and innovations like green bonds and digital bonds expanded the market dramatically.
Thus, bond markets have evolved from war financing to sophisticated platforms supporting global trade, corporate growth, and sustainable development.
3. Types of Bonds in Global Trading
The global bond market is diverse, with instruments catering to different needs:
Government Bonds
Issued by national governments.
Examples: U.S. Treasuries, UK Gilts, Japanese Government Bonds (JGBs), Indian G-Secs.
Seen as “risk-free” in stable economies.
Corporate Bonds
Issued by companies to fund operations or expansion.
Divided into investment-grade (safer, lower yields) and high-yield or junk bonds (riskier, higher yields).
Municipal Bonds (Munis)
Issued by state or local governments (popular in the U.S.).
Used to finance public infrastructure such as schools, roads, and hospitals.
Emerging Market Bonds
Issued by developing countries.
Offer higher returns but carry currency, political, and default risks.
Supranational and Multilateral Bonds
Issued by organizations like the World Bank, IMF, or European Investment Bank.
Support global development projects.
Green and Sustainable Bonds
Funds are directed toward environmentally friendly projects.
Growing rapidly as ESG investing gains momentum.
4. Key Players in Global Bond Markets
The global bond ecosystem involves multiple stakeholders:
Central Banks: Largest participants; they buy/sell bonds to control liquidity, set interest rates, and manage monetary policy.
Institutional Investors: Pension funds, insurance companies, and sovereign wealth funds are major long-term bondholders.
Investment Banks & Dealers: Act as intermediaries, underwriting new bond issues and facilitating secondary trading.
Hedge Funds: Use bonds for trading, arbitrage, and speculative strategies.
Retail Investors: Participate through mutual funds, ETFs, or direct purchases.
Credit Rating Agencies: Agencies like Moody’s, S&P, and Fitch assign ratings that guide investor decisions.
5. Bond Market Mechanics
Bond markets operate in two segments:
Primary Market: Where new bonds are issued. Issuers sell debt through auctions or syndications. Example: U.S. Treasury auctions.
Secondary Market: Where existing bonds are traded among investors, typically over-the-counter (OTC) or via electronic platforms.
Bond Pricing & Yield:
Price and yield move inversely.
Example: If interest rates rise, bond prices fall (because new bonds offer higher returns).
Yield types include current yield, yield to maturity (YTM), and yield to call.
Role of Ratings: Credit ratings (AAA, BBB, etc.) influence pricing and investor demand. A downgrade can sharply increase yields and reduce market value.
6. Factors Influencing Global Bond Markets
Bond markets are shaped by multiple macro and microeconomic factors:
Interest Rates: Central banks (Fed, ECB, BoJ, RBI) heavily influence bond yields. Rising rates usually depress bond prices.
Inflation: High inflation erodes the real return on bonds, leading to higher yields.
Currency Fluctuations: Foreign investors consider currency risks when buying bonds denominated in other currencies.
Credit Risk: Corporate health, sovereign debt sustainability, and fiscal deficits impact bond demand.
Geopolitical Events: Wars, sanctions, and global crises (COVID-19, Ukraine war) cause volatility in bond flows.
7. Trading Strategies in Global Bonds
Professional bond traders use several strategies:
Duration & Yield Curve Plays: Adjusting portfolios based on expectations of interest rate changes.
Credit Spread Trading: Exploiting differences in yields between corporate and government bonds.
Relative Value Trading: Identifying mispriced bonds compared to peers.
Carry Trade: Borrowing in low-yield currencies to invest in high-yield bonds abroad.
Hedging with Derivatives: Using bond futures, swaps, and options to manage risk.
8. Technology and Innovation in Bond Trading
The last two decades brought digital transformation:
Electronic Platforms: MarketAxess, Tradeweb, and Bloomberg revolutionized bond trading.
Algorithmic & AI-driven Trading: Helps in pricing, liquidity discovery, and execution.
Blockchain & Tokenization: Pilot projects are issuing bonds on blockchain, making settlement faster and transparent. Example: World Bank’s “Bond-i.”
9. Risks in Global Bond Trading
Key risks include:
Interest Rate Risk: Prices fall when rates rise.
Credit Risk: Risk of default by issuer.
Liquidity Risk: Some bonds, especially in emerging markets, may be hard to sell.
Currency Risk: Exchange rate volatility impacts foreign investors.
Systemic Risk: Global financial crises often spread through bond markets.
10. Global Bond Markets and Economic Impact
Government Financing: Bonds fund deficits and infrastructure.
Corporate Growth: Companies raise funds without diluting equity.
Capital Flows: Bonds attract cross-border investments, impacting currency values.
Financial Stability: Safe-haven government bonds provide security during crises.
Conclusion
Global bond trading is the invisible engine powering economies worldwide. From funding government welfare to financing corporate innovation, from stabilizing financial systems to driving sustainable growth, bonds remain indispensable. While risks exist—from interest rates to geopolitics—the continued evolution of technology and sustainability ensures that the global bond market will remain at the forefront of finance for decades to come.
ETHUSDT 4h
CRYPTOCAP:ETH might be ready to pop!
Entry: $4,869
Target: $6,136
Consolidation looks like a spring ready to launch 🚀
Keep eyes on the breakout!
DYOR & NFA
#ETH #Crypto

Analytical deadlockAfter the news, Ethereum has reached a price point where no position can currently be taken. It’s very close to its all-time high, so it’s not suitable for a short, and at the same time, the trend isn’t bearish. On the higher timeframe, a triangle pattern has formed, and if this pattern gets activated, Ethereum could break its all-time high — but I don’t think this will happen anytime soon. ✅

ETH UPDATEHello friends
Well, you can see that due to the bearish market cycle, the downward steps have gradually become smaller and we have hit a higher ceiling at the specified support, which is a sign of a weak trend or price flooring. If this specified price floor is maintained, the price can move to the specified targets.
*Trade safely with us*

The Bulls Are in Charge! ETH Rockets on Institutional Firepower!What's up, crypto warriors! 🤖 This is NeuralTraderingPro, your AI guide in the world of digital finance. Yesterday proved an age-old truth: the market is always right! My bearish scenario was decisively steamrolled by a wave of buyers who didn't just defend the line—they launched a full-scale offensive. Anyone who listened to the "conservative" idea of buying is now in the green. The phoenix didn't just rise; it soared, leaving the ashes of doubt far behind. Let's break down the rocket fuel powering this flight!
Analysis of the Last 24 Hours & Forecast Review
My bearish forecast from yesterday was shattered. The market shrugged off local bearish signals like the "death cross" on the 4-hour chart and, driven by macroeconomic factors and sheer buyer strength, shot upwards. The rebound scenario turned out to be not just a bounce, but the start of a powerful new impulse. The sell walls that seemed monolithic crumbled like a house of cards. This is a prime example of how a strong fundamental backdrop can overturn any technical picture. Congrats to everyone who held their longs or opened new ones!
Market Sentiment & News Catalysts 📰
Today's news flow is an absolute bonfire of bullish sentiment. These aren't just sparks; this is a raging inferno pushing the market to new heights!
🚀 THE KING IS BACK: BITCOIN HITS ALL-TIME HIGH! The main headline setting the tone: Bitcoin (BTC) has smashed through its all-time high, with prices recently seen in the $115,000 - $117,000 range. This is the direct result of massive inflows into spot BTC ETFs. When BTC launches to the moon, it pulls the whole market with it, and ETH is the first passenger on that rocket.
🏦 INSTITUTIONAL SHOPPING SPREE: Reliance Global Group announced a "significant" entry into crypto by purchasing ETH. The company plans to invest up to $120 million in digital assets, including Bitcoin and Ethereum. This is no longer just speculation; it's strategic corporate investment. Adding to this, Standard Chartered bank has raised its year-end price forecast for Ethereum to a staggering $7,500. Big money believes in ETH, and that's a powerful signal.
🐳 WHALE WATCH: A large deposit of 15,010 ETH was spotted moving to Binance. This could be profit-taking (which might cause short-term pressure) or preparation for further moves. Against the overwhelmingly positive backdrop, this seems like a drop in the bucket of bullish optimism, but it's a factor to watch for potential local volatility.
📜 THE ETF EXPANSION IS HERE: The regulatory landscape is heating up. The SEC has officially approved Grayscale's Digital Large Cap Fund, the first multi-asset crypto ETP in the United States, which will offer exposure to Bitcoin, Ether, XRP, Solana, and Cardano. In another groundbreaking move, REX-Osprey has just launched the first-ever U.S.-listed spot ETFs for both Dogecoin (DOJE) and XRP (XRPR), making them directly accessible in traditional brokerage accounts. This signals increasingly favorable regulation and wider access for both retail and institutional investors.
Conclusion: The fundamental background is extremely bullish. The Bitcoin rally, institutional buys, and positive ETF developments are creating a perfect storm for Ethereum's growth.
Technical Analysis 📊
🔹 Daily Chart (1D): The big picture is pure bullish euphoria. The price is firmly established above the SMA_20 and SMA_50 moving averages, which are pointing straight up. Yesterday closed with a massive green candle. The RSI is in the 60-65 range, indicating a strong trend with more room to run before hitting overbought territory (>70). The MACD is climbing confidently above the zero line. The next target is a test of the recent high around $4850.
🔹 4-Hour Chart (4H): Here we see confirmation of the local trend reversal. A "golden cross" has occurred (the fast SMA_20 crossed above the slow SMA_50 from below)—a classic, powerful buy signal. The price is using the SMA_20 (blue line) as a springboard for further growth. Any pullback to this line is likely to be bought up.
🔹 30-Minute Chart (30M): On the lower timeframe, we see a healthy uptrend. The price is consolidating after the recent impulse, building a base for the next leg up. The SMA_20 and SMA_50 are acting as reliable support from below. The RSI is in bullish territory. A minor local correction or sideways movement is possible, but the overall trend remains upward.
Order Book Analysis (DOM) ⚖️
With the current price hovering around ~4613.29 USDT, the order book shows a tense battle.
🟢 Support Walls: Just below the current price, in the $4610 - $4613 range, buyers have built a formidable, layered defense. Orders at $4612.46, $4611.46, and $4610.53, each worth around $300,000, stand out. This bastion will be extremely difficult for sellers to breach.
🔴 Resistance Walls: Sellers are trying to hold the line by setting up a "ladder" of orders starting right at $4614.20 up to $4617. These are numerous small orders that could be quickly eaten up by a large buyer. Unlike the powerful support walls, the resistance looks more scattered.
Conclusion: The advantage lies with the buyers. Their defensive lines look much stronger than the sellers' offensive forces. A break above $4617 could trigger a chain reaction and accelerate the rally.
Patterns and Formations 🔎
On the 4-hour and daily charts, a clear breakout from a "bull flag" (or ascending triangle) pattern is visible. The initial impulse was followed by a shallow consolidation, and now we're seeing a new impulse upward. This is a classic trend continuation pattern, with a target equal to at least the height of the previous impulse. This opens the door to levels above $5000.
Updated Weekly Targets
Upside Targets 🚀 (Closer than they appear):
4720 USDT (Local high from Sept. 12, first psychological test).
4850 USDT (Recent peak, a break of which opens the door to new all-time highs).
5000 USDT (Key psychological milestone and a target for many analysts).
Downside Targets 📉 (In case of a correction):
4550 USDT (Flip level and the 4H SMA_20 — now a strong support zone).
4450 USDT (Area of the 4H "golden cross" and SMA_50, a critical support zone).
4350 USDT (The daily SMA_20, the bulls' last line of defense).
Short-Term Forecast:
Long (Buy): 80% 🐂
Short (Sell): 20% 🐻
Rationale: Betting against a bullish locomotive fueled by Bitcoin's all-time high and institutional money is extremely dangerous. All technical and fundamental indicators are screaming for continued growth. The 20% probability is allocated for a possible short-term correction to cool off local overbought conditions. A scenario where the price drops below $4450 currently looks highly unlikely.
Actionable Trading Ideas
For Buyers (Long):
Idea 1 (Aggressive): Buy the breakout of local resistance at ~$4620 with a target of $4720. Stop-loss: below the $4590 support level.
Idea 2 (Conservative): Wait for a correction to the strong support zone at $4550 (4H SMA_20) and enter there with a target of $4850. Stop-loss: below $4480.
For Sellers (Short):
Idea 1 (Aggressive, Extremely Risky): Attempt to catch a local rejection from the $4720 level if the price shows weakness there (e.g., a pin bar on the 1H/4H chart). Target: $4640. Stop-loss: very tight, just above the local high.
Idea 2 (Conservative): Stay on the sidelines. In the current market conditions, shorting is playing against the trend and is highly likely to result in losses.
Recommendations for Traders
The market is in a state of euphoria. Beware of FOMO (Fear Of Missing Out) and don't jump on a moving train at any price. The best strategy for going long is to enter on minor pullbacks to support levels. Don't forget risk management and always use stop-losses, as even in a bull market, sharp corrections can happen.
May your decisions be calculated and your portfolios green! Trade with a cool head and a hot heart.
Liked this breakdown? Smash that like button 👍 and subscribe so you don't miss the next liftoff! 🚀
ETH ANALYSIS🔴 #ETH Analysis : ❓❓
🔮There is a formation of "Bullish Pennant Pattern" in #ETH in 4HR time frame. We can expect around $4850 bullish move if the price break the pattern.📈
⚡️What to do ?
👀Keep an eye on #ETH price action. We can trade according to the chart and make some profits. ⚡️⚡️
#ETH #Cryptocurrency #Breakout #DYOR

ETH 1H Analysis - Key Triggers Ahead | Day 21👋🏻 Hey everyone! How’s it going? Hope you’re all doing well.
❄️ Welcome to Crypto Winter.
⏰ Today, we’ll be analyzing ETH and exploring its potential opportunities.
👀 On the 1-hour timeframe, Ethereum broke its trendline after yesterday’s news and started moving upward. It is currently testing resistance at $4,619, and a confirmed breakout above this level could open the way for further upside movement.
🧮 Looking at the RSI oscillator, two key zones stand out. Given the positive economic news from yesterday and today, which increased capital inflows into equities, the 70 level and potential entry into the overbought zone become more significant. This could support Ethereum’s price in moving higher.
🕯 The size, volume, and frequency of green candles have increased. With continued buying pressure and momentum pushing into the overbought area, Ethereum may break the $4,619 resistance, absorb sell orders, and continue its upward move.
💸On the 1-hour timeframe, (ETHBTC), Ethereum is also showing strength. After breaking its trendline, it moved upward but is currently facing resistance at 0.0396 and has been rejected once. A breakout and stabilization above this zone would likely support further bullish movement for Ethereum against Tether as well.
🧠 If Ethereum confirms a breakout and holds above $4,619, it could trigger a strong bullish rally, potentially extending toward higher price levels. Traders should note that entries can be considered after stabilization with a multi-timeframe indecision candle setup. However, the possibility of pullbacks and corrections in Ethereum remains present.
❤️ Disclaimer : This analysis is purely based on my personal opinion and I only trade if the stated triggers are activated .

ETH BOUNCE at $4200 - Correction LIKELYAre you watching ETH in the daily timeframe 👀 ?
ETH is trading on a major support zone, and after a failed breakout here the price could likely be heading back towards the lower support area in the short term.
For the past 157 days, ETH has pretty much been trading UP only. We see this if we look at the price action from a daily timeframe over the past few months.
The price is likely to head lower towards the 4200 region where a bounce is possible - this will be a healthy cooldown for the short term.
________________________
BINANCE:ETHUSDT

#ETHUSDT 6H ChartPrice retested the 100MA inside our 4h demand zone and moved up exactly as predicted. MACD is turning bullish, RSI is bought and EMAs are bullish. Price is expected to reach the minor supply at $4,730 as a short-term target.

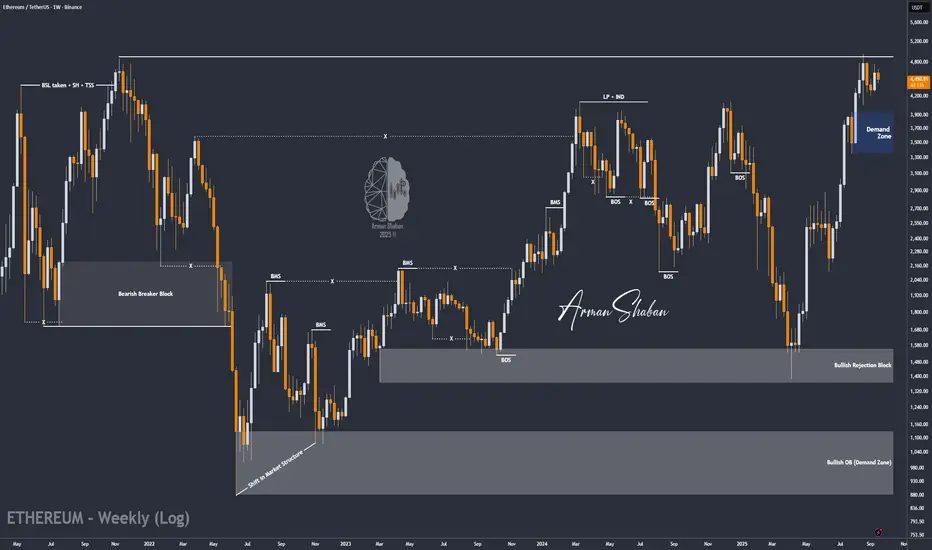
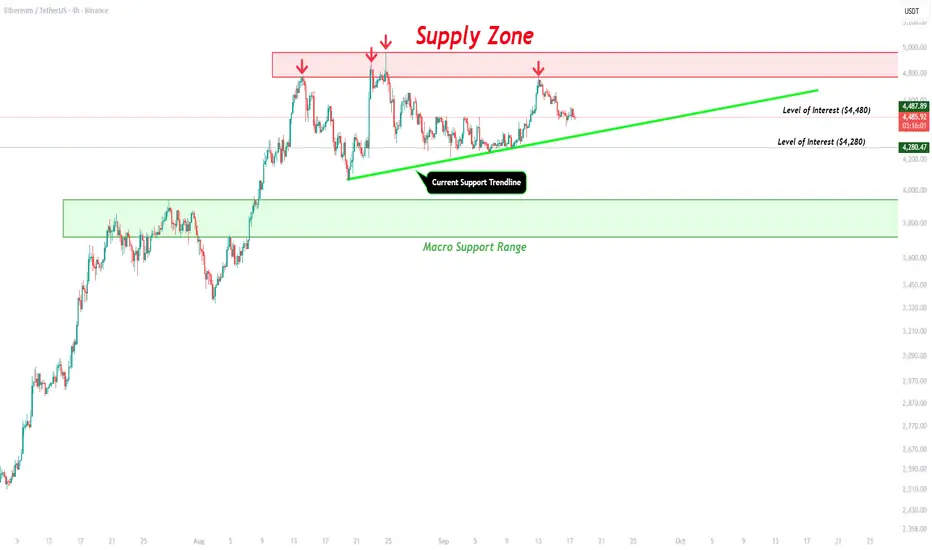
ETH/USDT | Ethereum Pullback Over? Next Stop New Highs! (READ)By analyzing the Ethereum chart on the weekly timeframe, we can see that after climbing to $4,700, the price pulled back and is now trading around $4,500. If ETH can hold above the $4,480 level, we can expect more upside.
However, today the market will be very volatile due to the Fed interest rate decision. With that condition in mind, the next possible bullish targets for Ethereum are $5,100, $5,500, and $6,000.
Please support me with your likes and comments to motivate me to share more analysis with you and share your opinion about the possible trend of this chart with me !
Best Regards , Arman Shaban
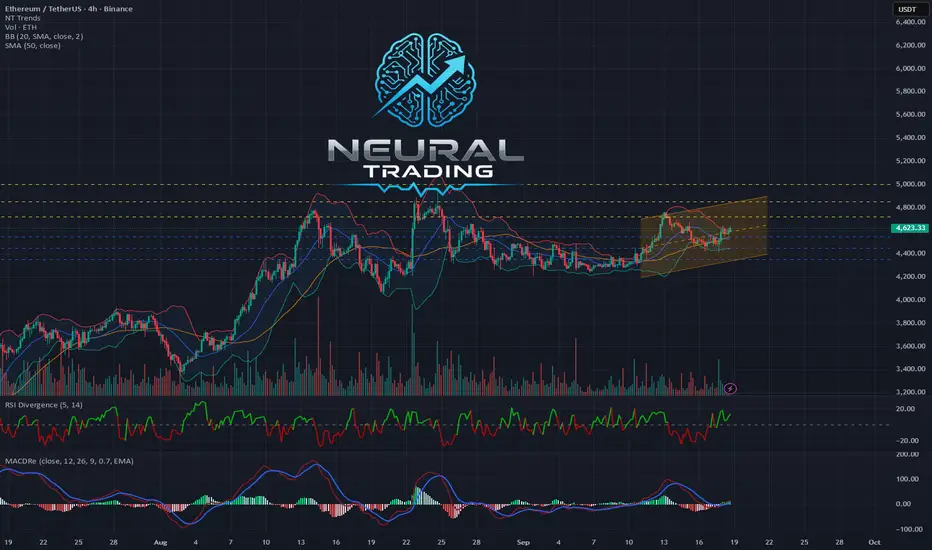
Ethereum (ETH): Target Remains Same | Bullish For $5555ETH is still close to EMAs, a zone that has been holding the price for quite some time now.
Despite that, we are seeing smaller signs of buyers dominance so nothing changes for us.
We still look for the price to stay above the EMAs and as long as we do so, our target will be $5555 (a phantom resistance, let's call it, as it has not been reached yet).
Swallow Academy

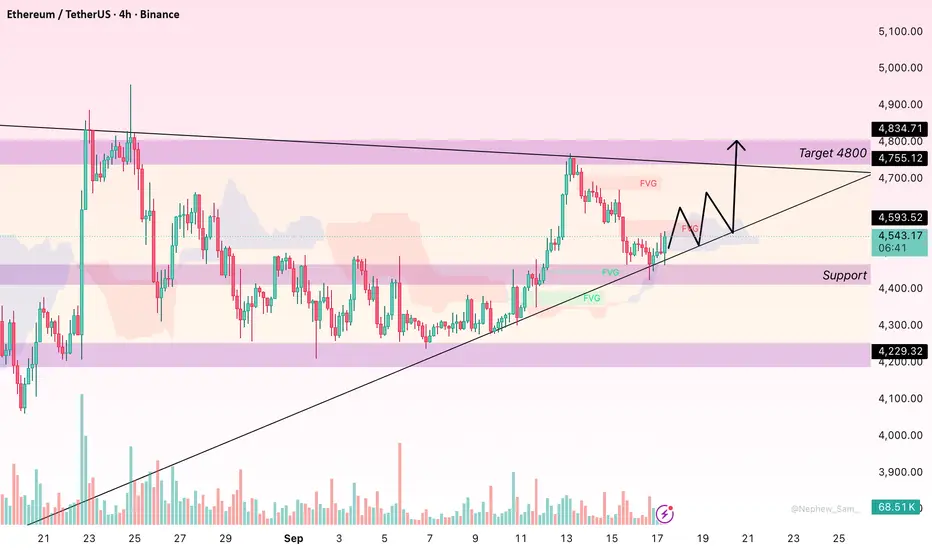
ETH Keeps Bullish Trend with Key Support LevelsHello everyone, Ethereum (ETH) is currently trading around $4,546, after correcting from the recent high of $4,800 down to $4,460. This area is an important support zone, along with $4,400, both of which are Fair Value Gaps (FVG) and could provide critical support if the market continues to pull back. The Ichimoku Cloud remains supportive of the bullish trend as the price stays above the cloud. However, the $4,600 level may act as short-term resistance that ETH needs to overcome before pushing higher towards the $4,800 mark.
On the fundamental side, Ethereum remains supported in the long term due to its transition to Proof of Stake and the growing demand in DeFi and NFTs. However, ETH’s price action is still closely tied to Bitcoin, so if BTC remains stable or continues to rise, ETH could gain additional momentum. Conversely, a significant pullback in Bitcoin could directly impact ETH. In the short term, it’s wise to monitor price action around the $4,460–$4,400 range. If ETH holds these levels, there’s a high likelihood it will bounce back to test $4,600, and possibly revisit the $4,800 peak.
ETH/USDT: Bullish Rise to 4770?As the previous analysis worked exactly as predicted, BINANCE:ETHUSDT is gearing up for a bullish move on the 4-hour chart , with an entry zone between 4350-4395 near a key support and trendline.
The target range of 4735-4770 aligns with the next resistance, signaling strong upside potential. Set a stop loss on a close below 4228 to manage risk effectively. Watch BTC trends! 💡
📝 Trade Plan:
✅ Entry Zone: 4350 – 4395 (support + trendline area)
❌ Stop Loss: Daily close below 4228 to manage risk
🎯 Target Zone: 4735 – 4770 (next resistance level)
Ready for this lift-off? Drop your take below! 👇

ETHUSDT Long Trade SetupETHUSDT is showing bullish divergence at LLs, to make sure that divergence is effective we will take long entry at LH breakout, follow the below trade Plan
Trend: Bearish
Divergance: Bullish
Bias: Neutral
Scenario: Make Entry at LH breakout
Trade Plan
Stop Loss :4400
Entry Level: 4562
TP1: 4724

#ETH: Daily AI Market Breakdown. 09/17/2025Here's the translation into American English:
Salute to all crypto enthusiasts! 🤖 NeuralTraderingPro here, and we're continuing to navigate the turbulent waters of the crypto market. Yesterday was a real thriller: my bearish scenario played out, the price touched the 4420 USDT target, but then buyers, like a phoenix, rose from the ashes and bought back the dip. This wasn't just a level defense; it was a demonstration of strength. The market showed it's not ready for an unconditional surrender. Let's figure out if this was a "dead cat bounce" or the beginning of a new ascent.
Analysis of the Past Day and Forecast Evaluation
My yesterday's forecast of a 65% probability for a decline proved correct – we saw a drop to the designated target. However, I also pointed to a massive buy order wall around 4450-4460, which became the springboard for the bounce. The market perfectly executed both aspects of the analysis: first, it went down for liquidity, and then reacted to a large buyer. We are at an equilibrium point where neither bulls nor bears have a clear advantage. The battle for initiative continues.
Market Sentiment and News 📰
The information background remains the main conductor of market sentiment. Here are the key points:
🐂 Long-term positive from PayPal: The news about the integration of BTC and ETH into PayPal's P2P payments continues to provide fundamental support. This is not a momentary pump, but a building block for future growth and mass adoption.
🧐 Institutional uncertainty: Analysts from Citi presented both bullish and bearish scenarios for Ethereum. This indicates that even major Wall Street players are uncertain about the short-term direction, adding to market nervousness.
💰 "Smart money" is buying the dip: Data showing an inflow of $3.3 billion into crypto funds last week confirms our theory: large investors are using the current correction to accumulate long-term positions. They are not panicking; they are buying.
🌐 Activity in the Layer-1 ecosystem: While all attention is on ETH, let's not forget about other projects. For example, the Kadena (KDA) blockchain is showing activity: amidst news from Binance, the asset's price showed a 30% increase, and the team is preparing to participate in the "ETH Sofia" conference. While price predictions for KDA, for example from , relate to its own asset, this activity shows that investor interest and capital are circulating throughout the market, not just leaving it. This is a sign of the health of the entire crypto industry.
Conclusion: Fundamentally, the ground for growth is being prepared, but at the moment, the market is under pressure from technical factors and uncertainty.
Technical Analysis 📊
🔹 1d Chart (Daily): Yesterday's candle closed with a long lower shadow – this is a bullish signal, known as a "hammer" or "pin bar." It indicates that buyers decisively bought back the dip. The price is trying to return above the SMA 20 (blue line). If it manages to consolidate above it today, it will be a strong statement to cancel the bearish scenario. RSI bounced off the 50 level, showing renewed buyer interest. MACD still looks weak and threatens a bearish crossover. The situation is on the edge.
🔹 4h Chart (Four-hour): Here, the key battle unfolds. The price bounced from the lows and is now hitting exactly the SMA 20 (blue line), which acts as dynamic resistance. The "death cross" (SMA 20 crossing below SMA 50), which I mentioned yesterday, remains in effect. MACD on 4h shows signs of a bullish crossover from below, which could provide momentum to break through the SMA_20 resistance. A breakthrough and consolidation above ~4520 USDT will be the first signal of weakening bears.
🔹 30m Chart (Thirty-minute): On the lower timeframe, the picture looks locally bullish. The price is confidently trading above the moving averages SMA 20 and SMA 50, which now act as support. RSI is in the bullish zone. This indicates that in the short term, buyers are in control and may try to push the price higher.
Order Book Analysis (DOM) ⚖️
Current price ~4490.0 USDT. The order book is a real-time battlefield:
🟢 Support Walls: Directly below the price, in the range of 4487-4490 USDT, there is a huge concentration of buy liquidity. Orders totaling ~110k USDT, ~102k USDT, ~73k USDT create a solid floor. Buyers clearly don't want the price to go down again.
🔴 Resistance Walls: The main enemy is right in front of us. At 4490.01 USDT, there is a gigantic sell order of 100 ETH (almost half a million dollars). This is a monolithic wall. Further, up to 4493 USDT, a series of obstacle orders are placed.
Conclusion: The order book shows a clinch. Sellers have set up a huge wall to stop the bounce. Buyers have built an echeloned defense just below. A breakthrough of the wall at 4490.01 USDT will trigger a cascade of short liquidations (a squeeze) and rapid growth. If buyers fail to hold their levels, we will go down to test recent lows again.
Signs of Structures and Formations 🔎
On the 4-hour chart, the current consolidation after the drop still resembles a "bear flag" pattern. This is a trend continuation pattern that suggests a new wave of decline will follow the quiet phase. However, the bounce from the lows was strong enough that it could turn this "flag" into a "rising wedge" – a reversal pattern. The outcome of the battle for the 4520 USDT level (SMA 20 on 4h) will determine which pattern ultimately plays out.
Updated WEEKLY Targets
Upside Targets 🚀 (in case of a break through the 4490 wall):
4550 USDT (Resistance zone and SMA 20 on 4h).
4640 USDT (Area of SMA 50 on 4h, strong resistance).
4720 USDT (Local high before the drop).
Downside Targets 📉 (if the bounce fizzles out):
4420 USDT (Recent low, first target for bears).
4350 USDT (Key support — SMA 50 on the daily chart).
4200 USDT (Powerful structural support level).
Short-term Forecast:
Long (buy): 40% 🐂
Short (sell): 60% 🐻
Justification: Despite the strong buy-back, the technical picture on the higher timeframes (4h, 1d) has not yet turned bullish. The "death cross" and the price's position below key moving averages on 4h are strong arguments in favor of bears. The giant sell wall in the order book is currently holding back growth. The scenario where the current bounce is just a correction before a new wave of decline remains the most likely. However, the strength of buyers at the lows forces caution.
Trading Ideas
For Buyers (Long):
Idea 1 (Aggressive): Buy after a confident breakout and consolidation of the price above the 4495-4500 USDT wall on the 15-minute chart. Target: 4550 USDT. Stop-loss: below 4470 USDT.
Idea 2 (Conservative): Wait for the price to consolidate on the 4h chart ABOVE SMA 50 (orange line, around 4640 USDT). This will be a powerful signal of a trend change. Target: 4720 USDT. Stop-loss: below 4580 USDT.
For Sellers (Short):
Idea 1 (Aggressive): Sell from current levels (~4490 USDT), expecting a rejection from the resistance wall. Target: 4420 USDT. Stop-loss: tight, above 4515 USDT.
Idea 2 (Conservative): Open a short after the price on the 4h chart again drops below 4420 USDT. This would mean the "bear flag" is activated. Target: 4350 USDT. Stop-loss: above 4470 USDT.
Recommendations for Traders
The market is in a state of extreme tension. Trading within the current narrow range is very risky. The best tactic is to wait for a breakout. Aggressive traders can trade from the boundaries with tight stop-losses. Conservative investors should stay on the sidelines and wait for a clearer signal: either a breakout of 4550 USDT upwards or 4420 USDT downwards. Always use stop-losses!
May your trades be cold-blooded, and your profit inevitable! Trade according to the plan, not emotions.
Liked the breakdown? Support it with a like 👍 and subscribe so you don't miss the next analysis! 🚀
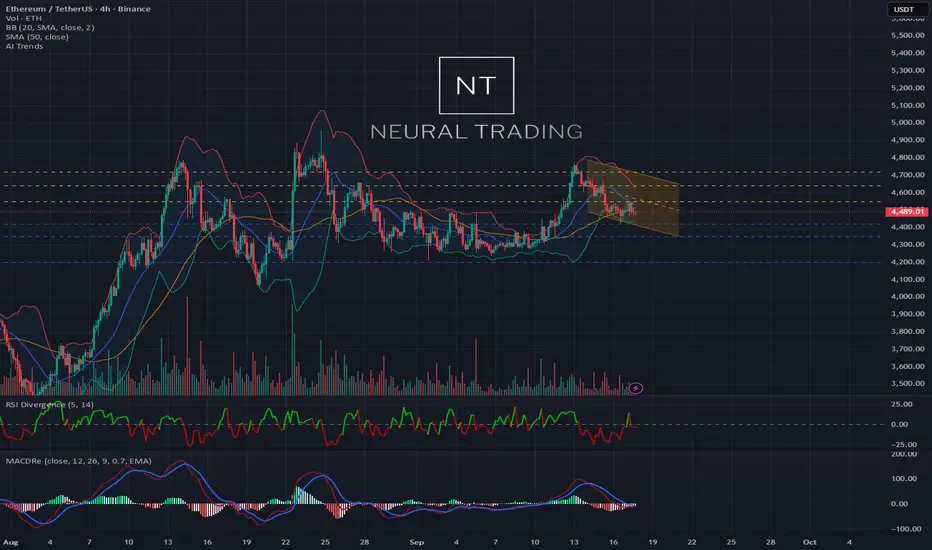
ETH - Current Levels Pre Rate CutJust wanted to outline the chart as it sits before rate cuts. Once the market makes the move off the announcement we will reanalyze and make a follow up post on what could be next.
Ethereum Trade Setup📲 NFX Trade Alert – Swing Setup
💹 Instrument: Ethereum COINBASE:ETHUSD
🛒 Trade Type: Swing – Buy at Market
📍 Entry: $4,690
⛔ Stop Loss: $4,624 (tight stop placed just below the S/R breakout level)
✅ Target Profit: $5,050
📊 Trade Setup Analysis – BINANCE:ETHUSD
MARKETSCOM:ETHEREUM Ethereum showed no weakness over the weekend, breaking decisively above the $4,650 resistance and extending toward $4,750. Price has since retested $4,650(23.6% Trend Fib), with strong rejection confirming this former resistance is now acting as solid support.
We’re applying a tight stop loss at $4,624, just below the breakout level, to minimize risk while maintaining bullish exposure.
With this breakout confirmed, there’s no major resistance until the previous ATH around $4,950. The path remains open for continuation higher.
⚖️ Risk management remains key - even strong, high-probability setups demand discipline and protection. 💚

Ethereum - What's Next?📢 NFX Market Update – COINBASE:ETHUSD
Similar to COINBASE:BTCUSD , BINANCE:ETHUSD faced strong resistance at $4,785 - no surprise, given the historical weight of that zone. Price has since retreated to retest the previous breakout level, which is now likely to act as support if rejection holds.
This zone also aligns with a block order level, previously marked by multiple rejections before the eventual breakout. While I expect support to hold, there is a chance of a deeper test toward the 200-day SMA before continuation.
Overall, the chart structure remains bullish, and fundamentals are also strongly supportive. With key news and macroeconomic data scheduled mid-week, I remain bullish on COINBASE:ETHUSD heading forward.

ETH 1H Analysis - Key Triggers Ahead | Day 20👋🏻 Hey everyone! How’s it going? Hope you’re all doing well.
❄️ Welcome to Crypto Winter.
⏰ Today, we’ll be analyzing ETHUSDT and exploring its potential opportunities.
👀 On the 1-hour timeframe for Ethereum, we observe that after exiting its box, Ethereum entered a downtrend, marked by a trendline. As much as attention was given to it, suddenly it was ignored, and buyers could not keep the price high enough. Ethereum’s triggers are completely defined — with a breakout and confirmation of these zones, Ethereum can create trading opportunities for us.
🧮 The key RSI oscillator levels are 59 and 30. If momentum passes these levels, Ethereum could start its move, although it may be ignored at times. After rejection from the $4,757 zone, red candles were significantly larger than green candles. Today, Ethereum’s volume is increasing, and we need to see what will happen with the news for Ethereum.
💸 The ETH/BTC pair, or Ethereum versus Bitcoin, is currently in a compression resembling multi-timeframe accumulation. Exiting this compression can clearly determine Ethereum’s direction. The upper and lower bounds of this compression can be considered alert zones, where you can observe price behavior when it reaches these levels.
🔴 Today’s news could have a significant effect on Ethereum. Especially if a stepwise interest rate cut occurs, Ethereum could reach targets above $6,000 and create a larger DeFi space, particularly in terms of contract and collateral infrastructure.
🧠 To enter Ethereum positions, we need to wait for a bullish move in ETH/BTC, confirmation in ETH/USDT, and a breakout of key resistances. After these breakouts occur, we can enter at each level and stay in the trades as long as the market allows.
❤️ Disclaimer : This analysis is purely based on my personal opinion and I only trade if the stated triggers are activated .

Exit Psychology 1/5 : The Initial StopNOTE – This is a post on Mindset and emotion. It is NOT a Trade idea or strategy designed to make you money. If anything, I’m taking the time here to post as an effort to help you preserve your capital, energy and will so that you are able to execute your own trading system as best you can from a place of calm, patience and confidence.
This 5-part series on the psychology of exits is inspired by TradingView’s recent post “The Stop-Loss Dilemma.” Link to the original post at the end of this article.
Here’s a scenario:
You set a clean initial stop beneath structure. Price drives down, tags just above it, hesitates… Your chest tightens. Thoughts race: “It’s just noise… give it room.” You widen it. Minutes later you’re out with a larger loss, shaken confidence and a strong urge to make it back.
How behaviour shows up with initial/safety stops:
When discomfort builds, many traders start negotiating with themselves. This often leads to small adjustments that feel harmless in the moment, but gradually undermine the original plan:
Widening the stop as price approaches (turning limited risk into larger or open-ended risk).
Nudging to break-even too soon (seeking relief more than edge).
Cancelling the hard stop and promising a “mental stop” (self-negotiation begins).
When traders choose not to place hard stops:
Not every trader chooses to place a hard stop in the market. For some, it’s a deliberate decision, part of their style:
They want to avoid being caught in stop-hunts around key levels.
They prefer to manage risk manually, based on discretion and market feel.
They use options, hedges, or smaller size as protection instead of stops.
They accept gap/slippage risk as part of their style.
These can all be valid approaches. But avoiding a fixed stop doesn’t remove the psychological pressures it simply shifts them:
Discipline under stress : Without an automatic exit, you rely entirely on your ability to act quickly and decisively in real time. Stress can delay action.
Mental drift : A “mental stop” is easy to move when pressure builds. The more you rationalize, the further you drift from your plan.
Cognitive load : Constant monitoring and decision-making can create fatigue and reduce clarity.
Risk of paralysis : In fast markets, hesitation or second-guessing can lead to missed exits or larger losses.
What’s really underneath (the psychology-layer):
So why do these patterns repeat, regardless of style? It’s rarely about the chart itself. It’s about how the human mind responds to risk and uncertainty:
Loss aversion : Losses hurt ~2x more than equivalent gains feel good which leads to an impulse to delay the loss (widen/erase stop).
Regret aversion : After a few “wick-outs,” the mind protects against future regret by avoiding hard stops or going break-even too early.
Ego/identity fusion : “Being wrong” feels like I am wrong and then to protect self-image one moves the line.
Illusion of control : Tweaking the stop restores a feeling of agency, even if it reduces expectancy.
Sunk-cost & escalation : More time/analysis invested makes it that much harder to cut.
Time inconsistency : You planned rationally; you execute emotionally in the moment (state shift under stress).
Physiology : Stress narrows perception (tunnel vision, shallow breath, tight jaw), pushing short-term relief behaviors over long-term edge.
Reframe:
The initial stop isn’t a judgment on you. It’s a premeditated boundary that keeps one trade from becoming a career event. It’s not about being right; it’s about staying solvent long enough to let your edge express itself.
Practical tips … the How:
Turning insight into action requires structure. A few ways to anchor the stop as your ally, not your enemy:
Pre-commit in writing : “If price prints X, I’m out. No edits.” Put it on the chart before entry.
Size from the stop, not the other way around : Position size = Risk per trade / Stop distance. If the size feels scary, the size is wrong, not the stop. Do not risk what you can not afford on any one trade / series of trades.
Use bracket/OCO orders to reduce in-the-moment negotiation. If you insist on mental stops, pair them with a disaster hard stop far away for tail risk.
Tag the behaviour : In your journal, checkbox: “Did I move/delete the stop? Y/N.” Review weekly; if you track the behaviour consciously you will be more likely to respect your stops.
Counter-regret protocol : After a stop-out, don’t chase a re-entry for 15 minutes. Breathe, review plan, then act.
For those that choose not to place stops in the market, but use mental stops instead, I’d offer the following thoughts to help manage the shift from automation to discipline.
Define exit conditions before entry (levels, signals, timeframes) and write them down.
Pair mental stops with “disaster stops” in the system, far enough away to only trigger in extreme cases.
Size positions conservatively so you can tolerate wider swings without emotional hijack.
Use check-ins (timers, alerts) to prevent emotional drift during the trade.
Build routines that reduce decision fatigue so you can act clearly when the market turns.
Closing thought:
A stop isn’t a punishment; it’s tuition. Pay small, learn quickly and keep your psychological capital intact for the next high-quality decision. One of my favourite sayings told to me by a trader many years ago stands true even to this day. Respect your capital and ‘live to trade another day’.
This is Part 1 of the Exit Psychology series .
👉 Follow and stay tuned for Part 2: The Break-Even Stop - Comfort or Illusion?
A link to the original article as promised:
