$ETH doesn’t look done pumping yetCRYPTOCAP:ETH doesn’t look done pumping yet. While it’s screaming for consolidation, past cycles suggest another leg up toward $5,200–$5,400 or even higher at $6,000 before hitting critical overbought levels.
The likely scenario, if history repeats, is a sharp correction back to the EMA 50. However, strong institutional inflows could front-run this, pushing CRYPTOCAP:ETH higher without ever revisiting $4,000.
MACD and RSI are extended, but price action remains resilient. CRYPTOCAP:ETH can stay overbought longer than expected before finally flipping bearish.
No bearish divergeance, just a nice pump.
Bottom line: CRYPTOCAP:ETH still looks bullish, with 20–50% upside from here likely. But momentum is heating up, so it may be wise to gradually secure profits before the inevitable pullback.
DYOR
ETHUSDT.3S trade ideas

ETH – pumpa or fakie?Very tight consolidation in our demand box. We're finally doing another attempt at breaking up and taking all the highs at 4500.
I would look for a rejection there, then either a retest of the current price, or a sweep of all the lows at 4270.
If we fail to even get to 4500, I think it's more likely that we take the lows of our demand box.
In that case we need a fast reclaim of the ema and demand cluster, or we open up the gates to a lot lower (3500-3700).
No certainty on this chart for me, although it is looking very likely that some resolution will come sooner rather than later.

ETH - Don’t be fooled - Bearish Retest ETH (like Bitcoin) has risen only to retest a bearish breakdown on the HTF.
This whole upwards movement is one big set up - to trap liquidity in longs and absorb it all from the chart.
My initial call is marked here with original entry.
Second entry can be 4,420 region.
Short to my targets marked on chart.
Don’t be a sucker and get trapped by this.
Happy trading

ETH 4H Analysis - Key Triggers Ahead | Day 18😃 Hey , how's it going ? Come over here — Satoshi got something for you!
⏰ We’re analyzing BTC on the 1-Hour timeframe.
🔭 On the 4-hour timeframe of Ethereum we can see that ETH is clearly in a very strong consolidation, and for several days even the oscillator has been ranging around the 50 zone. This time-based range will eventually come to an end. Ethereum now has two important levels ahead with the upcoming news: the top of the box midline at $4373, where breaking this zone could trigger a strong pump, and the bottom zone, which is a maker-buyer area at $4252, considered a very strong and important support for Ethereum.
⛏ The key RSI levels for Ethereum are at 57 and 40. If the range of oscillation crosses these levels, ETH could gain more volatility and even move toward its overbought or oversold regions. Usually, this type of short-term consolidation ends with a good price move once the compression is broken.
💰 The size, volume, and number of green candles have really decreased, and multiple candles inside the range have formed, creating a decision-making phase for ETH. With today’s PPI news, it is likely that one of these zones will either be touched or broken, and after this news, candles are expected to come with stronger volume.
🪙 On the 4-hour timeframe of the ETHBTC trading pair we can see that it is in a descending continuation channel. Each time the price has reached the top or bottom of this channel, it has reacted with a reversal and then moved in the opposite direction. Currently, ETHBTC is above its midline and has shown a positive reaction to it. The volatility of this pair has significantly decreased in recent days and is now ranging under its 50 zone. A breakout above the channel top and the 0.03893 level could start a bullish move.
💡 The zones we are considering for Ethereum’s top and bottom are $4493 and $4252. Breaking either of these levels after this multi-day consolidation could start a strong trend and even a sharp directional move! Keep in mind that war and economic news have created interconnections for risky markets—trade with low risk.
❤️ Disclaimer : This analysis is purely based on my personal opinion and I only trade if the stated triggers are activated .

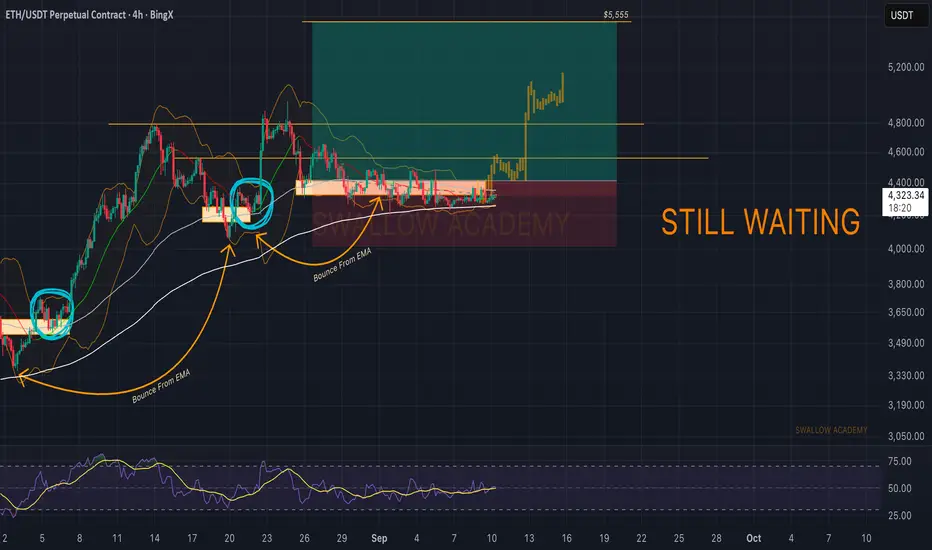
Ethereum (ETH): Still near EMAs | Expecting An Explosive MoveETH is still sitting around the EMAs on the 4H timeframe, where pressure continues to build up. Buyers haven’t let the structure break down, but we’re still waiting for that clean confirmation to trigger the bullish move toward our target zone near $5,555.
Patience is key here — the setup remains valid, and the EMAs continue to act as the zone of pressure we highlighted earlier.
Swallow Academy
ETHUSDT – Sideways with Long-Term OpportunitiesCurrently, ETHUSDT is trading in a sideways range, fluctuating between key support and resistance levels. After facing resistance at 4,360 USD, the price has corrected and is now moving within the range of 4,170 USD – 4,360 USD. The market is lacking decisiveness and there are no strong signals to break these levels.
On the H4 chart, ETHUSDT remains below the downtrend line, indicating hesitation in breaking out. The price has not been able to surpass EMA34 and EMA89, reflecting uncertainty in the trend.
In this sideways market, the price could continue to fluctuate within the 4,170 USD support and 4,360 USD resistance. If a breakout occurs, ETHUSDT may target higher levels, especially if strong capital inflows continue.
Overall, the sideways trend still dominates. However, the market could change quickly if macroeconomic factors or shifts in monetary policy and major events come into play.

ETH/USDT COILING I often return to assets with fresh eyes and new time-factor . Here is my latest for: ETH/USDT idea.
ETH/USDT is COILING and ready for another leg to test ATH high again. It must first travel and claim the a new DISCOUNT ARRAY before its true moment can be filled.
DAILY FVG has been disrespected and now acting as the new DISCOUNT ARRAY for a potential move higher. A BREAKAWAY candle on the DAILY FVG just below is what will be our confirmation. Best of luck.
🚩 Invalidation: If the Daily FVG breaks with a clear breakaway candle, this setup is void.

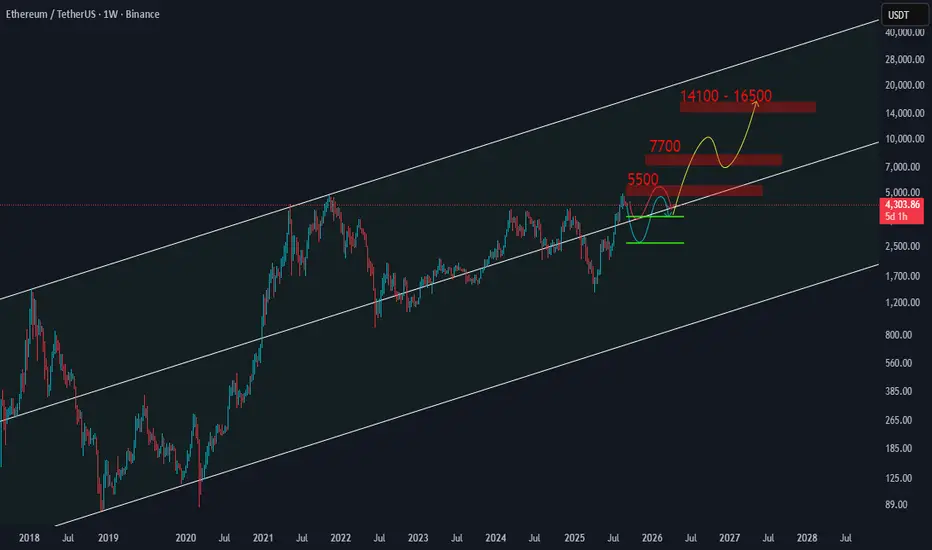
Ethereum Weekly Time Frame AnalysisEthereum is correcting to $3,600 or in the most pessimistic case to $2,500 and then will move towards the next targets of "5,500" and "7,700" and "14,100" to "16,500" respectively .
Ethereum short?The more and more ether hits support at $4,250 the more likely it is to break, keep a close eye on $4,250, as a daily close below this level will open up an opportunity to short ether before it drops 8% +

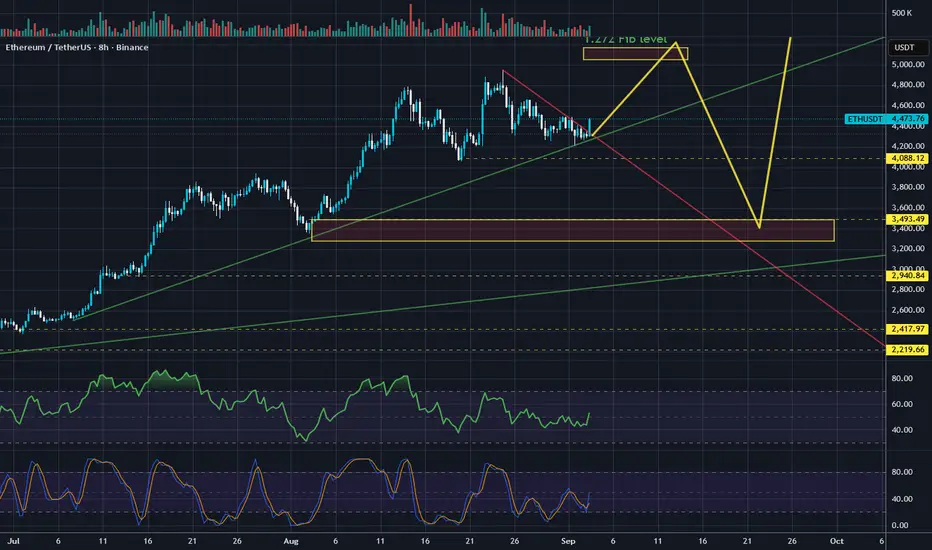
ETH one last push before rate cuts in September.Ethereum broke down-trend since last All time high while holding green trend line.
This gives one more opportunity to visit 1.272 fib level which is at 5100-5250$
After this move is done expect agressive correction to ~3440$. ETH will surge up to the new ATH at the end of this cycle after correction is over probably somewhere in october.
Idea for ETHThis is short term idea for ETH.Agree? based on rtm i see drives following through eachother and drive 1 being ignored by a secret signal which i expect for a sell from above as a main idea.

ETH Game PlanETH Game Plan
📊 Market Sentiment
Market sentiment remains strongly bullish as the FED is expected to deliver a 0.25% rate cut, with speculation building for a possible 0.5% cut in September. Monetary policy shifts are being driven by both inflation trends and weakening labor market data. The latest August and September job reports were soft, signaling that the economy is cooling rapidly. This environment continues to fuel expectations for a major bullish run in the weeks ahead.
📈 Technical Analysis
Price has shown strong HTF bullish momentum, recently reaching all-time highs.
Currently, ETH appears to be in an accumulation phase, gathering liquidity and energy before the next expansion higher.
📌 Game Plan
Price should run the $4200 level, which is equal lows and likely contains significant liquidity.
I will then look for a close back above $4200 with a newly formed 4H demand zone.
🎯 Setup Trigger
4H structure break following the liquidity run.
📋 Trade Management
Stoploss: 4H swing low confirming the BOS
Targets:
TP1: $4500
TP2: $4650
TP3: $5000 (All-Time Highs)
💬 Like, follow, and comment if you find this setup valuable!
⚠️ Disclaimer: This content is for informational and educational purposes only and does not constitute financial, investment, or trading advice. Always do your own research before making any financial decisions.

ETH 1H Analysis - Key Triggers Ahead | Day 17💀 Hey , how's it going ? Come over here — Satoshi got something for you!
⏰ We’re analyzing BTC on the 1-Hour timeframe.
🔭 On the 1H timeframe for Ethereum (ETH), price rejected strongly from the 4336$ resistance and started moving lower. ETH is now trading close to its support zone at 4286$, having recently broken out of a consolidation range.
⛏ On the RSI, the key levels are 70 and 37. A move beyond these zones could trigger momentum toward either overbought or oversold conditions. Keep in mind that volatility is still closely tied to macroeconomic news.
💰 Candle structure shows increasing red candle size and volume, signaling stronger selling pressure. With ETH being heavily involved in both futures contracts and DeFi markets, much of this move reflects profit-taking and sell pressure at higher levels.
🪙 Looking at the ETHBTC pair on the 1H, the chart shows a steady downtrend within a compression zone. If ETH loses its current support, the pair could extend further down. The volatility index for this pair is sitting at 45.52, below the 50 zone, and with short positions picking up, ETH could face additional sell pressure.
💡 The current zone ETH is trading in looks like a maker-buy area, but likely to be broken by whale candles.
For short positions : The better setup would be to wait for a whale candle break, then enter on the pullback for higher win rate.
For long positions : A clean breakout above 4336$ would allow for an order stop-buy entry or a pullback + candlestick confirmation setup to get in long.
⚠️ Note: Today looks like a high-impact day with global shifts in play—trade with reduced risk.
❤️ Disclaimer : This analysis is purely based on my personal opinion and I only trade if the stated triggers are activated.

#ETHUSDT 4H ChartPrice is currently consolidating between the 100MA and 200MA showing no major changes. MACD is showing some bullish momentum, RSI is bought and EMAs are neutral. Price needs to break above the 100MA in order to expect further bullish movements towards the 4h supply at $4,750.

Weekly trading plan for EthereumAll last week, Ethereum’s price was forming a range. At the moment, it is near the key 4,373 level and trying to break through it. Most likely, if this level breaks, the price will push toward the resistance zone and could break it this time.
If, however, a correction starts soon and the weekly pivot point breaks, the target will be a new local low, bringing the price down toward 4,000 .

Intra-Day Trade Review: GOLD, Ethereum, Bitcoin, OilHey guys heres a quick review on FX:XAUUSD , COINBASE:ETHUSD , FX:USOIL & BITSTAMP:BTCUSD
Let me know your thoughts in the comment section below.
Cheers!

ETH/USDT - 1D ETH is consolidating just below its ATH. The news candle low from Aug 22 has held up well so far. Today’s CPI release will likely dictate short-term direction until next week’s FOMC meeting.
Key level to watch: a daily close above 4500. That would open the door for a retest of the ATH, and I expect a new ATH to form into the FED meeting if that breakout holds.

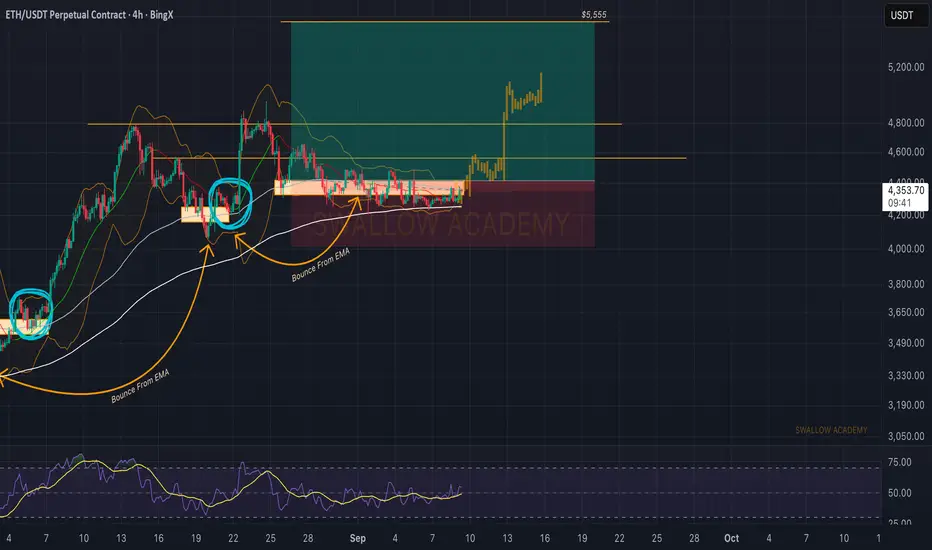
Ethereum (ETH): Pressure Around Zone of EMAs | Bullish? BINGX:ETHUSDT.P is still hovering around the EMAs, creating a zone of pressure. This area has repeatedly acted as a pivot point in the past, and we are now waiting to see if buyers step in with the same momentum.
As long as price holds above this structure, the bullish setup remains valid. A clean bounce from here could open the door for continuation toward $4,800 and eventually $5,555.
Swallow Academy
ETH: Step by StepOn September 6, I opened a short on the 1-hour chart from $4294 — the decision was based on the indicator’s readings. The move down to $4227 allowed me to close the first target. About $70 difference per coin. Part of the profit was realized, part was left to the market — and that’s part of the plan.
The key here is not guessing but consistency. The indicator outlined the key levels, highlighted the control zone, and I followed the scenario step by step. This approach removes chaotic decisions and reduces emotional pressure.
When you see the structure of the move in advance, holding a position becomes easier. The plan turns the market from chaos into a map, where it’s clear when to take profit and when to stay calm. It helps to remain in the trade longer and make decisions without rushing.
The market will always remain unpredictable. But when actions are built on a system, results are shaped not by luck, but by discipline and the ability to move step by step.

ETH/USDTLooking for a sweep of the LPL candle that prohibited the next bullish FVG. Return to the FVG followed with a rejection candle higher and close above Breaker Block, open a long and target prior high.

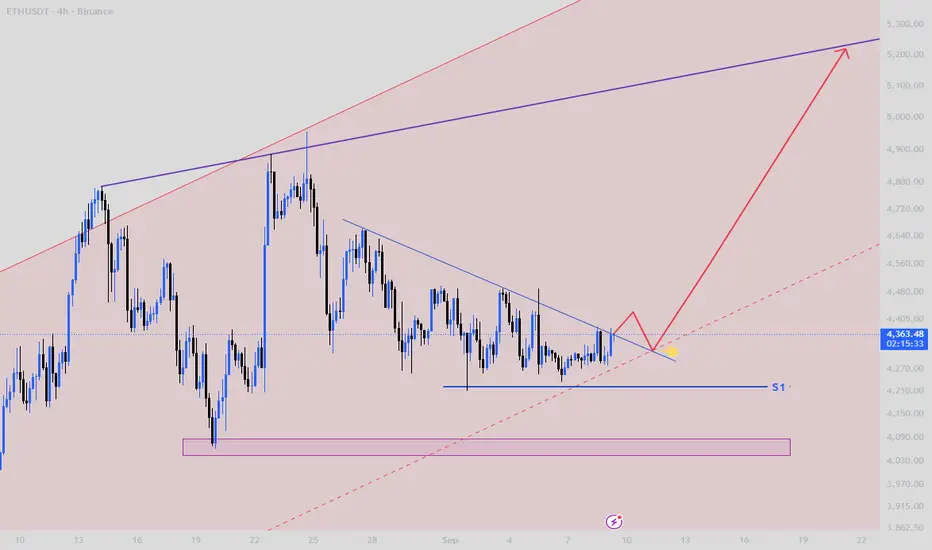
ETHUSDTWe can enter after the blue line breaks at the yellow dot. If the price falls again, the support area (S1) is also a good point to enter.
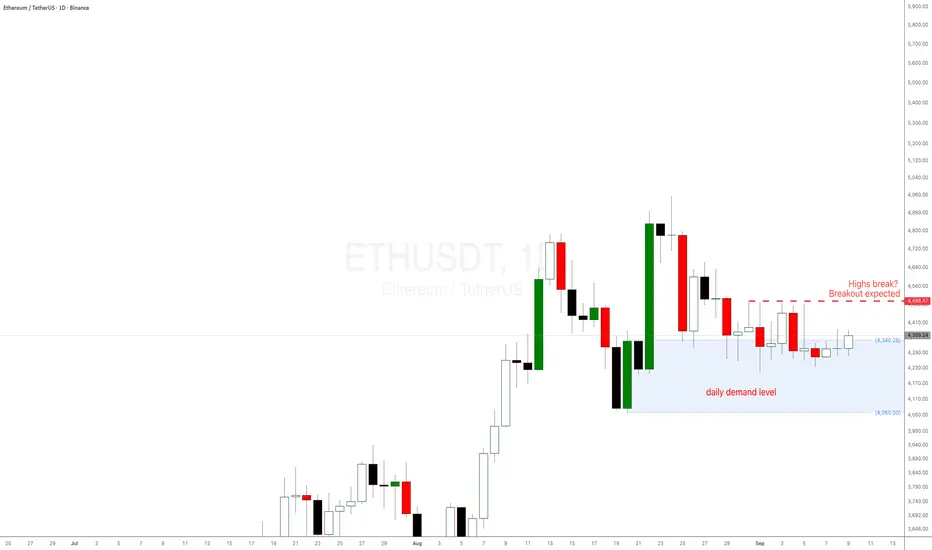
Ethereum ETH 2025 analysis and prediction daily demand levelEthereum ETH 2025 analysis and prediction as a reaction to the daily demand level at $4336. If the daily high in red is broken, a breakout is expected. ETH has been doing nothing for days, price action is not behaving as it usually does at these imbalances.
This is happening with Bitcoin BTC weekly demand level in control and playing out well. Refer to my BTC analysis in another trading idea.
Bitcoin Halving Approaches Fear?? or Greed??Do you believe Bitcoin will repeat its historical halving pattern, or could this time be different?
Which emotion do you think dominates the market now fear of correction or greed for new highs?
Among TradingView’s tools (Fear & Greed Index, Volume Profile, 200-day MA, Fibonacci), which one do you personally trust the most during halving cycles?
Hello✌️
Spend 2 minutes ⏰ reading this educational material.
🎯 Analytical Insight on Ethereum:
Ahead of the upcoming Bitcoin halving, a notable pullback appears likely 📉. Ethereum has broken below its descending channel, indicating bearish momentum. A potential drop of around 15% could target the $3,800 level ⚡.
Now , let's dive into the educational section,
Bitcoin Halving Approaches: Fear of Correction or Greed for Records?
What is halving? Every four years, the block reward for Bitcoin miners gets cut in half. This event means new supply becomes more limited over time. History has shown that after each halving, Bitcoin usually enters a new bullish cycle. But before the real move starts, the market often goes through sharp volatility, creating both fear and greed at extreme levels.
This time the same question repeats itself: will Bitcoin break into new all-time highs after the halving, or will a heavy correction surprise everyone before that happens?
🧠 Psychology of Fear and Greed
Around halving, traders get stuck between two opposite feelings. On one side, the fear of losing money in a possible correction. On the other side, the fear of missing out on massive gains. This psychological battle often causes rushed entries and early exits.
🐋 The Role of Whales
Whales perfectly understand how collective emotions work. At moments of extreme hope or extreme panic, they place heavy orders to flip the market in the opposite direction. Right before halving, this psychological game intensifies more than usual.
⏳ Halving History
Looking back at the three previous halvings, a similar pattern stands out: short-term corrections around the event, followed by a powerful long-term rally. This repetitive history fuels greed and drives many traders to ignore risk management completely.
📊 TradingView Tools
To avoid being trapped by emotions, having the right tools is essential. TradingView provides several key indicators:
The Fear & Greed Index measures overall sentiment. When it shows extreme greed, that’s usually a moment to be cautious.
The Volume Profile highlights price ranges with the highest trading activity. Around halving, these levels often turn into psychological support and resistance zones.
The 200-day Moving Average remains one of the strongest trend indicators, respected in all previous halving cycles.
Even a simple Fibonacci retracement can reveal zones where the biggest emotional battles happen, especially near the golden 0.618 level.
🔑 Conclusion
Bitcoin halving is more of a psychological event than a purely technical one. Charts and indicators provide guidance, but in the end, your mindset determines success or failure. History favors those who resisted collective emotions and followed structured plans.
Three Golden Advices :
Always review Bitcoin’s halving history before making big decisions.
Never forget risk and capital management, especially when greed is high.
Let TradingView tools guide your analysis, not the noise of the crowd.
✨ Need a little love!
We pour love into every post your support keeps us inspired! 💛 Don’t be shy, we’d love to hear from you on comments. Big thanks , Mad Whale 🐋
📜Please make sure to do your own research before investing, and review the disclaimer provided at the end of each post.
