TOTAL2 & ETH – On the Edge of Price DiscoveryTOTAL2 & ETH – The Next in Line for Price Discovery
Today, TOTAL2 has officially broken above its previous all-time high, while ETH is still just below it, getting closer with each daily candle.
This tells an interesting story: altcoins as a whole have already entered price discovery, but ETH being the largest component of TOTAL2, hasn’t quite joined yet. This usually means one of two things: either smaller-cap altcoins are currently outperforming ETH, or ETH is simply building strength for a delayed breakout, a move that often pulls the entire market even higher once it happens.
Still, confirmation matters: TOTAL2 needs a daily close above its ATH, while ETH’s reaction around its own ATH in the coming days will likely decide whether it joins the move.
And let’s not forget: we’ve just entered Q4, and this one might be the strongest Q4 the crypto market has ever seen. Everything that once stood against crypto, from regulation to sentiment, is now turning in its favour, across the US, Asia, and even Europe.
That’s why I believe ETH will soon follow TOTAL2 into price discovery, potentially marking the start of the next major leg up for the entire market.
Bias:
Bullish! TOTAL2 confirmed breakout, ETH close behind. Q4 momentum could be the catalyst that sends both into new territory.
Always take profits and manage risk.
Interaction is welcome.
ETHUSDT.3S trade ideas

ETH. Sell & buy opportunity As it shown in chart the price will keep going down until he hit 4,071.65 after that we will see a small correction and will keep going down until he hits 3,871-3,811 best area to buy from it and wait the market to take you to the top again 4,500

Trading idea based on the Harmonious Energy Flow (HEF) conceptAt the current stage, there is a clear manifestation of buyers’ strength, even though the market environment is changing rapidly without any significant price movement. This forms a state of consolidation, where energy is being accumulated for the next impulse.
According to the HEF concept, consolidation represents a transitional phase — the market is searching for balance before initiating a new wave of directional movement. My current expectation is focused on the moment of breakout from consolidation, when the market will reveal the true side of strength.
📌 Main focus: observing how buyers maintain their advantage within this narrow structure and waiting for a signal confirming the exit from balance.
If you find my charting approach interesting, you are welcome to connect and discuss further. I’m open to communication and collaboration.
Would you like me to refine this version for maximum stylistic alignment with TradingView’s publication tone (slightly shorter, more analytical, and visually structured)?
ETH/USDT Swing Trade | Heikin Ashi Confirmation + Pullback Plan🚀 ETH/USDT: The Great Crypto Heist — Swing/Day Trade Wealth Strategy! 🤑
Ladies and Gentlemen, welcome to the Thief’s Master Plan for ETH/USDT (Ethereum vs. Tether)! 🎩 This is a fun, professional, and calculated swing/day trade setup designed to catch the bullish wave while dodging the traps. Let’s break down this heist with style, precision, and a sprinkle of humor! 😎
📊 Asset: ETH/USDT (Ethereum vs. Tether)
Market: Crypto (High Volatility, High Reward!)
Strategy: Swing/Day Trade with a Thief’s Layered Entry approach
Vibe: Bullish, sneaky, and ready to outsmart the market! 🦹♂️
🧠 The Plan: Bullish Breakout with Technical Confirmation
✅ Bullish Confirmation: We’re riding the bullish wave with a Triangular Moving Average (TMA) pullback. This confirms the trend direction and filters out noise.
✅ Heikin Ashi Magic: A strong bullish Heikin Ashi candle signals momentum. Watch for smooth green candles to confirm the trend’s strength! 📈
🔑 Key Insight: The TMA pullback combined with Heikin Ashi gives us a high-probability setup for a breakout. Stay sharp, Thieves!
🚪 Entry: The Thief’s Layered Approach
🕵️♂️ Strategy: Use a layered entry (multiple buy limit orders) to scale into the trade like a true market bandit!
📍 Entry Levels:
Buy Limit @ $4250
Buy Limit @ $4300
Buy Limit @ $4350
Buy Limit @ $4400
💡 Pro Tip: Feel free to add more layers based on your risk appetite! Stack those orders like a master thief stacking loot. 💰
⚠️ Note: You can enter at any price level within this range if you spot momentum. The layered approach maximizes flexibility!
🛑 Stop Loss: The Thief’s Escape Route
🚨 Stop Loss: Set at $4150 to protect your loot.
⚠️ Thief’s Disclaimer: This is my suggested stop loss, but you’re the boss of your own heist! Adjust based on your risk tolerance. Don’t get caught by the market cops! 👮♂️
🎯 Target: Steal the Profits, Dodge the Trap!
🏦 Target Price: Aim for $4700 as our primary profit zone.
🚨 Resistance Alert: A police barricade (strong resistance) lurks around $4800. This level is overbought and a potential trap for greedy thieves. Cash out early to secure your gains!
💡 Pro Tip: Don’t get too greedy — take profits at your own discretion. The market is full of traps, so escape with your loot! 🏃♂️
👀 Related Pairs to Watch
Keep an eye on these correlated pairs to confirm market sentiment and strengthen your setup:
BTCUSDT ($): Bitcoin often leads the crypto market. If BTC is pumping, ETH is likely to follow. Watch for BTC breaking key resistance at $60,000 for added bullish confirmation.
ETHBTC: This pair shows ETH’s strength relative to BTC. A rising ETH/BTC ratio suggests ETH is outperforming, reinforcing our bullish bias.
SOLUSDT ($): Solana often moves in tandem with ETH. A breakout in SOL above $150 could signal broader altcoin strength.
Key Correlation: ETH’s price action is tightly linked to BTC and overall market sentiment. Monitor BTC’s trend and crypto market cap for context.
🔍 Key Points & Why This Setup Works
TMA Pullback: Acts as a dynamic support zone, ensuring we enter after a healthy retracement.
Heikin Ashi Confirmation: Filters out choppy price action, giving us clear bullish signals.
Layered Entries: Spreads risk and allows flexibility in volatile markets.
Risk Management: Tight stop loss at $4150 keeps the risk-reward ratio attractive.
Market Context: Crypto markets are volatile, but ETH’s bullish structure and correlation with BTC make this a high-probability trade.
📝 Thief’s Code: Risk Management
Dear Ladies and Gentlemen (Thief OGs), this is a fun strategy, but trading is serious business! 🕴️
Set your own stop loss and take profit based on your risk tolerance.
Never risk more than you can afford to lose — this is a heist, not a gamble!
Stay disciplined, and don’t let the market cops catch you off guard! 🚓
“If you find value in my analysis, a 👍 and 🚀 boost is much appreciated — it helps me share more setups with the community!”
Disclaimer: This is a Thief-Style trading strategy crafted for fun and educational purposes. Always do your own research and trade at your own risk. The market is a wild place — stay sharp, Thieves! 🦹♂️
#ETHUSDT #CryptoTrading #SwingTrading #DayTrading #ThiefStrategy #Bullish #TechnicalAnalysis #HeikinAshi #TradingView

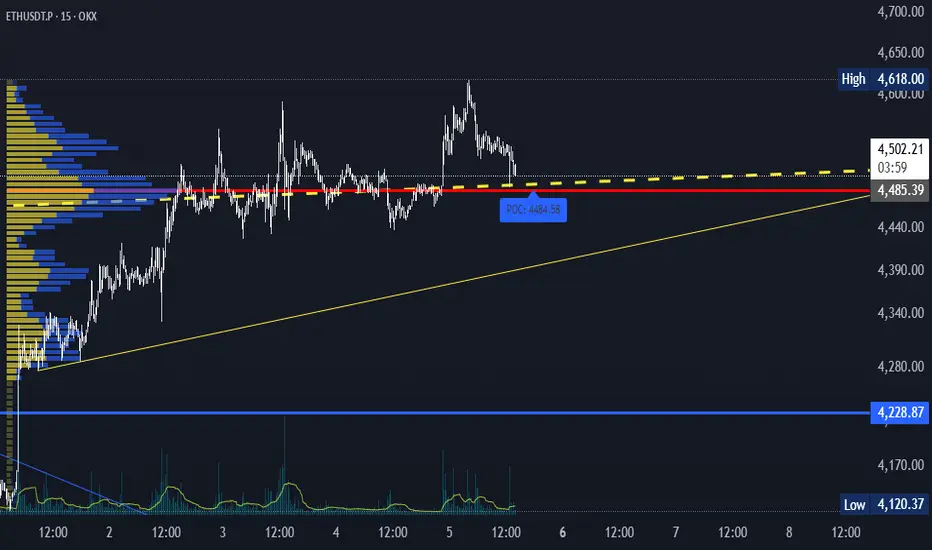
Ethereum Defends $3,800 Support as Bulls Target $4,580Ethereum has rebounded from $3,800, a confluence of Fibonacci and daily support, reclaiming its point of control. This sets up the probability of expansion toward $4,580 and beyond.
Ethereum’s price action has responded strongly to a technical bounce at $3,800, where both the 0.618 Fibonacci retracement and daily support converged. This reaction enabled ETH to reclaim its POC, previously a resistance, and now viewed as a new base for upside expansion.
Key Technical Points:
- $3,800 support holds with 0.618 Fibonacci confluence.
- POC reclaimed, signaling renewed strength.
- Next major resistance lies at $4,580, a key decision level.
After briefly testing lower levels, Ethereum bulls defended $3,800 with conviction. The rebound brought ETH back within its trading range and confirmed the POC as support. This structural shift strengthens the bullish case, particularly as higher closes suggest market acceptance of elevated valuations.
The next resistance, $4,580, remains a key hurdle. A decisive break here, supported by strong volume inflows, will open the door toward a new all-time high. Sustained demand and accumulation above the POC are crucial for follow-through.
What to Expect in the Coming Price Action:
Ethereum looks poised to extend higher, provided it maintains support at the POC. Traders should watch $4,580 for decisive breakout signals that could mark the path to new highs.
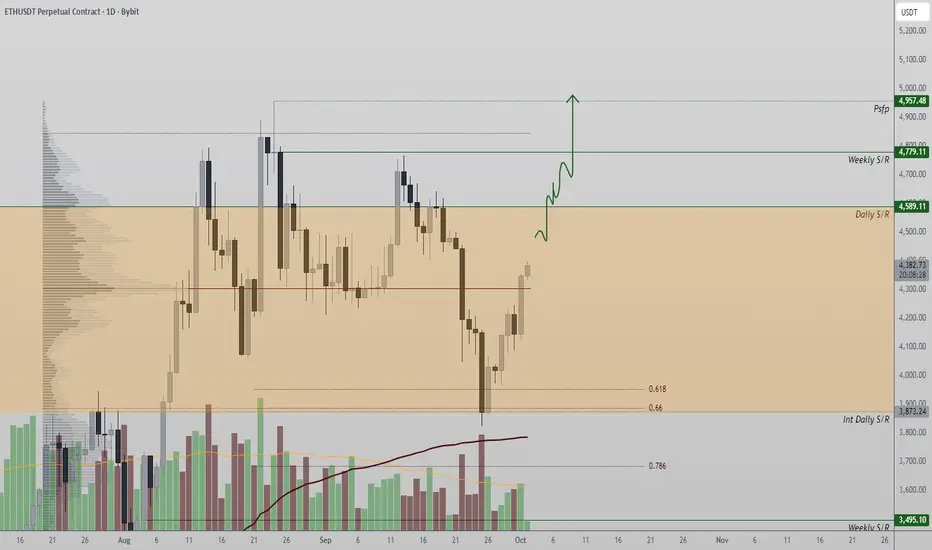
Ethereum (ETH) – Bounce From $3,800 Reclaims Daily SupportEthereum has bounced strongly from $3,800, a level backed by the 0.618 Fibonacci and VWAP
ETH’s correction into $3,800 found immediate buyer interest, marked by an engulfing candle that confirmed market strength. Despite a lack of immediate follow-through, the setup has reinforced confidence in the bullish trend.
Key Technical Points:
- Bounce from $3,800 confluence zone (Fibonacci + VWAP).
- Bullish engulfing candle reinforced strength at support.
- Daily support reclaimed, opening path toward $4,950.
The $3,800 region served as a critical pivot for Ethereum. Price respected this zone and rebounded with strong momentum, confirmed by a bullish engulfing close. The reclaim of daily support marks a structural improvement, creating conditions for continuation.
Volume and follow-through remain key. Sustained buying pressure above current levels would confirm the bullish bias and open the door to higher targets. Failure to hold daily support would weaken sentiment and expose ETH to another corrective move.
What to Expect in the Coming Price Action:
As long as ETH trades above daily support, a rally toward $4,950 is the likely scenario. Losing this level would reduce bullish confidence and reopen downside risk.

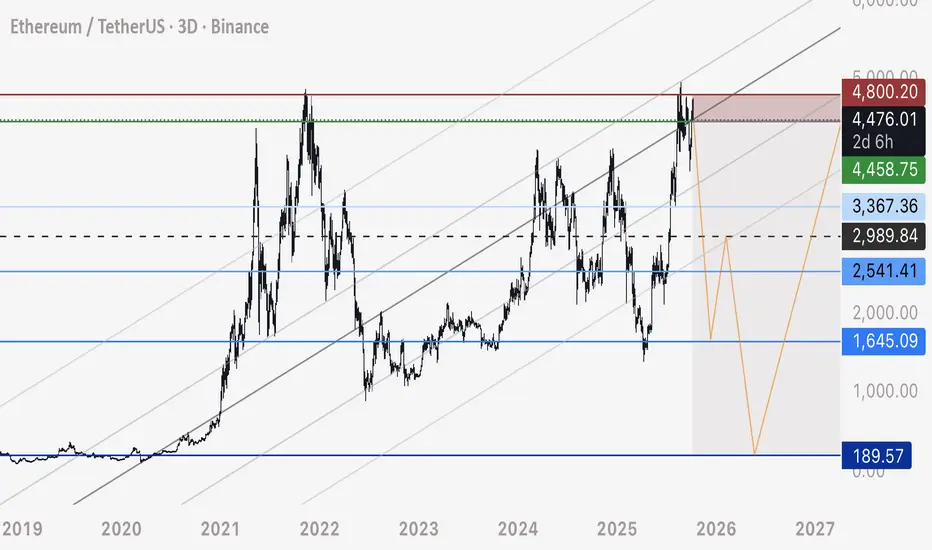
ETH UPDATE - Return to Entry Level, Short Trade InitiatedIn similar fashion to the Bitcoin trade today, here is details on my ETH Short Flash Crash idea.
For detailed information and explanation, please see my linked related posts made today.
Entry / Risk Management:
Entry - 4,460 to 4,480
Stop Loss - 4,800
Take Profits:
1) 3,400 - 20-50% Closure
2) 2,550 - 20% Closure
3) 1,650 - 40-60% Closure
4) 200 - 100% Closure
ETH may create a 3 wave corrective move - and I will be hedging with a long position from 1,600 to 3,000 - timed entry with Bitcoin hitting 35,000
I will buy SPOT ETH only at the range of 200-500
Yours truly,
- DD
$ETH Technical Structure and Market Context
ETH is reacting within the 4 580 – 4 620 USDT supply zone, acting as a minor distribution area. The strong upward move lost momentum as the price faced rejection with long wicks around this region — a sign of profit-taking from short-term buyers and potential entry from sellers waiting for confirmation of a pullback.
If ETH fails to close decisively above 4 620, a short-term retracement toward the 4 550 validation level is likely. Failure to hold this level could trigger a deeper correction toward the 4 470 – 4 480 demand zone before finding new liquidity.
Momentum and Volume Insights
The previous rally was driven by a strong impulse volume, but recent candles show declining buying activity and growing selling pressure, signaling a shift in market control from bulls to short-term distributors. This typically occurs as institutional players execute liquidity grabs at premium zones.
Sustained selling volume could push the price to test 4 470 as the next major support level.
Institutional Outlook
From an institutional view, this region serves more as a liquidity distribution zone than an accumulation area. Funds are likely waiting for clear reaction signals around 4 550 – 4 470 before re-entering positions. As long as price remains below 4 620, the short-term bias leans toward a correction. A confirmed break above this threshold, however, could extend the bullish run toward 4 680 – 4 700 USDT.

Daily ETH Signal: Sell Now , target 4000ETH is currently showing signs of strength as it tests the key resistance level around 4150.
the price retest the level
My Personal Short Setup
Entry : Sell Now from current Price 4153
can wait for Price 4180
🎯 Target 1: 4059
🎯 Target 2: 3961
❌ Stop-loss: 4250
👍 Don’t forget to boost this trading idea if you found it helpful,
and follow me for more daily crypto insights and trade signals.
⚠️ Please note:
This is not financial advice – I’m only sharing my personal trades.
Always do your own research before taking action.
Best of luck 🌹

#ETHUSDT 2H ChartPrice moved up leaving a 2h demand zone at $4,150 as well as an imbalance at $4,250. MACD is showing some bullish weakness, RSI is bought and EMAs are turning bullish. Price is expected to reach the 6h supply at $4,450 before potentially retracing again.

Global Market Participants: Players Shaping the World Economy1. Understanding Global Market Participants
A market participant refers to any individual, institution, or entity that engages in buying, selling, or investing in financial instruments such as stocks, bonds, currencies, derivatives, or commodities. Their participation drives market activity, facilitates capital allocation, and ensures continuous price formation through demand and supply.
Global market participants can broadly be divided into institutional participants and non-institutional (retail) participants. Institutional participants dominate the market due to their large capital base and sophisticated strategies, while retail participants add diversity and depth.
2. Categories of Global Market Participants
a) Central Banks
Central banks are the most influential entities in the financial world. They control a nation's monetary policy, manage foreign exchange reserves, and stabilize the currency and financial system. Examples include the U.S. Federal Reserve, European Central Bank (ECB), Bank of Japan (BoJ), and Reserve Bank of India (RBI).
Key functions:
Setting benchmark interest rates.
Controlling money supply to influence inflation and growth.
Managing exchange rate stability.
Acting as a lender of last resort during crises.
Regulating the banking sector.
Central banks’ decisions can cause global ripple effects. For instance, a rate hike by the U.S. Fed can strengthen the U.S. dollar, attract global capital inflows, and pressure emerging market currencies.
b) Commercial Banks
Commercial banks are vital intermediaries between savers and borrowers. They accept deposits, provide loans, and participate actively in money markets, foreign exchange markets, and credit markets.
Their roles include:
Facilitating trade finance and foreign exchange transactions.
Managing corporate treasury operations.
Participating in interbank lending.
Investing in sovereign bonds and other assets.
Commercial banks also engage in proprietary trading and market-making, providing liquidity to the market.
c) Investment Banks
Investment banks specialize in capital market operations, helping companies raise funds through IPOs, bond issuances, or private placements. They also provide advisory services for mergers and acquisitions (M&A), portfolio management, and structured finance.
Major global players like Goldman Sachs, Morgan Stanley, and J.P. Morgan play crucial roles in shaping global capital flows.
Core functions:
Underwriting securities.
Advising on mergers and acquisitions.
Asset securitization.
Providing derivatives and risk management solutions.
Investment banks are considered the "architects" of global finance, linking capital seekers and investors across continents.
d) Institutional Investors
Institutional investors are large organizations that invest on behalf of clients or members. They include mutual funds, pension funds, insurance companies, and sovereign wealth funds.
Examples:
BlackRock and Vanguard (mutual funds)
CalPERS (pension fund)
Norwegian Sovereign Wealth Fund
Allianz and AIA Group (insurance firms)
Importance:
They manage trillions of dollars, often determining global market trends.
They are long-term investors, influencing corporate governance.
Their actions impact asset allocation, market liquidity, and volatility.
Institutional investors’ investment decisions are data-driven, often guided by macroeconomic conditions, risk models, and diversification strategies.
e) Hedge Funds
Hedge funds are privately managed investment vehicles that use sophisticated strategies to generate high returns. They often employ leverage, short selling, arbitrage, and derivatives trading to exploit market inefficiencies.
Examples: Bridgewater Associates, Renaissance Technologies, and Citadel.
Their significance:
Hedge funds enhance market efficiency by arbitraging mispriced assets.
They take contrarian or speculative positions.
Their rapid trading strategies can amplify market volatility, especially in times of stress.
Hedge funds are major players in currency, commodity, and derivatives markets, frequently setting trends that influence other investors.
f) Corporations and Multinational Companies
Large corporations are key participants, especially in foreign exchange and commodity markets. They engage in international trade, requiring them to manage currency exposure and input cost fluctuations.
For example:
A U.S.-based company exporting to Europe may hedge against a weakening euro.
An airline company may hedge fuel costs using futures contracts.
Corporations also issue bonds or equities to raise capital, becoming integral to capital market operations. Their strategic financial management contributes to overall market stability and liquidity.
g) Sovereign Wealth Funds (SWFs)
SWFs are state-owned investment funds that invest surplus revenues (often from oil exports or trade surpluses) into global assets like stocks, bonds, infrastructure, and real estate.
Examples:
Norway’s Government Pension Fund Global
Abu Dhabi Investment Authority
China Investment Corporation
Role in markets:
Provide long-term, stable capital inflows.
Invest counter-cyclically during market downturns.
Promote cross-border investments and global diversification.
SWFs are crucial in stabilizing markets, especially during economic downturns, as their investment horizon spans decades.
h) Retail Investors
Retail investors — individual participants — are the foundation of market democratization. They invest through stock exchanges, mutual funds, ETFs, and online trading platforms.
Characteristics:
Smaller investment size.
Motivated by wealth creation, savings, or speculation.
Increasingly active through mobile trading apps and social trading platforms.
Retail investors have gained immense power in recent years, driven by digitalization and financial literacy. Events like the GameStop short squeeze (2021) demonstrated how retail participation can disrupt institutional dominance.
i) Brokers and Market Makers
Brokers facilitate transactions between buyers and sellers, while market makers continuously quote buy (bid) and sell (ask) prices to provide liquidity.
Roles:
Ensuring price discovery and efficient order execution.
Offering leverage and margin trading to clients.
Acting as intermediaries for foreign exchange and derivatives trading.
With algorithmic trading, many market-making activities are now automated through high-frequency trading (HFT) systems.
j) Regulatory Bodies and Exchanges
Although not direct investors, regulators and exchanges are crucial participants ensuring market integrity, transparency, and stability.
Examples:
U.S. SEC (Securities and Exchange Commission)
FCA (UK)
SEBI (India)
Financial exchanges: NYSE, NASDAQ, LSE, NSE, and CME.
Regulators safeguard investor interests, while exchanges serve as platforms for price discovery, trading, and clearing.
3. The Interconnectedness of Global Market Participants
Modern financial markets are highly interconnected. A decision by one participant — such as the Federal Reserve’s rate change — can ripple through global markets, influencing bond yields, equity valuations, and currency rates worldwide.
For example:
Central banks influence the cost of capital.
Institutional investors allocate funds globally, affecting capital flows.
Corporations react by adjusting hedging or investment strategies.
Retail investors respond through short-term trading or portfolio rebalancing.
This web of interactions defines the global financial ecosystem, where every participant indirectly shapes the behavior of others.
4. Technological Evolution and Market Participation
Technology has dramatically reshaped how participants interact. The rise of algorithmic trading, blockchain, AI analytics, and fintech platforms has made markets more efficient but also more complex.
Key transformations:
Automation: AI-based trading systems execute millions of trades per second.
Accessibility: Retail investors can trade global markets via mobile apps.
Transparency: Blockchain enables auditable and secure transactions.
Data-driven decisions: Big data helps institutions forecast market trends.
These innovations have lowered entry barriers but also increased systemic risk due to automation and cyber vulnerabilities.
5. The Role of Market Participants During Crises
During crises like the 2008 Global Financial Crisis or COVID-19 pandemic, the coordination between participants becomes critical.
Central banks injected liquidity and cut rates.
Governments implemented fiscal stimulus.
Institutional investors rebalanced portfolios toward safer assets.
Retail investors used market dips as buying opportunities.
Such coordinated yet diverse actions reflect how the global market’s resilience depends on its participants’ adaptability.
6. Challenges and Risks for Market Participants
Despite advances, participants face persistent challenges:
Volatility and uncertainty: Driven by geopolitical events and rate changes.
Currency fluctuations: Affect cross-border investments and trade.
Regulatory tightening: Especially after financial crises.
Technological risks: Cyberattacks and algorithmic malfunctions.
Liquidity risks: Especially during sudden market stress.
Participants must balance risk and reward using advanced hedging, diversification, and compliance strategies.
7. The Future of Global Market Participation
The next decade will redefine global participation patterns through:
Sustainable investing (ESG): Institutions prioritizing environmental and social factors.
Decentralized finance (DeFi): Blockchain enabling peer-to-peer trading.
Cross-border digital assets: Cryptocurrencies becoming mainstream.
AI-driven trading ecosystems: Enhancing efficiency but raising ethical concerns.
The blend of traditional and digital participants will create a hybrid global market that is more inclusive, transparent, and data-centric.
8. Conclusion
Global market participants are the lifeblood of the international financial system. Each plays a distinctive yet interconnected role in maintaining liquidity, enabling capital formation, and ensuring efficient price discovery. From central banks that dictate monetary policy to individual traders executing positions on mobile apps, every participant contributes to the constant pulse of global finance.
As globalization deepens and technology evolves, the diversity and complexity of market participants will continue to expand. Understanding their functions, interrelations, and influences is not just essential for traders or economists — it’s vital for anyone seeking to grasp how modern finance truly operates.
In essence, the story of global markets is the story of its participants — dynamic, interdependent, and constantly evolving in pursuit of opportunity, stability, and growth.

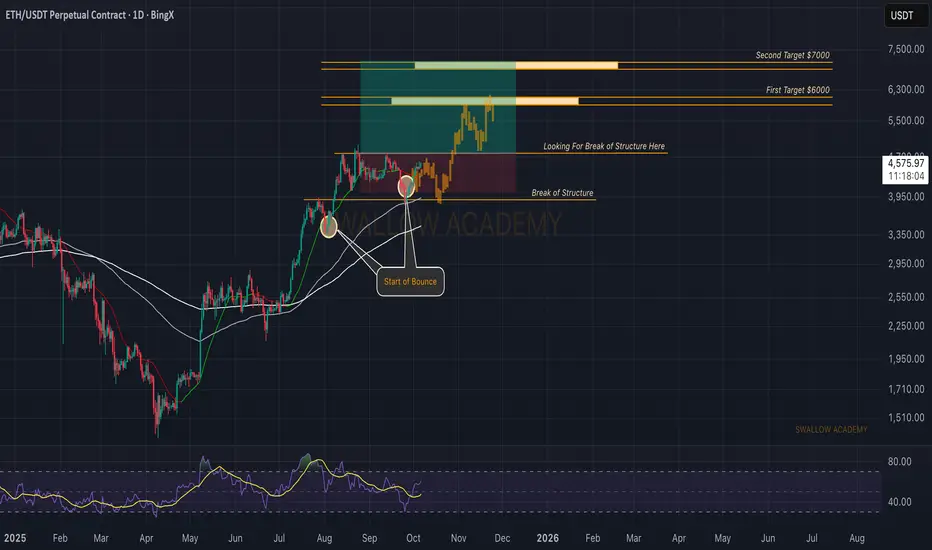
Ethereum (ETH): This is Nothing, We Expect Parabolic Movement!This Bullish cycle can't continue without ETH forming new ATH, and seeing all the manipulation near current ATH we are seeing ismilarities with BTC when it had also been forming new ATH.
Anyways, gameplan remains the same, you want it or not, we are going to see a new ATH very soon.
Swallow Academy
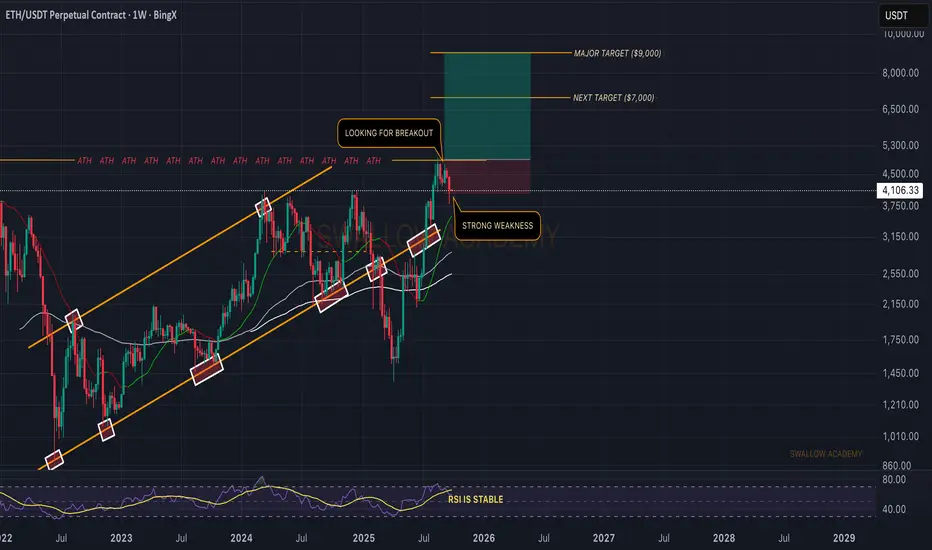
Ethereum (ETH): Good Signs of Recovery | Bullish AF | Breakout?After a fakeout below the middle line of Bollinger Bands, we have had a nice recovery ever since, just like last time when the price dipped below that line.
Now the game plan remains the same; we look for a breakout of the current ATH and once we get the breakout, we are aiming for that new ATH target of ours!
Swallow Academy
#ETH is in heavy resistance, cautiously bullish📊#ETH is in heavy resistance, cautiously bullish ⚠️
🧠From a structural perspective, we've reached overlapping resistance zones, so be wary of a pullback. If we can establish a bearish short structure here, consider taking some short trades.
➡️Aggressive resistance is near 4330, while standard resistance is near 4410.
Let's see 👀
🤜If you like my analysis, please like 💖 and share 💬
BITGET:ETHUSDT.P

Ethereum is reaching a critical resistance level where risk incrEthereum is approaching a decisive zone. A breakout above $4,780 could trigger a brief rally before a correction phase, allowing $4,780 to act as a new support level. From there, the next upside target would be around $5,100. However, if the price fails to hold and breaks below the channel support — specifically under $4,750 — bearish momentum could take over, opening short opportunities toward $4,350 and $4,000.

Support at the 4403.87-4749.30 range is key
Hello, fellow traders!
Follow us to get the latest information quickly.
Have a great day!
-------------------------------------
(ETHUSDT 1D chart)
This period of volatility is expected to last until October 5th.
Accordingly, the key question is whether support can be found around 4403.87 and whether it can rise above 4749.30.
If the price fails to rise,
1st: 3900.73-4107.80
2nd: 3239.06-3438.16
3rd: 2419.83-2706.15
We need to check whether support is found around the 1st-3rd levels above.
-
To break above a key point or range and continue the uptrend,
- The StochRSI indicator must be trending upward. If possible, it's best to avoid entering the overbought zone.
- The On-By-Sign Volume indicator must be trending upward. If possible, it should remain above the High Line.
- The TC (Trend Check) indicator must be trending upward. If possible, it should remain above the 0 level.
You should determine whether the above conditions are met at critical points or ranges and consider a response plan accordingly.
Currently, the StochRSI, OBV, and TC indicators are all showing an upward trend, so we believe the key point of 4403.87 has been broken upward.
However, to sustain this upward trend, the OBV indicator must rise above its High Line, and the StochRSI and TC indicators must maintain their current trend.
Therefore, we can see that support around 4403.87 is crucial.
-
The 4403.87-4749.30 range corresponds to the HA-High ~ DOM (60) range.
If this level is broken upward, a stepwise uptrend is likely, but it is likely to act as resistance.
Therefore, as mentioned earlier, determining whether the conditions for an upward breakout of a critical point or range are met will help you decide how to proceed with your trade.
-
Thank you for reading to the end. I wish you successful trading.
--------------------------------------------------

ETHEREUM New Update (12H)The upward retracement has invalidated the previous analysis.
The best area for a strong price rejection is the QM L zone up to the historical high.
If you’re looking to take a short (sell) position, wait for the price to reach the red-marked zone in the coming days.
For risk management, please don't forget stop loss and capital management
When we reach the first target, save some profit and then change the stop to entry
Comment if you have any questions
Thank You

ETH Top / all time high In my earlier analysis I predicted the 2020 September happening again and it is happening as you are reading this.
From the chart and my analysis I can see ETH topping out around 6.8K this run !
I know, we are all hoping for 12K this BullRun and more but personally I am taking out profits around 6K slowly until the top hits and see a clear reversal.

DeGRAM | ETHUSD is preparing to refresh ATH📊 Technical Analysis
● ETH/USD is trading within a broad ascending channel, recently breaking above the consolidation pattern that formed from August to September. The price has reclaimed the mid-channel and is approaching the key $4800 resistance.
● Sustained momentum above $4800 would validate a bullish continuation toward the $5500 upper boundary, supported by the ascending support line that has held since early 2025.
💡 Fundamental Analysis
● Ethereum’s network activity is recovering as institutional demand for ETH staking grows and Layer-2 adoption increases, reinforcing the bullish mid-term outlook.
✨ Summary
● Breakout above $4800 opens the path to $5500. Channel structure and improving fundamentals favor continued upside momentum.
-------------------
Share your opinion in the comments and support the idea with a like. Thanks for your support!

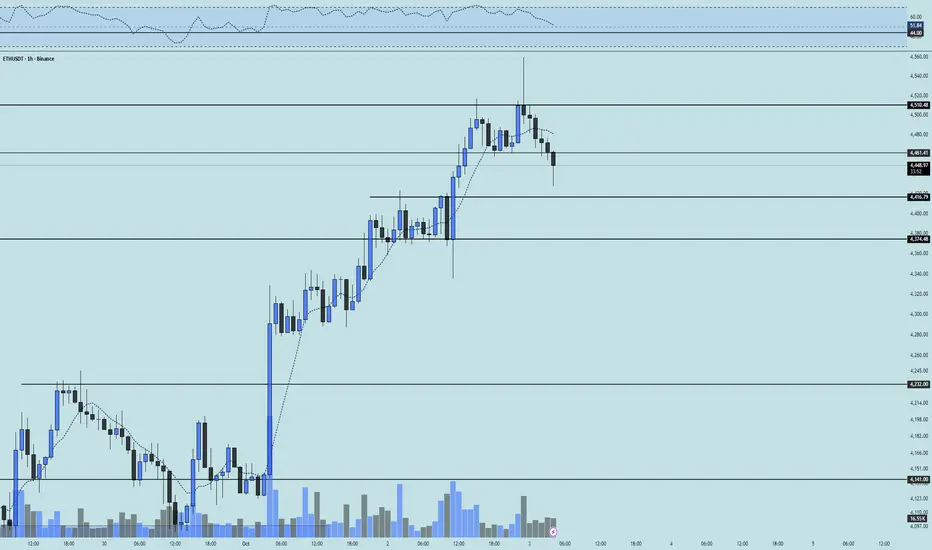
ETH 1H Analysis - Key Triggers Ahead | Day 30❄️ Welcome to the cryptos winter , I hope you’ve started your day well.
⏰ We’re analyzing ETH on the 1-Hour timeframe .
👀 On the 1-hour timeframe for Ethereum, we can see that after reaching its resistance area at $4510, it reversed from that zone and moved downward. At the same time, Ethereum had support at $4461; if this support breaks, it could enter a healthy correction and head toward its marked support levels, forming a new structure afterwards. At that point, we could consider entering an Ethereum position. However, since breaking the level highlighted in previous analyses, Ethereum has already gained 11% up to now.
🧮 Looking at the RSI oscillator, we see that for roughly a day it stayed above the 50 area up to the overbuy boundary near 70. The 70 zone then acted as a static resistance, preventing Ethereum from entering its overbought state. As a result, selling pressure started, and price is now heading toward its swing support around 44.
🕯 The volume, count, and size of buy candles during the recent upward leg were strongly increasing, but not as strong compared to Bitcoin, since Bitcoin dominance didn’t drop significantly. Consequently, now we see sell candles increasing after hitting the 4510 resistance, completing a pullback from its bullish leg.
💸 Looking at the BINANCE:ETHBTC trading pair, we see that it moved upward along with ETH/USDT, but the percentage move was weaker than the tether pair. Whale interest in this pair is currently low, and it may not hold strong weight for them, especially since Bitcoin dominance didn’t fall heavily in this phase. The next trigger level for a breakout and rally in ETH/BTC is around 0.03753; if that zone breaks, Ethereum’s relative value could increase significantly.
🧠 For an Ethereum position, I think we should wait until a new structure forms, with fresh support and resistance zones created by whales. Then, after a breakout of that new structure, we could enter a trade. Another reason I don’t have an immediate scenario for Ethereum is that it has already rallied 11% and is now within a corrective phase.
❤️ Disclaimer : This analysis is purely based on my personal opinion and I only trade if the stated triggers are activated .
Ethereum $ETH crypto trade idea using the weekly demand levelThere is an Ethereum CRYPTOCAP:ETH crypto trade idea using the weekly demand at $3,872. This is a very similar crypto swing trade idea I recently shared with BitCoin. Let's see if it wants to rally for a couple of weeks. You can use the smaller timeframes to trade crypto intraday strategies or scalping strategies.


Ethereum (ETH): Waiting For Clarity | Breakout of Current ATHThe game plan for ETH remains the same; we still keep waiting for that clean breakout from the ATH zone and so far last week and the current week show some promising volume, which is leading us closer and closer to the breakout.
So nothing is left but to wait, and once we see that breakout, we are going to get into a good rally!
Swallow Academy
