ETHEREUM LONG POSSIBLE 13RRThe entry is between 0.382% fibonacci retracement level from april 2025 lows to august highs with the value area high from april lows as well and anchored vwap from june 22th, 0.618% and 0.651% fibonacci retracement levels from july 12th to aug highs in confluence with daily level and daily/weekly naked point of control alongside with the point of control from july 18th to august highs.
Entry: $3,660.76
Stop Loss: $3,526
Take Profit: $5,415
ETHUSDT.3S trade ideas

Possible BUY on ETHUSDTWe finally gotten our 3rd Touch on the Main Bullish Trendline.
We await the hopeful breakout of the Bearish Counter Trendline.

Eth short updateEth moved nicely you can take partial profit here and move your sl to secure your trade 😉
Enjoy gains

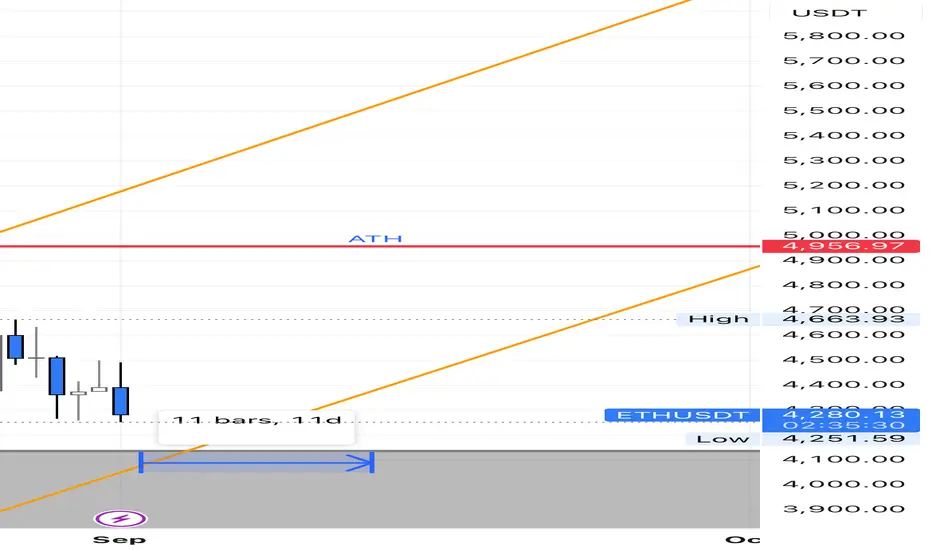
Is ETH on its way to a new ATH? ETH not long ago made a new ATH right at the top of the rising channel before stating to head back down again. Price is now getting close to hitting a horizontal weakly resistance level, and also the support level in the rising channel. I think in around the next week or so price of ETH will go down to where the horizontal resistance level and the support of the channel both intersect before making a new ATH.
Possible support level: $4,150-$4,050
Possible ATH amount: $5,500-$5,600 or more
ETH/USDT (4H) 1. Trend
• The price is in the downward channel (designated orange lines).
• The last candle tests the lower restriction of the channel → Possible reflections or breaking down.
2. Horizers of support and resistance
• resistance (green lines):
• 4,440 USDT
• 4,382 USDT
• Support (red lines):
• 4,268 USDT (currently tested)
• 4,247 USDT
• 4,176 USDT
• 4 090 USDT (stronger support)
If 4,268 is pierced and maintained below, a further exit can be around 4 176–4 090.
3. RSI (Relative Strength Index)
• Currently RSI oscillates below 50 → Bear advantage.
• There is still a strong sale signal (<30), so theoretically there is still a space to decline.
4. Chop (Choppiness Index)
• The indicator shows a fairly "jagged" market → no strong trend, but from the current context of more bear pressure.
⸻
📊 Scenarios:
• Bull (reflection): If the price stays above 4 268 and reflects from the bottom line of the channel → possible traffic towards 4 382 and 4 440.
• Bear (continuation of declines): closing the candle 4h below 4,268 → a signal for further drop to 4 176 and even 4 090.

How to Read Japanese Candles ProperlyWhen traders first look at a chart, they often see what looks like a chaotic mix of red and green bars with shadows. These are Japanese candlesticks — the main language of financial markets. But for many, they remain a mystery: what does a long wick mean? Why does one candle look strong while another looks weak? How can you find structure in this chaos?
In reality, candles are not just colored shapes. Each one represents a small battle between buyers and sellers. The body shows where price opened and closed, while the wicks mark the extremes of that session. A green candle reflects bullish control, a red one shows bearish dominance.
The details matter most. A long upper wick signals that buyers tried to push higher but sellers pushed back. A long lower wick means the opposite — heavy selling pressure was absorbed, and buyers regained control. A doji with small body and long wicks highlights indecision and often warns of a possible shift.
Single candles rarely tell the whole story; combinations and context are far more valuable. A “hammer” at support after a downtrend hints at reversal. A “bullish engulfing” pattern after a series of red candles shows momentum shifting to buyers. On the flip side, a “hanging man” near resistance often warns of correction.
Timeframe also changes the narrative. A candle on the 1-minute chart tells a completely different story than a candle on the daily chart. Aligning short-term candles with higher timeframes helps distinguish noise from meaningful moves.
Experienced traders never rely on candles alone — they integrate them into a system. Candles are confirmed with support and resistance, volume dynamics, divergences, and overall trend structure. Only then does a clear picture of the market emerge.
The key, however, is eliminating emotions. Traders who focus only on candles often act chaotically — exiting too early, holding losing trades too long, or entering impulsively. But when combined with algorithmic analysis and structured trade management, candles become a clear language: they show where the market weakens, where momentum builds, and where it makes sense to take profits.
Japanese candlesticks mirror crowd psychology. Yet only a systematic approach allows traders to truly read their signals. When the market looks chaotic, structure and automation bring control back to the trader, turning emotions into cold calculation.
Possible ETHUSDT Insane BUYThe 3rd Touch on the Bearish Counter Trendline has happened. Now, we wait for the 3rd Touch on the Bullish Main Trendline.

ETH Market Update📊 ETH Market Update
ETH has formed a trading pattern and is now testing the blue support zone 🔵
👉 This is a critical level — a breakout is coming soon, but the question is: up or down?
⚠️ If CRYPTOCAP:ETH breaks below the blue support, sellers could take control and push price lower.
⚡ If CRYPTOCAP:ETH holds support and buyers step in, we could see a bounce and bullish continuation.
👉 Key takeaway: Wait for clear confirmation before entering — the next breakout will define the trend direction.

ETH Short IdeaETH can be shorted from this range with posted entry and SL
Goodluck
Pleasant @ Cryptowhale Madiha Kareem

Weekly trading plan for EthereumA new month and a new week have started, so I’ve updated the monthly levels.
This week, the key level is 4,482 . The moving averages near this level are currently acting as resistance, so only after breaking it can we expect further growth toward the ATH. If the price fails to break above the weekly pivot point, the target will be 4,148 .
I explained everything in more detail in the video idea.

ETH Swing Long IdeaETH Swing Long Idea
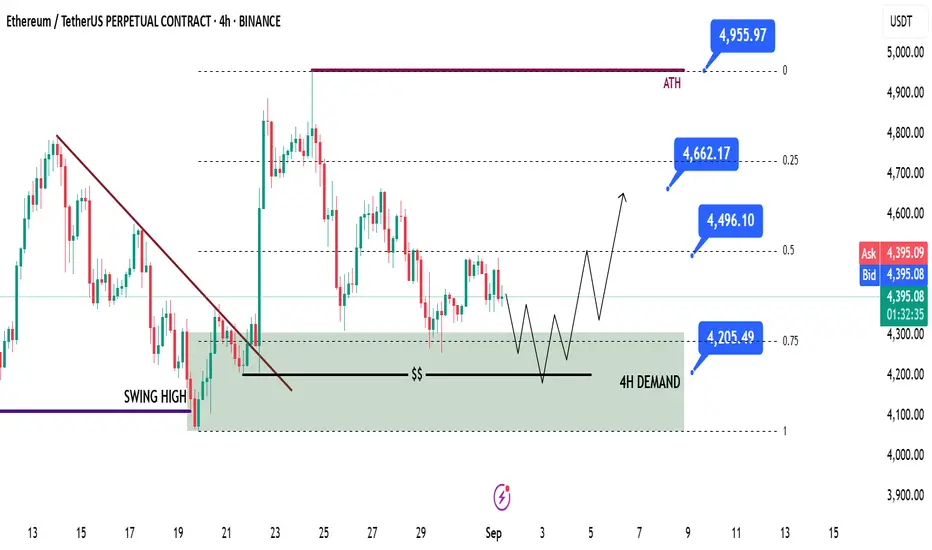
📊 Market Sentiment
Overall sentiment remains bullish, supported by expectations of a 0.25% rate cut in the upcoming FOMC meeting. A weakening USD and improving global risk appetite are creating favorable conditions for further upside in crypto assets.
📈 Technical Analysis
Price tapped into the prior swing high and rejected from that level.
This move created a 4H Demand Zone, which I expect to hold.
Additionally, price reacted from the 0.75 range maximum discount zone and is currently bouncing.
📌 Game Plan
I will be looking for price to run liquidity at $4205 before a potential expansion higher.
This level also aligns with the maximum range discount zone.
🎯 Setup Trigger
I will wait for a 4H Break of Structure (BOS) before entering a trade, with LTF confirmation for precision.
📋 Trade Management
Stoploss: 4H swing low confirming the BOS
Targets:
• TP1: $4500
• TP2: $4650
• TP3: $5000 (All-Time Highs)
💬 Like, follow, and comment if you find this setup valuable!
⚠️ Disclaimer: This content is for informational and educational purposes only and does not constitute financial, investment, or trading advice. Always do your own research before making any financial decisions.
Ehtereum next all time high could be highBINANCE:ETHUSDT Ethereum price updated its all-time high to $4950, followed by a swift correction to $4,270, and now technical indicators suggest an upcoming bullish rally to $6,500.
Details here:
www.cointrust.com

ETH Warrning !!!BINANCE:ETHUSDT The Ethereum is forming an expanding triangle + stochastic divergance.
Best wishes to you all
Markets Titan

Sep1, ETHUSDT Daily Analysis
Intro
For the first time in almost two months, Ethereum has broken below its ascending trendline. In addition, a flat top structure is clearly visible on the 4H chart. These signals make me less bullish on Ethereum compared to before.
That said, there’s still no confirmation of a full trend reversal yet. However, I’ll be more cautious about opening long positions on ETH for now. The key level I’m watching is 4,078.56 — a breakdown below this level could change my long-term outlook on Ethereum and provide a potential short trigger.
⏳ 1H Outlook
On the 1H timeframe, the first setup that caught my attention is a triangle pattern, which has recently broken to the upside. A pullback to the breakout area has also occurred. If price breaks above 4,483.86 after this pullback, it could present a good long opportunity.
Still, I don’t plan to hold this long for the mid/long term — I will take profits at the nearest resistance levels. I’ll keep this approach until the upcoming U.S. unemployment data and other economic news set the broader market direction this week.
📉 Short-side View
At the moment, I don’t see a clear short trigger on Ethereum, nor do I have a strong interest in taking short positions right now.
From a broader perspective, Ethereum may be forming a large range (box) between 4,065.50 and 4,816.84 . Currently, the price sits roughly in the middle of this range, while potential short triggers are much closer to the bottom boundary of the box.


Ethereum (ETH): Still Looks Bullish | Waiting For Q4ETH has already confirmed a Break of Structure (BOS), and as long as we are holding above that zone, the bias stays bullish. Right now, we’re aiming for the next upside targets at $6,000 and $7,000, with momentum still in favor of buyers.
The key thing here is simple: stay above BOS → we push higher. If buyers lose that zone, we’ll reassess, but for now, the upside scenario dominates.
Swallow Academy

DeGRAM | ETHUSD is consolidating📊 Technical Analysis
● ETH/USD is consolidating near $4,450 inside a rising channel, with support anchored at $4,187; holding this zone keeps bullish structure intact.
● The price is coiling below resistance at $5,131, and sustained momentum could trigger an upside breakout targeting $5,500 in the medium term.
💡 Fundamental Analysis
● Recent ETH ETF inflows surpassed $1.2B in August, while Ethereum’s staking ratio hit record highs above 27%, reducing liquid supply and reinforcing long-term bullish pressure.
✨ Summary
Bullish above $4,187; targets $5,131 → $5,500. Invalidation below $4,100.
-------------------
Share your opinion in the comments and support the idea with like. Thanks for your support!

Ethereum (ETH): Targeting $7,000 | $9,000ETH is sitting right below ATH, where pressure is building up heavy from both buyers and sellers. We’ve got RSI holding stable and EMAs aligned, so the structure is clear — only thing left now is that proper breakout.
Once buyers secure this zone, momentum should push us straight into higher levels, with $7K as the first stop and $9K as the major target. Until then, it’s just waiting for that breakout confirmation — after that, the ride continues.
Swallow Academy

ETH/USDTSimilar to BTC, September isn’t historically the strongest month. For further upside, we’d like to see liquidity taken in the 4000–3355 zone.
Long setups only after clear confirmation.

01-09-2025 ETHUSDTThe market is not always chaotic and disorderly, and there is a precise geometric beauty hidden in price fluctuations. The harmonic form long strategy is a powerful tool for accurately identifying potential market reversal points based on the Fibonacci ratio. When the form forms perfectly at the key support level, it often indicates the depletion of bearish momentum and the initiation of bullish trends.
As shown in the figure: 15M Bullish Bat

31-08-2025 ETHUSDTThe market is not always chaotic and disorderly, and there is a precise geometric beauty hidden in price fluctuations. The harmonic form long strategy is a powerful tool for accurately identifying potential market reversal points based on the Fibonacci ratio. When the form forms perfectly at the key support level, it often indicates the depletion of bearish momentum and the initiation of bullish trends.
As shown in the figure: 15M Bearish Crab

Short Term Trade Sell Ethereum at $ 4450 Target Price $ 4350 Very short term trade provided to short Ethereum at $ 4450/- and book profit at around $ 4350/-

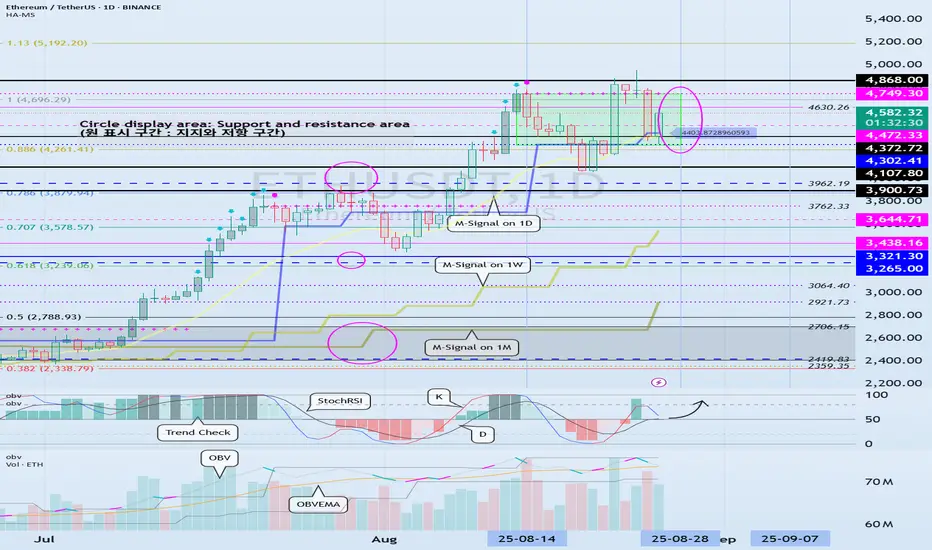
Volatility Period: Around August 28 (August 27-29)
Hello, fellow traders!
Follow us to get the latest information quickly.
Have a great day!
-------------------------------------
(ETHUSDT 1D chart)
It's rising, with support near 4372.72.
However, since the TC (Trend Check) indicator is at 0, it's unclear where the price will bounce.
Therefore, we need to determine whether support is found around 4630.26 or whether the price falls below 4472.33.
This period of volatility is expected to last from August 27th to 29th.
-
To initiate a cascading upward trend, support must be found around 4749.30.
-
Thank you for reading to the end.
I wish you successful trading.
--------------------------------------------------
- This is an explanation of the big picture.
(3-year bull market, 1-year bear market pattern)
I will explain in more detail when the bear market begins.
------------------------------------------------------