ETH/USDTI think Super Wave 3 is complete. I will enter a sell position with this setup for Wave 4. Only with 1% risk.
ETHUSDT.3S trade ideas
eth short?Even though Ethereum is so strong, I would like to see it reach $4,500 again and then go up to $7,000. If not, I am willing to lose a little capital.

Ethereum Analysis – August 24, 2025After the high recorded about 10 days ago, we initially expected a deeper correction.
However, price surprised the market by pushing back toward the highs yesterday and printing a new top.
⚖️ The current decision zones are very tight:
• A daily close above $5,100 would strengthen the bullish outlook and support further upside.
• A daily close below $4,000 would shift momentum in favor of sellers.
📊 For now, it’s best to stay patient and watch how Ethereum reacts over the coming week before taking new positions.

Ethereum/USDT (4H) – Long Trade SetupI have taken a long position on Ethereum as the price has bounced from a strong support zone while also respecting the ascending trendline. The current market structure is forming higher-lows, indicating a potential bullish continuation.
Entry: Around $4,293
Stop Loss: $4,148 (below the previous swing low)
Target: $4,797 (major resistance zone)
Risk-to-Reward Ratio: Approximately 1:3
Additionally, the RSI indicator is recovering from lower levels, showing clear signs of bullish momentum building up. If the price maintains this trajectory, there is strong upside potential.
This trade is based on trendline support, bullish structure, and RSI confirmation.

ETH what is next !This chart displays the weekly price action of Ethereum (ETH), which is currently retesting a key resistance zone around the $4,000 level. This area has acted as a major barrier since 2021, rejecting price multiple times and preventing further upside.
Now, ETH is once again approaching this critical level. If we can get a decisive breakout and a strong weekly close above $4,000, it could signal the beginning of a significant bullish move.
A confirmed breakout could open the door to a rally toward the previous all-time high near $4,860. If momentum continues, the Fibonacci extension points to a long-term target around $13,898 — the 1.618 extension level.
In summary:
👉 A breakout and close above $4,000 could mark the start of a strong bullish trend, with potential targets at $4,860 and $13,898.
Until that breakout is confirmed, though, we remain at a key resistance zone — so it's important to stay cautious.

ETHEREUM TRADERS SHOULD ALLOW FED SET RATE ,RATHER THAN SPECULATING IT.THE CHANCES THEY WILL APPLY TYLOR RULE IS ON THE DESK.
The Taylor Rule is a monetary policy guideline developed by economist John B. Taylor in 1992. It provides a formula to help central banks, like the Federal Reserve, determine the optimal short-term interest rate based on economic conditions.
What is the Taylor Rule?
It links the central bank's target interest rate (the federal funds rate in the U.S.) to two key economic factors:
The difference between actual inflation and the central bank's target inflation rate (usually around 2%).
The output gap—the difference between actual economic output (GDP) and the economy's potential output.
The rule suggests that the central bank should raise interest rates when inflation is above target or when the economy is producing above its potential, to cool down inflation and avoid overheating.
Conversely, it advises lowering interest rates when inflation is below target or the economy is underperforming, to stimulate growth.
Why Does It Matter to the Fed in Rate Decisions?
The Taylor Rule provides a systematic, rules-based framework for setting interest rates, enhancing policy predictability and transparency.
It serves as a benchmark for policymakers to assess whether current rates are appropriate, balancing inflation control and economic growth.
The Fed often considers the Taylor Rule when making decisions but does not follow it mechanically, as real-world factors like financial stability and global economic conditions also influence policy.
During periods of deviation from the rule’s recommendation, the Fed may explain why it chose a different path, reflecting discretion and judgment.
The Taylor Rule helps anchor market expectations by providing a reference point for where interest rates "should" be, reducing uncertainty in financial markets.
AM WAITING ON SELL FROM THE ROOF .
HUNTER WAY.
#ETHEREUM

ETHEREUM PLS ALLOW FED TO DECIDE ON THE NEW RATE ,THE PROBABILTY FOR HIKE IS IN THE picture and incoming economic report will be put into perspective.
the fed will likely apply the Taylor Rule in its monetary policy decision.
The Taylor Rule is a monetary policy guideline developed by economist John B. Taylor in 1992. It provides a formula to help central banks, like the Federal Reserve, determine the optimal short-term interest rate based on economic conditions.
What is the Taylor Rule?
It links the central bank's target interest rate (the federal funds rate in the U.S.) to two key economic factors:
The difference between actual inflation and the central bank's target inflation rate (usually around 2%).
The output gap—the difference between actual economic output (GDP) and the economy's potential output.
The rule suggests that the central bank should raise interest rates when inflation is above target or when the economy is producing above its potential, to cool down inflation and avoid overheating.
Conversely, it advises lowering interest rates when inflation is below target or the economy is underperforming, to stimulate growth.
Why Does It Matter to the Fed in Rate Decisions?
The Taylor Rule provides a systematic, rules-based framework for setting interest rates, enhancing policy predictability and transparency.
It serves as a benchmark for policymakers to assess whether current rates are appropriate, balancing inflation control and economic growth.
The Fed often considers the Taylor Rule when making decisions but does not follow it mechanically, as real-world factors like financial stability and global economic conditions also influence policy.
During periods of deviation from the rule’s recommendation, the Fed may explain why it chose a different path, reflecting discretion and judgment.
The Taylor Rule helps anchor market expectations by providing a reference point for where interest rates "should" be, reducing uncertainty in financial markets.
Basic Taylor Rule Formula
r=p+0.5y+0.5(p−p ∗ )+r ∗
r=nominal federal funds rate (target rate)
p=actual inflation rate
p*=target inflation rate (~2%)
y=output gap (percent difference between actual and potential GDP)
r*=equilibrium real federal funds rate (often assumed to be about 2%)
In simple terms, the Fed should raise or lower rates in response to inflation deviations and output gaps to stabilize the economy.
The Taylor Rule matters because it guides the Fed to pursue a balanced approach—tightening policy when inflation or growth is too high, and easing when the economy slows or inflation falls short—helping to achieve stable prices and sustainable growth.
The Taylor rule also points to a hike
Even when considering the prior data, the Taylor Rule also suggests that the Fed could hike the Federal Funds rate. The Taylor Rule is one of the most reliable tools that the Fed considers for monetary policy action. It's based on the neutral rate, inflation measure, and the resource gap measure.
Since these are not easily measurable variables, the Taylor Rule allows for simulations with different measures. The most common measures are summarized in three scenarios.
Currently, two scenarios put the Federal Funds rate at around 4.25%, which is the bottom range of the current level of the Federal Funds rate, and suggests no cuts or hikes are necessary.
However, Scenario 3 is putting the Federal Funds rate at 5.45%, which suggests that the Fed should hike by around 1% from the current level.
The fact is that the unemployment rate is very low at the full employment level, while inflation has been well above the 2% target for a long time now.
trading is 100% probability.
apply caution at all time
think like a hunter.
#ethereum

ETHEREUMFEDEREAL RESERVE RATE DECISION WILL BE CLEAR VERY SOON .its important to allow them decide from by its FOMC ORGAN .
Soon direction will be clear and our outlook will be more detailed,forward guidance is needed to lock on long tern trades.

Ethereum Ethereum ,am waiting to sell from the top layer supply roof of the ascending trendline line only.
for now am applying my hunters mindset clear wait and see approach.
the sell reward is high on target but buy continuation is possible beyond the ascending trendline acting as dynamic supply roof .
#ethusdt

Ethereum's ATH: What's Next?Ethereum recently hit a new all-time high (ATH), but its upward momentum has met a significant resistance level. Based on this technical signal, there is a possibility that the price could pull back and correct to a support range of approximately $4,121 to $3,936.

Ethereum's ATH: What's Next?Ethereum recently hit a new all-time high (ATH), but its upward momentum has met a significant resistance level. Based on this technical signal, there is a possibility that the price could pull back and correct to a support range of approximately $4,121 to $3,936.

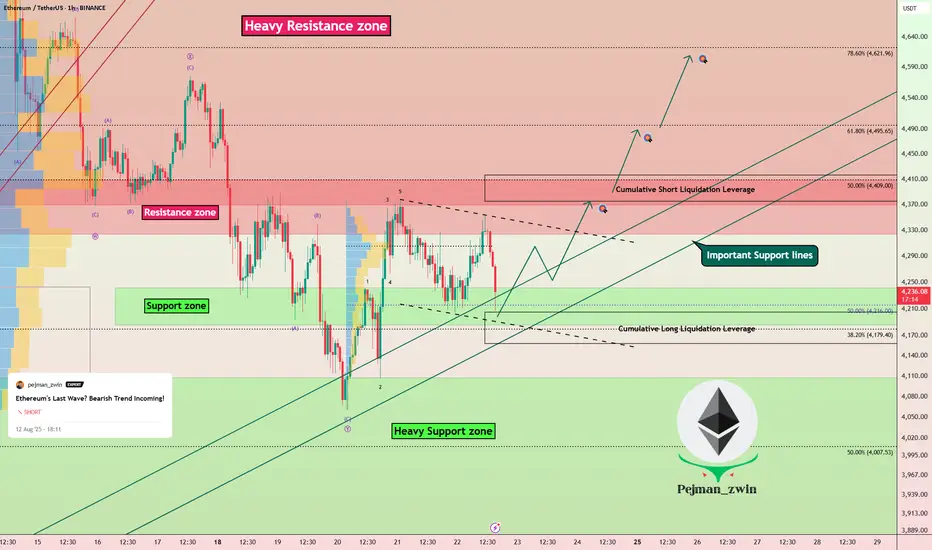
Ethereum Correction Ending? Next Bullish Wave Loading!In the previous idea , I was able to find the Ethereum price top at $4,788 . The question is, has the Ethereum correction begun, or is there still hope for the creation of a new All-Time High(ATH)?
Ethereum ( BINANCE:ETHUSDT ) is currently trading near the Support zone($4,240-$4,186) , Cumulative Long Liquidation Leverage($4,205-$4,158) , and important Support lines .
In terms of Elliott Wave theory , it seems that Ethereum has completed a corrective wave . The corrective wave has a Double Three Correction structure(WXY) . If the Resistance zone($4,410-$4,324) and Cumulative Short Liquidation Leverage($4,416-$4,375) are broken, we can confirm the end of the corrective wave .
I expect Ethereum to start rising from important support lines and rise to at least $4,373 .
Second Target: $4,484
Third Target: $4,607
Stop Loss: $4,097
Note: Today's Fed Chair Powell Speaks can create excitement in financial markets, especially crypto.
Please respect each other's ideas and express them politely if you agree or disagree.
Ethereum Analyze (ETHUSDT), 1-hour time frame.
Be sure to follow the updated ideas.
Do not forget to put a Stop loss for your positions (For every position you want to open).
Please follow your strategy and updates; this is just my Idea, and I will gladly see your ideas in this post.
Please do not forget the ✅' like '✅ button 🙏😊 & Share it with your friends; thanks, and Trade safe.
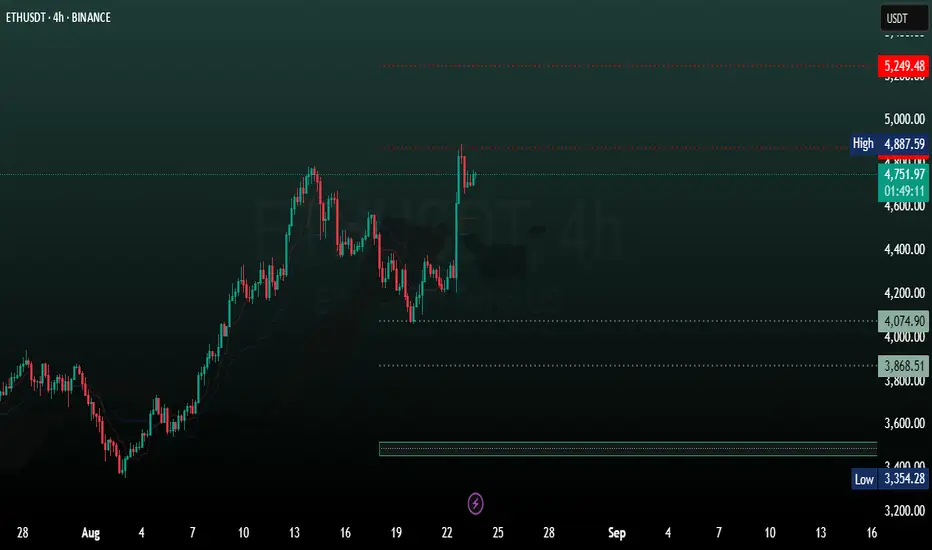
Ethereum 4H AnalysisBased on ichimoku data, the ethereum long-term trend is upward.
we are expecting new ATHs!
Resistence levels:
5249
5773
Support levels:
3500
3118
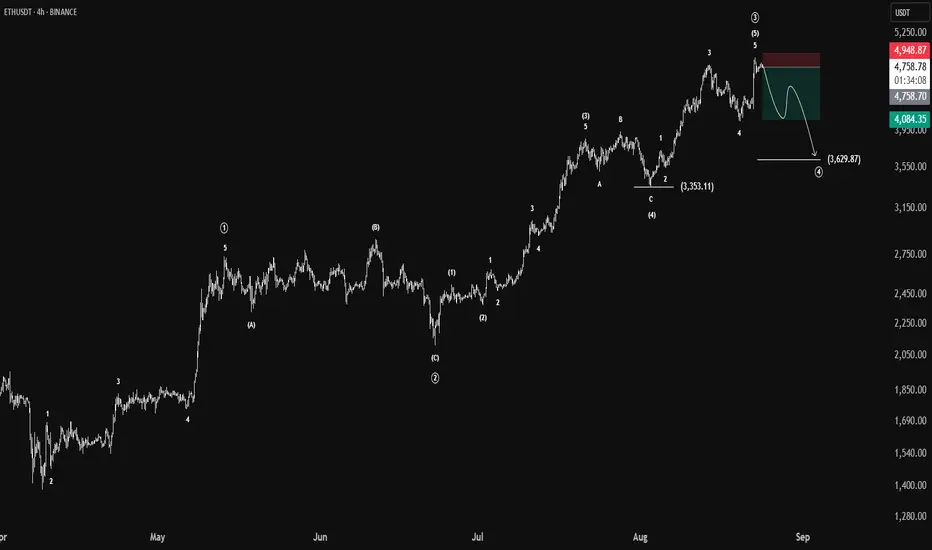
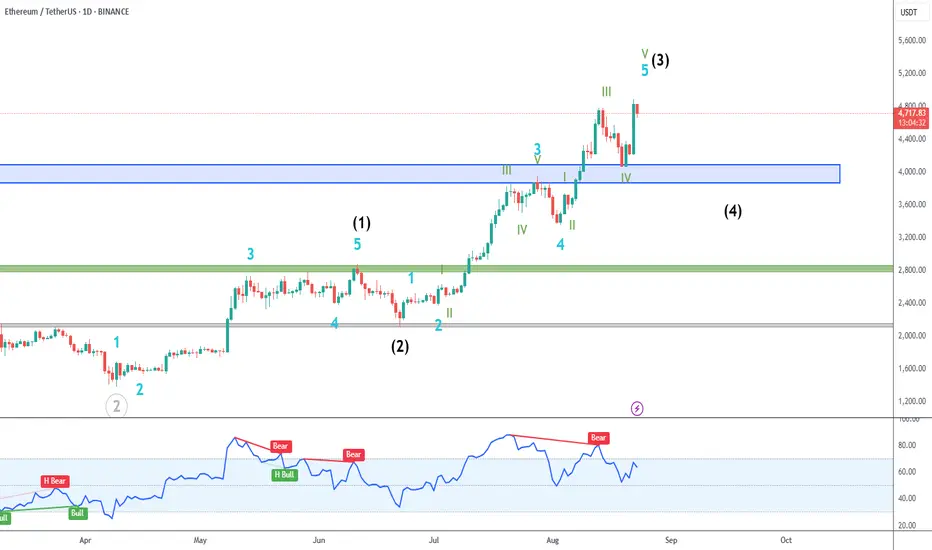
ETH/USDT: Final stages of Wave 3> Wave structure: ETH appears to be completing black wave (3), with signs pointing to an imminent wave (4) corrective move.
> RSI warning: Bearish RSI divergence suggests weakening momentum—typical before a wave (4) pullback.
> Wave (4) target zone: Correction likely into $3,800–$4,000, aligning with previous structure and acting as a potential accumulation zone.
> Strategy: Wait for a pullback into the blue zone to accumulate on weakness, aiming for a breakout toward black wave (5).
ETHUSDT - 20RR - simple setupETHUSDT - 20RR - simple setup, this il be my last trade setup, i will focus on community and analysis
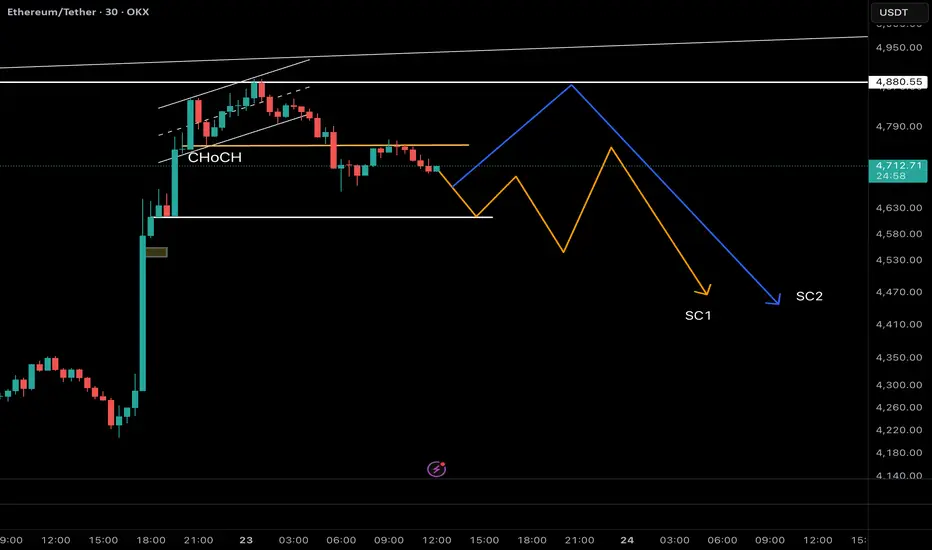
Ethereum Update: CHoCH Confirmed – Waiting for BOS & Wave C! As mentioned in my previous Ethereum analysis, ETH has completed its 5-wave impulsive rally and is currently inside wave B of a corrective ABC structure. Wave B often breaks above the wave ⑤ top to trap liquidity before a sharp wave C sell-off.
📊 Latest Price Action (30m TF):
• ETH has already shown a CHoCH by breaking the first key support at $4,753 and retesting it.
• The next crucial support lies at $4,613. If this level also breaks, it would confirm a BOS (Break of Structure) and strengthen the bearish case.
🔀 Two Possible Scenarios from Here:
1. Price retests the broken $4,753 level as resistance → then resumes the downtrend.
2. A deeper pullback toward $4,845 (acting as a left shoulder liquidity zone) → before the real wave C decline begins.
🎯 Trading Strategy:
• Wait for confirmation of BOS at $4,613.
• Once confirmed, look for bearish entry triggers (CHoCH / MSB) on lower timeframes.
• First targets: $4,100 → $3,800.
• Stop-loss invalidation above the swing high at $4,845 to maintain strict risk control.
⚠️ Remember: patience is key. Don’t get trapped in wave B’s fake breakouts — let the structure confirm wave C.
👉 Like & Follow to stay updated as we track ETH’s potential wave C move step by step!
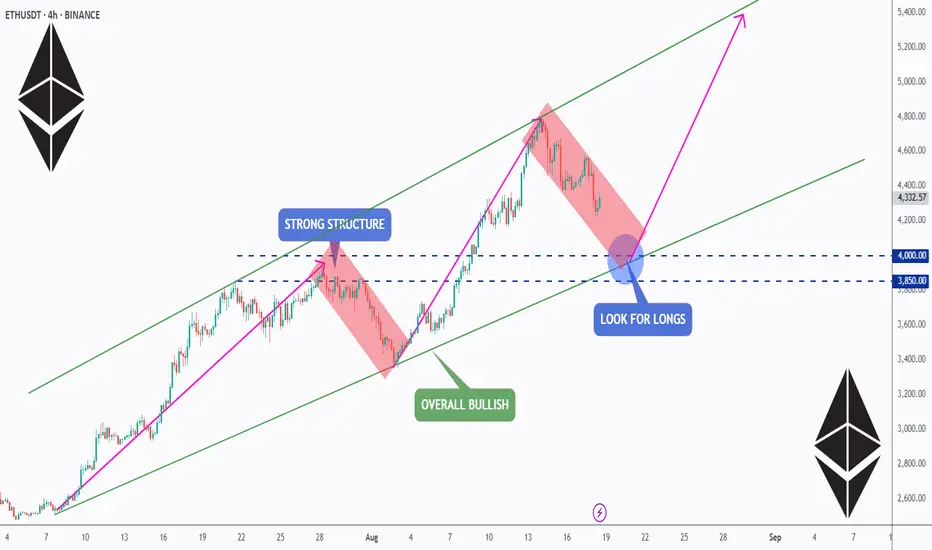
ETH Setup: Retest, Reload & Rally?ETH is pulling back after a strong run , but the bigger picture stays bullish. 📈
The $3,850–$4,000 zone is key — a solid structure + channel support. 🔑
If buyers step in here, we could see the next leg toward $5K and beyond. 🚀
Watching closely… time to retest, reload, and ride the rally? 👀
📚 Always follow your trading plan regarding entry, risk management, and trade management.
Good luck!
All Strategies Are Good; If Managed Properly!
~Richard Nasr
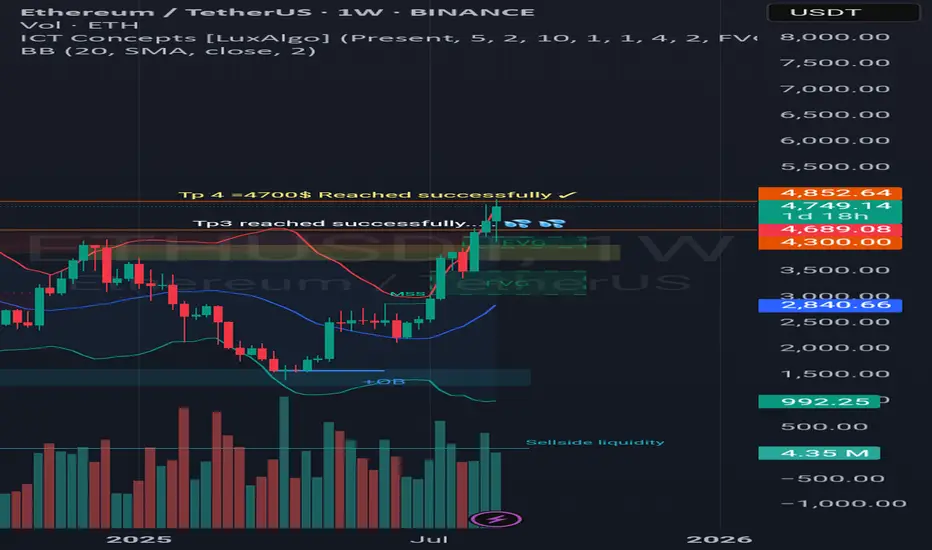
Update of analysis of ETH/USDT Hello sexy friends, ETH very successful filling the tp4 and get to 4700$.
Next TP is over the 10,000$
The goal is coming soon... please wait spring is near ... 💋
ETH 4H👁️This is an untradable zone. Although short positions are possible, it's not advisable to trade bearish pullbacks within an uptrend with strong fundamentals. The 4500 zone seems attractive to me; it's worth monitoring closely to rejoin, gauging mass sentiment and predicting market-makers' moves.

this is how I see $ETH 1D OBV Ethereum 1D OBV break out . How I view the OBV which is a leading indicator. Ethereum to 7k

ETHUSDT - trust your strategy and use risk managment ETHUSDT - trust your strategy and use risk managment , big move are the real deal in trading, be patient
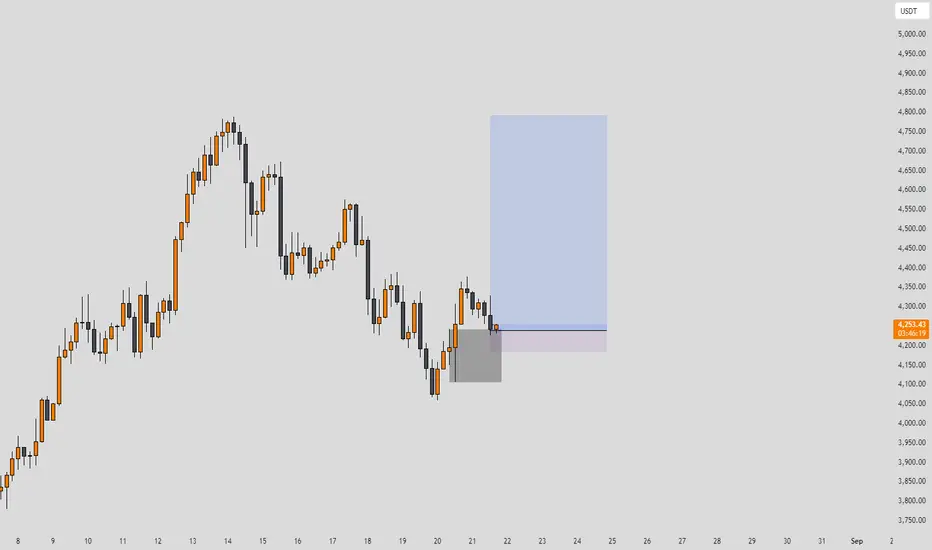
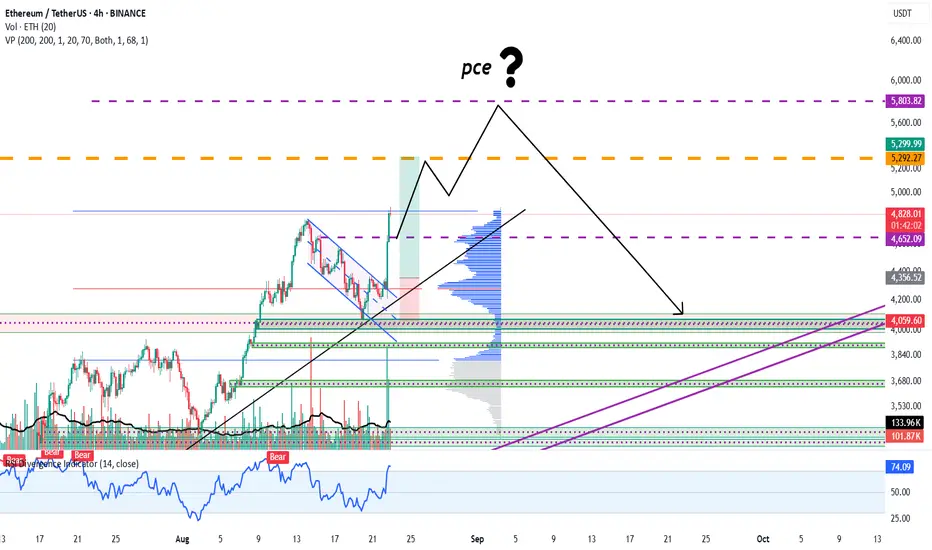
"Ethereum Targeting $5,500 Before Key PCE Data on August 29""Ethereum is likely to reach a new high around $5,500. After that, the market will be waiting for the PCE data on August 29."
Check for support near 4302.41-4372.72
Hello, traders!
Follow us to get the latest updates quickly.
Have a great day!
-------------------------------------
(BTC.D 1M chart)
For an altcoin bull market to begin, the price must either fall below 55.01 and hold or continue its downward trend.
(USDT.D 1M chart)
I believe that USDT dominance must remain below 4.91 or continue its downward trend for the coin market to continue its upward trend.
The maximum decline in 2025 is expected to be around 2.84-3.42.
After that, the coin market is expected to enter a bear market with an upward trend.
------------------------------------
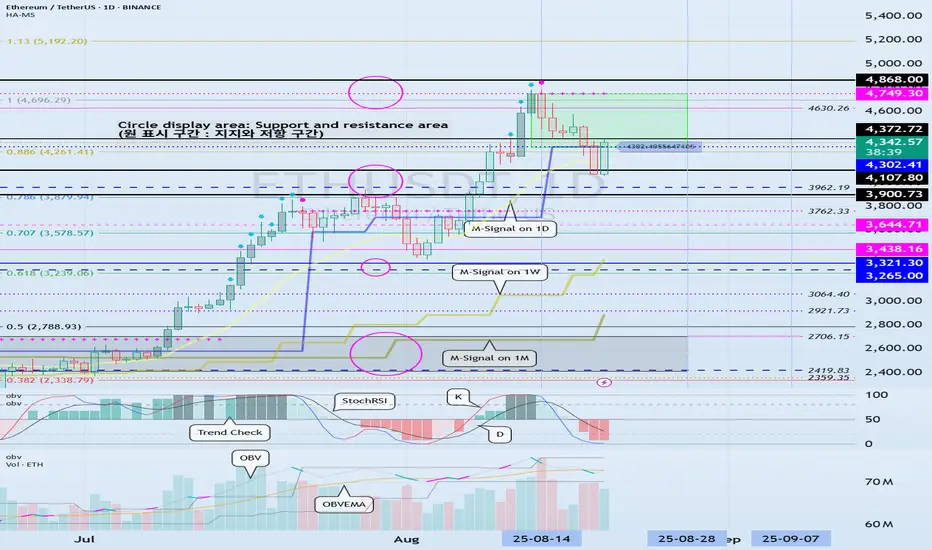
(ETHUSDT 1D chart)
It touched the previous all-time high (ATH) range of 3900.73-4107.80 and is showing an upward trend above 4302.41.
Therefore, we need to check whether it can find support around 4302.41-4372.72.
To continue the step-up trend, it's expected to rise above 4749.30.
-
When a new candlestick is formed, a low trend line is expected to form, consolidating the trend line as shown below.
Therefore, the key question is whether the price can rise along the rising channel after the volatility period around August 28 (August 27-29).
-
The 4302.41-4749.30 range represents a high-boundary zone, requiring a short and quick response when trading.
Therefore, if the price finds support near 4302.41 and rises, it would be wise to develop a trading strategy based on the assumption that the first sell-off will occur around 4749.30.
For the uptrend to continue, rising above 4749.30,
- the StochRSI indicator must remain upward with K > D,
- the OBV must rise above the High Line and remain upward,
- the TC (Trend Check) indicator must remain upward. (Preferably, it should show an upward trend above 0.)
If the above conditions are met, I believe the uptrend is likely to continue.
-
If the price falls below 4302.41,
1st: 3900.73-4107.80
2nd: M-Signal on the 1W chart
We need to check for support near the 1st and 2nd levels above.
-
The basic trading strategy is to buy in the HA-Low ~ DOM (-60) range and sell in the HA-High ~ DOM (60) range.
However, if the price rises from the HA-High to DOM(60) range, it is likely to exhibit a step-like upward trend, while if it falls from the HA-Low to DOM(-60) range, it is likely to exhibit a step-like downward trend.
Therefore, the basic trading strategy should be a segmented trading strategy.
If you purchase a new position because the price appears to be supporting the HA-High to DOM(60) range, you should execute the trade quickly and with short-term responses.
Otherwise, if the price falls below the HA-High indicator, it is likely to decline until it meets the HA-Low or DOM(-60) indicator.
-
Thank you for reading to the end.
I wish you successful trading.
--------------------------------------------------
- This is an explanation of the big picture.
(3-year bull market, 1-year bear market pattern)
I will explain in more detail when the bear market begins.
------------------------------------------------------