Long trade
🔹 Trade Details
Buy-side trade entry: 3,955.30
Profit level: 4,651.28 (+18.19%)
Stop level: 3,871.54 (−1.63%)
R:R: 11.19
Executed during the London to NY AM session on Fri 26th Sept 25 at 9:00 am, coinciding with a 4H FVG and structural shift on the lower time frame.
🔹 Key Technical Observations
Break of structure (BOS): Occurred after reclaiming the EMA 50 (blue) and surpassing prior swing highs.
👉 EMA alignment: The 50 EMA crossed back above the 200 EMA — a medium-term bullish trend confirmation.
👉 Volume: Expansion seen at the demand retest (high conviction buyers stepping in).
👉 FVG zones: Multiple unmitigated Fair Value Gaps remain below current price (4,430–4,480 area), acting as potential re-entry zones if price retraces.
👉 Supply zone: Around 4,691–4,700 (4H), where price is currently reacting, just beneath the larger FVG target zone (~4,570–4,600).
🔹 Market Narrative
This move reflects a classic Wyckoff accumulation to markup transition.
The “Consolidation Identified Phase” signalled the Phase C–D transition, confirmed by:
Higher timeframe spring event and reclaim of range midline.
Volume expansion with bullish displacement candles.
Structural BOS and retest of the neckline.
👉 Price respected the PD Array (Discount Zone) for entry and is now operating above equilibrium.
🔹 Forward Outlook
If price sustains above 4,480–4,500, expect continuation toward the 4,570–4,600 FVG for full target mitigation.
If retracement occurs:
Watch 4,445–4,460 demand zone (and unmitigated FVG) for buyside continuation setups.
Below 4,430 (WMA zone) would invalidate the short-term bullish structure.
ETHUSDT.3S trade ideas

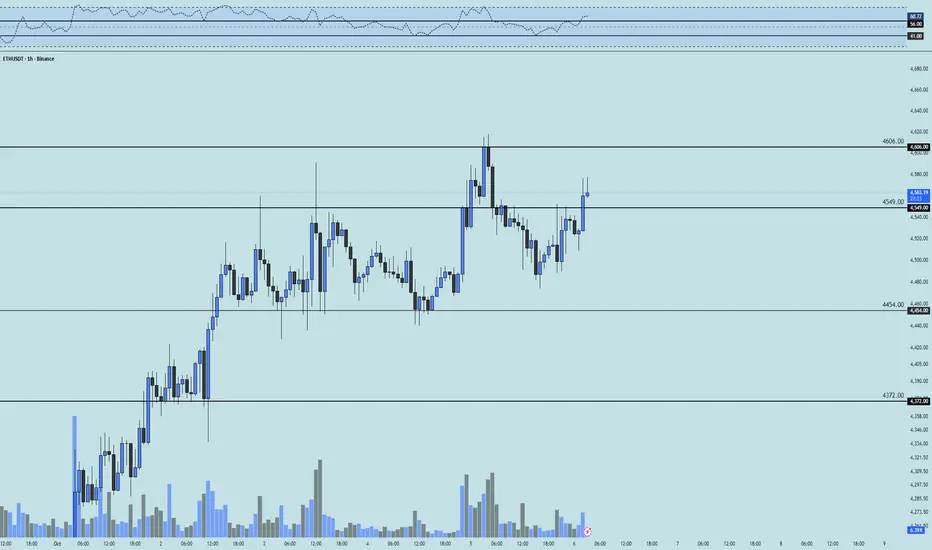
ETH 1H Analysis - Key Triggers Ahead | Day 31☃️ Welcome to the cryptos winter , I hope you’ve started your day well.
⏰ We’re analyzing ETH on the 1-Hour timeframe .
👀 On the 1-hour timeframe, Ethereum recovered after yesterday’s drop, moving toward its support zone, where it consolidated briefly before forming a short-term trigger at $4,549. This level was then broken in a single 1-hour candle, and ETH is now stabilizing above it — confirming the trigger activation. A new resistance has now formed around $4,606, and a breakout above that level would activate another bullish trigger for Ethereum.
🧮 The RSI oscillator currently highlights two key zones for ETH trading — levels 56 and 41. Crossing either of these levels typically increases Ethereum’s volatility. At the moment, the RSI sits near 62, indicating growing long momentum and increasing buying pressure.
🕯 The recent candle structure shows clear bullish volume and upward momentum. After activating the trigger zone, Ethereum is pushing higher with a strong whale-driven candle, targeting upper resistance levels. Yesterday’s drop allowed some profit-taking by whales and filled several sell orders — meaning ETH now has a cleaner path upward compared to previous attempts.
🧠 For ETH positioning, you can either wait for a breakout above $4,606 for confirmation, or enter early at the $4,549 trigger zone if you spot a low-volume indecision candle interacting with the SMA7 line — signaling potential bullish continuation.
❤️ Disclaimer : This analysis is purely based on my personal opinion and I only trade if the stated triggers are activated .
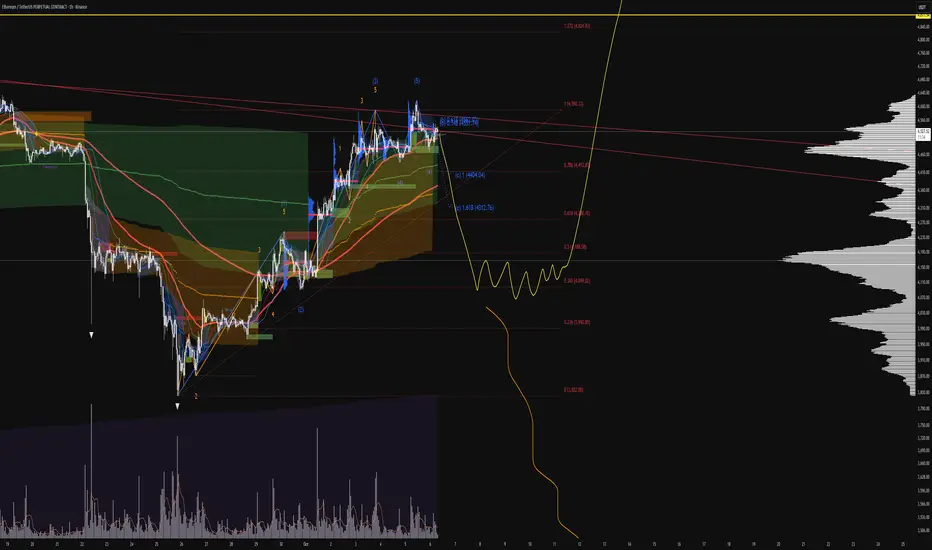
[SeoVereign] ETHUSDT BEARISH Outlook – October, 03 2025The key basis for presenting a bearish perspective in this idea is that the Crab pattern, one of the harmonic patterns, has been fully confirmed.
For clearer verification, I have directly plotted the relevant section on the chart for your reference.
For reference, the Crab pattern is an extended harmonic pattern with high volatility, typically forming point D at the 1.618 level relative to the XA wave, and is characterized by a strong reversal movement thereafter.
Due to these characteristics, it is evaluated as a highly reliable pattern within the Potential Reversal Zone (PRZ).
Accordingly, the average target price is set around 4,135.40 USDT.
Additional briefings will continue to be updated in this idea as the chart develops.

#ETH Potential Bearish Structure📊 #ETH Potential Bearish Structure 📉
🧠From a structural perspective, we've been capped by the blue descending trendline and have retreated after hitting heavy resistance at 4522. There's a chance we could form a bearish head-and-shoulders pattern on the hourly chart.
➡️A break below the neckline or the yellow ascending support line would strengthen the bearish signal.
🤜If you like my analysis, please like 💖 and share 💬
BITGET:ETHUSDT.P

#ETH/USDT LONG CHART ANALIYSIS !!🔹 Ethereum (ETH/USDT) Analysis
Ethereum has shown a strong recovery from the $3,800 support zone, bouncing sharply and now trading above the 50-day moving average (50MA) — a key bullish sign.
You can see from the chart that ETH has broken out of the descending wedge pattern that had been forming for weeks. This breakout, along with the reclaim of the 50MA, indicates a shift in momentum from bearish to bullish.
Additionally, price is currently sitting above the Ichimoku Cloud, which further strengthens the bullish bias. When ETH is trading above both the 50MA and Ichimoku Cloud, it often signals the start of a potential trend continuation move.
Bullish Structure – ETH has consistently made higher lows since hitting $3,800.
MA Confirmation – The move above the 50MA suggests renewed buyer strength.
Ichimoku Cloud Breakout – Indicates improving sentiment and trend reversal.
Volume Support – The recovery was backed by healthy buying volume.
Key Levels to Watch:
Support: $4,270 – $4,300 zone (previous resistance now support)
Resistance: $4,800 – $4,850 zone (next major target area)
Invalidation: Below $4,200 (would weaken bullish momentum)
If ETH holds above $4,270 and consolidates, we could see a continuation toward the $4,800–$5,000 range in the coming sessions.

ETHEREUMETHEREUM ,how the weekly candle closes will give a directional bias on Ethereum BY NEXT WEEK
if the double TOP neckline stays invalidated on weekly CANDLE close, then we will look for buy opportunity only.
the market is buying dont be eager to sell ,but remember that what ever that goes up will surely come down.
#ethusdt #ethereum

Eth RangeMy initial idea was to turn this distribution into a reaccumulation like seen in June. I'm waiting for it to develop, this could take some time.

Ethereum in the Accumulation Phase | Valhalla is NearEthereum is following a fractal pattern with consistent sizes. According to on-chain data, withdrawals of Ethereum from exchanges to cold wallets are currently very high, which itself is a supply shock. This chart indicates that we are in the process of accumulating Ethereum, and in the medium term, Ethereum can easily reach new all-time highs. Wishing you success.

Chart Speaks for itselfBullish divergence at a double bottom. This is important because it is at a very critical zone where multiple times was used as resistance is now support; not shown on the graph but zooming out into higher intervals shows this.

ETH(based on NEo wave)soon eth will start a temporary correction and goes for higher bullish waves.
it is the last chance to buy it.
Stop loss is 3800.
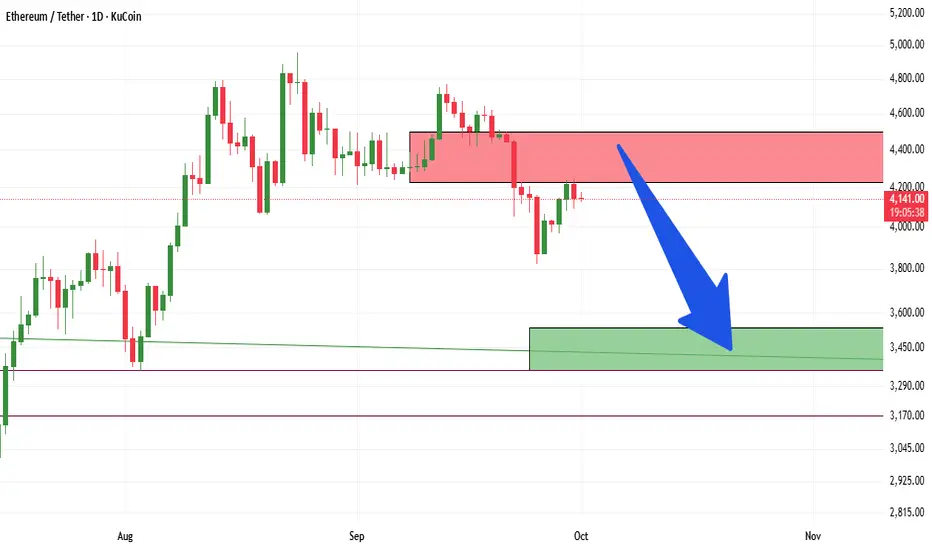
ETH -- THE WOLf Hunts Below 3500ETH is chilling above $4150 right now…
but let’s be honest — a dip below $3500 is loading ⬇️📉
Here’s why:
• 🔴 The red zone = where bulls get trapped.
• 🟢 The green zone = where real support should show up.
• 📊 Bitcoin dominance is rising — classic confirmation that altcoins (yes ETH too 😅) are ready to bleed.
So yeah, don’t act surprised when ETH decides to take a little “vacation” under 3500.
Correction isn’t the end of the world… it’s just the market reminding us who’s boss 🐺😉
ETH/USD on Support! Buy Setup!ETH/USD is testing a strong support. With an Instant Buy entry, we can take a 1:3 trade with low risk.

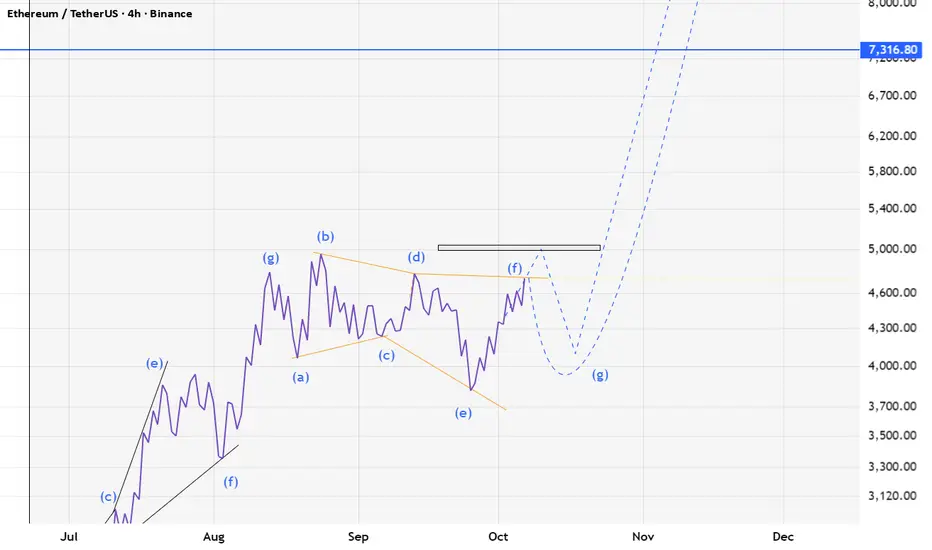
Continuation of the previous idea based on the Harmonious EnergyThe consolidation phase is coming to an end. The market structure is gradually moving into the next stage of the energy cycle, where a new flow direction is forming.
At the moment, I am observing a continuation of the energy movement with a noticeable manifestation of buyer strength. The key focus is on price behaviour near the resistance level — this is where it will become clear whether buyers will be able to maintain control and continue the upward momentum, or whether the market will enter a redistribution phase.
According to the GPE concept, this moment reflects the transition from balance to energy release — when the accumulated potential turns into real movement.
📌 Observation: price reaction to resistance and confirmation of the flow's strength.
💬 If you have any questions or would like to discuss the idea in more detail, I am always open to dialogue.

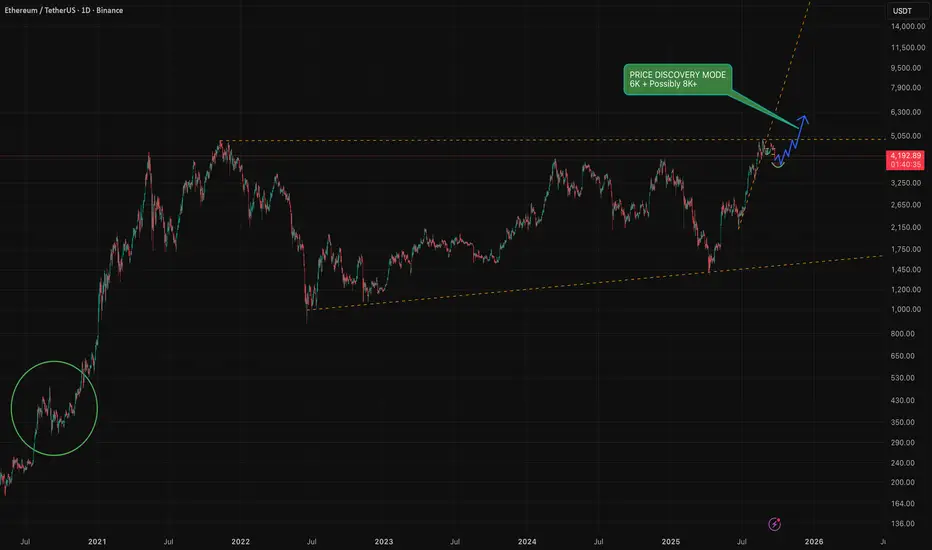
History doesn't repeat but RHYMES ! I highly recommend everyone to have look at September 2020
I personally think that this will be the same scenario where we will have some fake-outs to drive the retails out / liquidate then the price will carry on upwards and go into price discovery mode where we are more likely to see 6K and hopefully more, if the volume and kicks in the ETF's and more retail pump we can see somewhere between 8K to 12K ( Optimistically )
I personally will be taking profits along the way tho and not going to wait for the top as we all know no one can predict the top nor the bottom !
Thank you all for reading my idea and feel free to share yours here in the comments.
To get access to my indicators please join the FREE tg channel, link in my BIO !
ETH 1H Analysis - Key Triggers Ahead | Day 29❄️ Welcome to the cryptos winter , I hope you’ve started your day well.
⏰ We’re analyzing ETH on the 1-Hour timeframe .
👀 On the 1-hour chart , After breaking lower resistance zones, ETH started a strong bullish leg toward higher resistance. It reacted to these levels but moved upward with micro-buyer support. Currently at $4323, a key seller ticker zone—breaking this could push ETH higher. Note: Trend shows some weakness; sell candles are engulfed but smaller. Over 90% of holders are in profit, causing frequent stop-hunts on selling pressure.
🧮 RSI: After moving from near oversold to overbought, RSI is cooling near the 70 level. With increased long volatility, multiple buy positions could form, but rejection here may lead to a correction. Key static resistance is 70; swing support is at 50.
🕯 Volume & Candles: Recent candle size and volume surged as buyers entered, but approaching $4300 resistance shows trend weakness. Candle size decreased; profit-taking and minor pullbacks are possible. For trend continuation, higher volume and repeated buying pushing ETH toward overbought are needed.
📊 Liquidation Heatmap : Unlike BTC, long and short orders cluster sparsely, forming max-pain zones. ETH approaching $4380 could trigger a short squeeze and remove the seller ticker, pushing toward $4500. Next long max-pain is $4246, with lower support around $4100. ETH is in a near-decision zone with one bullish leg.
💸 ETHBTC Pair Currently in a trading range; the floor is Maker Buyer Zone , the ceiling is Taker Seller Zone. Price bounced well from the floor. High concentration of longs and shorts makes range boundaries critical—breaking either could trigger a sharp move. Price is near 0.037 resistance, RSI close to swing resistance. Buyer and whale support could enable another bullish leg; rejection may slightly increase risk of range breakdown.
🧠 Focus on BINANCE:ETHBTC wait for exit from the trading range, then check ETH/USDT. Often aligns with BTC dominance drops. Selling volume in ETHBTC is decent; if whales add volume, this setup provides optimal trade duration.
↗️ Risky Long Scenario: Break 0.037 resistance ETHBTC, BTC dominance drop, breaking ETH/USDT seller ticker, RSI stabilizes in overbought. Small stop-loss; trade is risky but viable.
📉 High-Risky Short Scenario: Rejection from current zone, ETH/BTC rejection, swing rejections, indecision candles multi-timeframe, SMA7 touch, and rising sell volume could signal short positions.
❤️ Disclaimer : This analysis is purely based on my personal opinion and I only trade if the stated triggers are activated .

Ethereum: false breakout confirmed — buyers target higher levelsHi traders and investors!
This analysis is based on the Initiative Analysis concept (IA).
On the daily timeframe, there is a sideways range with boundaries marked by black lines.
The price has returned inside the range. Buyers absorbed the seller’s candle that interacted with the lower boundary on increased volume (see the related post) — a classic false breakout pattern.
Now, with strong daily candles on rising volume, the buyer is pushing toward the upper boundary of the range. The price has already reached 4500, and next I expect 4800, 5000, and eventually 5,600 (see related posts).
Wishing you profitable trades!

ETHUSDT price have strong resistenceRight now, Ethereum is at the third touch on the descending (resistance) trendline.
Usually, when we reach the third touch, the price tends to fall.
We’re currently below the major resistance level at 4877, and in my opinion, on the monthly and three-month timeframes, the price doesn’t have enough strength to break through this level yet.
A correction is needed before we can break it.
That’s why at the moment, I’m more inclined toward short positions.
If you like the idea, please put a ‘like’. It's the best ‘Thank you!’ 😊 P.S. Always do your own analysis before a trade. Set a stop loss. Capture profits in instalments. Withdraw profits in fiat and make yourself and your friends happy.
DeGRAM | ETHUSD will retest the support level📊 Technical Analysis
● ETH/USD bounced from the 4,000 support zone after a false break, confirming strong demand and the validity of the long-term ascending channel.
● Price structure suggests potential upside with targets toward 4,950 resistance, supported by rejection wicks and consolidation above 3,920.
💡 Fundamental Analysis
● Ethereum’s momentum is fueled by rising institutional flows and expectations of ETH ETF approvals, strengthening medium-term bullish sentiment.
✨ Summary
ETH/USD holds above 4,000 with bullish recovery signals. Key support lies at 3,920, while upside targets remain 4,950. Momentum favors buyers in the medium term.
-------------------
Share your opinion in the comments and support the idea with a like. Thanks for your support!

ETH/USD Trading IdeaMy POV on ETH/USD right now. Another AMD pattern forming? Could this setup push price to a new ATH? $5000 Ethereum is just 10% away.

#ETHUSDT 4H ChartPrice is still pushing upwards and it is currently testing the 6h supply zone. MACD is still neutral, RSI is overbought and EMAs turned bullish. We may see price trade deeper into this area of supply before potentially retracing.

ETH USDT predictionprice prediction for ETH in short term - seems to go up until 7k~ where it tops as per the timeline


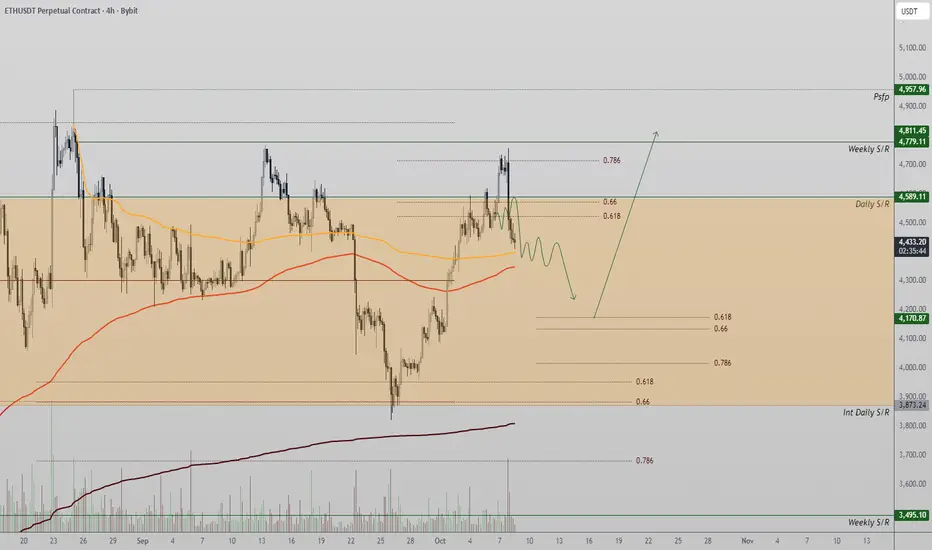
Ethereum Maintains Bullish Structure Despite Range Re-entryEthereum re-entered its prior trading range after a failed breakout above $4,589. Despite the retracement, market structure remains bullish, with a potential higher-low formation developing near the 0.618 Fibonacci zone.
Ethereum’s recent failure to sustain momentum above the $4,589 resistance led to a quick re-acceptance back into its prior range. This type of “failed auction” pattern often triggers short-term corrections, allowing the market to rebalance and find fresh demand at lower levels. However, despite the rejection, the broader uptrend remains intact, supported by higher highs and higher lows on both the daily and weekly timeframes.
The area between $4,250 and $4,300 represents a critical support zone — aligning with the 0.618 Fibonacci retracement level. Historically, ETH has treated this level as a springboard for continuation moves during trending conditions. A controlled pullback into this region would likely attract dip buyers, reinforcing the macro bullish narrative. Furthermore, on-chain metrics show steady network activity and staking participation, which supports long-term accumulation.
Should ETH reclaim the $4,589 zone, bullish continuation toward $4,950–$5,000 becomes likely. Conversely, if the 0.618 level fails to hold, a deeper retracement into $4,050 could occur before recovery.
What to Expect:
Ethereum remains bullish overall, with the current dip seen as corrective. A confirmed higher low at the Fibonacci zone would reaffirm momentum toward $5,000 resistance in the sessions ahead.