Ethereum (ETHUSD) – Technical Outlook with Key FundamentalsDescription:
Ethereum (ETH) is the second-largest cryptocurrency by market capitalization and a leading blockchain for decentralized applications, smart contracts, and DeFi ecosystems. Its network is continuously evolving, with Ethereum 2.0 upgrades focusing on scalability, security, and sustainability. Market participants often view ETH not only as a digital asset but also as a fundamental infrastructure for the Web3 economy.
This analysis highlights potential technical levels and market structure for ETH. Traders are closely monitoring price action to assess possible continuation or reversal scenarios, taking into account both short-term momentum and broader market conditions.
⚠️ Disclaimer:
This content is for educational and informational purposes only. It does not represent financial advice or investment recommendations. Always conduct your own research and risk management before making trading decisions.
ETHUSDT.3S trade ideas
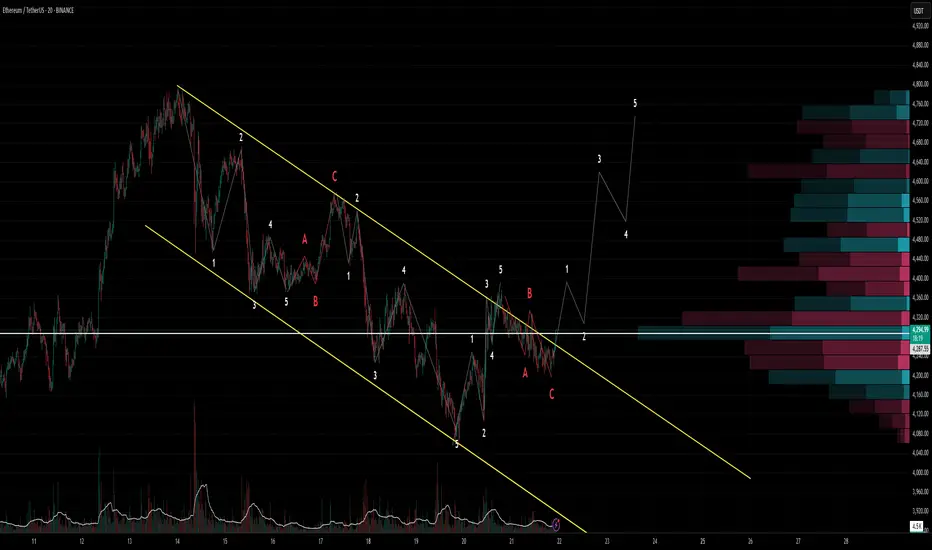
ETH - 4H Elliott Wave Analysis - 22.08.25Greetings ^^
We did get our rally from the support area that we had on the chart.
We assume that high of the 14th of August formed the top of the white Wave 3 and that we are currently in a correction displayed as yellow ABC which would form the white Wave 4.
The support area of this Wave 4 is between the 0.236 FIB at 4059 USD and the 0.5 FIB at 3370 USD. The Wave A is in and today's rally is the B Wave which we thermalized in yesterdays analysis and did expect it to be strong. We assume this ABC is an expanding flat which means the B Wave overshoots which it did. It touched the 1.05 FIB at 4833 USD which is a common target but it also is right below the ATH. Further targets for the B Wave would be the 1.236 FIB at 4985 USD and the 1.382 FIB at 5105 USD.
Next we would look for a Wave C to the downside.
The targets for this C Wave are the 0.618 FIB at 4375 USD the 1 to 1 FIB at 4106 USD, the 1.236 FIB at 3947 USD, the 1.382 FIB at 3853 USD and the 1.618 FIB at 3705 USD. A lot of targets, the most common is the 0.618 and the 1.618 FIB. The 1.618 FIB would also be in confluence with the 0.382 FIB of the Wave 4 support area which is the optimal target for a Wave 4.
Alternatively you can count the recent low as blue Wave 4 instead yellow A Wave and the move up today could potentially be the blue Wave 5 which would than finished white Wave 3. We do think the count mentioned above is more likely as the yellow A touched the 0.236 FIB of the white Wave 4 support area which is a common target for an A Wave and additionally the structure of today's rally look more corrective on the smaller timeframes. Overall it does not make a big difference for the moment except that in the blue Wave 5 we could go a bit higher compared to the overshooting B Wave.
Thanks for reading.
NO FINANCIAL ADVICE.

Ethereum Hits a New All-Time High · $5790 Next Followed by $8513Ether is now on a path to a new all-time high and this week is hyper-bullish, as bullish as it gets.
Notice the lower wick on the current session; the week started negative and as it reaches its end, it turns positive. The action is happening at the top of the candle and this means we will see green Saturday, Sunday and for months to come.
The lack of bearish strength on the last retrace shows that sellers are simply not present.
The strong advance today and marketwide bullish action reveals a huge demand for crypto, so strong, that prices can only grow.
Ethereum (ETHUSDT) is now set to hit a new all-time high but that's not all. As I explained in a previous publication, the all-time high is not a major resistance level, it will break easily. This means that Ether will continue growing with the first target being $5,790 on the current move. $8,513 is also a high probability target later this year. We might go even higher.
The bullish bias is now fully confirmed. Ether is going up.
The cryptocurrency market will continue growing. The altcoins market will continue to heat up. This is only the start.
Namaste.

ETH Shatters Downtrend with Explosive Breakout | Bulls Take FulChart: ETHUSDT, 1H
Bias: Bullish
Analysis:
Hello, traders! We are witnessing a dramatic and powerful shift in the ETHUSDT market structure that warrants immediate attention.
The Previous Bearish Context:
For several days, Ethereum has been trading within a well-defined bearish channel. This downtrend was characterized by:
A clear descending trendline that has been respected with multiple touches, acting as dynamic resistance.
A series of confirmed lower lows and lower highs, with multiple breaks of structure to the downside (indicated by the "Strong" lows being broken).
Overall seller dominance, pushing the price down from the $4,788 high to a low of around $4,042.
The Bullish Takeover (The Main Event):
The narrative has completely changed in the last few hours. A massive wave of buying pressure has resulted in an explosive move to the upside. The key developments are:
Decisive Trendline Break: A very strong, high-momentum bullish candle has completely shattered the long-standing descending trendline. This is the most significant bullish signal on this chart, indicating the previous downtrend is now invalidated.
Break of Market Structure: This upward thrust has also broken through several previous resistance levels, including the swing high around $4,400. This constitutes a major Change of Character (CHoCH) and confirms a shift in control from sellers to buyers.
Potential Scenarios & Key Levels:
Bullish Continuation (Primary Scenario): With such strong momentum, the path of least resistance is now to the upside. Traders might look for long opportunities.
Potential Entry: A textbook entry would be on a successful retest of the broken trendline or the recently broken resistance level around $4,400, which should now act as support.
TP 1: The previous major high at $4,788 (the '1' on the Fibonacci scale).
TP 2: The next major area of resistance, identified by the indicator as the "Perfect Sell Zone 1", starting around $4,880.
Invalidation Scenario: While the breakout looks powerful, traders must always manage risk. The bullish thesis would be invalidated if the price were to reverse, fall back below the broken trendline, and close decisively below the $4,300 support area. This would suggest the breakout was a bull trap.
Conclusion:
The evidence on the chart is overwhelmingly bullish in the short to medium term. The break of the multi-day trendline is a significant technical event that cannot be ignored. The immediate bias has shifted firmly in favor of the bulls. The key will be to watch for a potential pullback for entry opportunities and to see how the price reacts as it approaches the next major supply zone around $4,900.
Disclaimer: This is not financial advice. This is for educational purposes only. Always do your own research (DYOR) before entering any trade.

ETH Swing Long Opportunity ETH Daily Recap & Game Plan – 20.08.2025
📊 Market Sentiment
Overall sentiment remains bullish, supported by expectations of a 0.25% rate cut in the upcoming FOMC meeting. A weakening USD and increasing global risk appetite are creating favorable conditions for further upside in crypto assets.
📈 Technical Analysis
Price has been climbing in recent weeks, and we are currently in a retracement phase along with global markets (NQ and ES).
Price tapped into an untapped swing high, which is a strong zone I’m watching for reactions.
Additionally, price reached the equilibrium level of the Fibonacci (0.5), which places it in discount territory for me.
📌 Setup Trigger
The setup has already been triggered for me.
A 1H demand zone formed right after the EQ level was tested, so I entered the trade.
📋 Trade Management
Stoploss: 4035$
Targets:
TP1: 4279$
TP2: 4672$
TP3: 4888$ (ATH)
💬 Like, follow, and comment if you find this setup valuable!
⚠️ Disclaimer: This content is for informational and educational purposes only and does not constitute financial, investment, or trading advice. Always do your own research before making any financial decisions.

ETH - Ranges overviewWe’ve finally broken through 4K on ETH and we are currently trading around new highs.
From here let’s see how we play out.
IF we break through 5K and hold expect us to continue higher towards new all time highs at 6K and higher - on the longer term.
IF we fail to hold the “support” (sellside liquidity) around 4K-3.5K expect us to trade back lower.
As always when in new highs territories…do not BECOME A VICTIM OF EUPHORIA.
Position yourself and be PATIENT. THE MARKET WILL SHOW YOU ITS HAND.
Stay safe and never risk more than 1-5% of your capital per trade. The following analysis is merely a price action based analysis and does not constitute financial advice in any form.

ETHUSDT.PLets see if price repeat the previous pattern.
As fas as i expect the price is trying to make an inverse head and shoulder pattern..
But we should always wait for our entry level.
As soon the price reaches at our level we should wait for the confirmation signal. Which can be bullish patterns with strong volume..
Lets see how it plays..
Keep following guys for more analysis..
Thanks

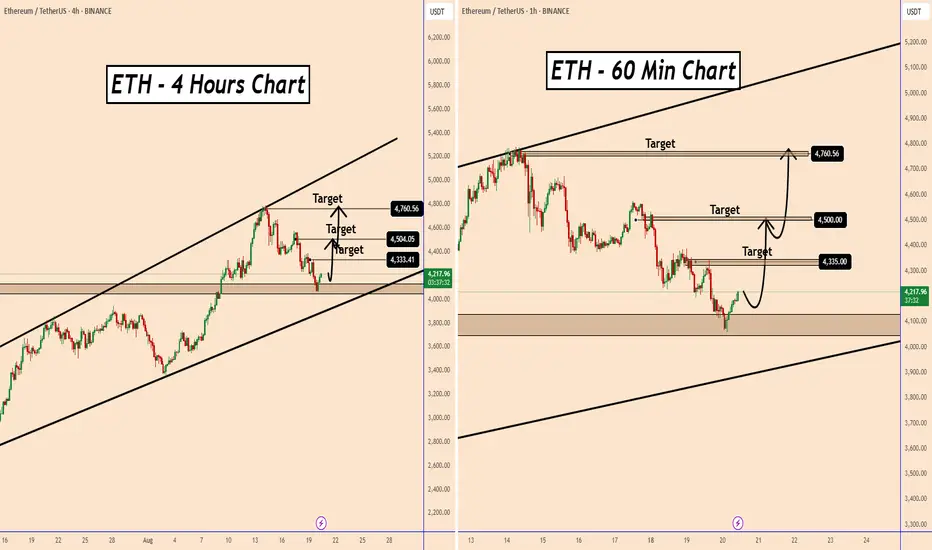
Ethereum Technical OutlookEthereum Technical Outlook
Ethereum remains in a well-defined bullish trend and is currently hovering near the lower boundary of its ascending support zone.
The $4000–$4050 area also aligns with a key structural level from previous price action, increasing the probability of a renewed upward move.
However, short-term sentiment may be influenced by speculation around Powell’s remarks, either in the FOMC minutes or during tomorrow’s Jackson Hole Symposium.
Key Resistance Levels to Watch:
$4335
$4500
$4760
A break above these levels could confirm continuation, while any hawkish tone from the Fed may temporarily weigh on momentum.
You may find more details in the chart!
Thank you and Good Luck!
PS: Please support with a like or comment if you find this analysis useful for your trading day
Good opportunity to buy Ethereum📊 Ethereum Entry
✅ Entry: 4175
❌ Stop Loss: 3900
🎯 Take Profit: 4700
Risk–Reward looks 🔥
This analysis is not a financial recommendation. Crypto is a very risky market and you may lose some or all of your money in it. Especially futures trading.

Ethereum held key level ┆ HolderStatOKX:ETHUSDT is retesting the $4000 breakout level after a 14% pullback. With strong bullish structure and flag formations in the past, this level acts as key support. If it holds, ETH could aim for $4780 next, with $5000 as the larger target.

ETH/USDT Chart Analysis CRYPTO:ETHUSD ETH/USDT shows a strong upward move after a period of consolidation and a breakout from a descending trendline.
Bullish Momentum: The price has moved significantly higher from the S/R level and is currently trading at the higher end of the recent range.
Impulsive Move: The recent candle is a large green candle, indicating strong buying pressure and an impulsive move to the upside.
Potential Pullback: As mentioned in the previous analysis, the price may experience a pullback or a retest of the broken trendline. The strong move up could be followed by some profit-taking before a continuation of the trend. This is a common pattern in breakouts.
Key Levels: The price action confirms that the S/R level around $4,284 is a critical area. As long as the price stays above this level, the bullish structure remains intact. A break below this level could signal a false breakout and a return to the previous range.
ETH RangeI'm looking for something like this on ETH. A distribution into supply that turns into an accumulation to maybe even target the highs. I'm waiting for confirmations/invalidations and confluence via BTC and USDT.D. But there is also better demand below. If i don't see accumulation here i will target lower.

ETHUSDT - Breakout, or fakeout?Hi all!
ETHUSDT has broken structure on the 1H/4H and is consolidating above the local descending trendline. On Binance we can see a strong hidden CVD bull forming — aggressive bears have been trying to push price down, but passive buyers are holding price up.
If sellers get exhausted, we could see a rally towards new highs around 5,250. With possible rate cuts coming in September, the market might be gearing up for a fresh bull-wave up. I believe we’re setting up for that next leg higher, and the weak high from 14 Aug will eventually get swept.
For confirmation, wait for at least an hourly close above the local VAH at 4,390 if you’re looking for a long here.

ETH New Analysis (4H)After the weekly trigger line was broken and a key supply was cleared, most of the major market participants have been accumulating Ethereum. Considering the momentum and power of the previous bullish trend, we expect nearby supports to hold well and a large distribution phase to form.
In this phase, in order to fill the orders of big players and create a strong bullish outlook before a major correction, the price is expected to revisit the previous bullish wave or even hunt Ethereum’s all-time high.
As long as the green zone holds, we anticipate a price pump for Ethereum in the coming days.
For risk management, please don't forget stop loss and capital management
Comment if you have any questions
Thank You

Ethereum (ETH): Moved 140% So Far | Looking For Break of ATHEthereum is in an accumulation phase, where we have had a very sharp and aggressive movement to upper zones, yet the buy-side momentum has not faded away anywhere.
So that being said, we are still looking for ATH to be reached and broken; after that, we are going to aim for new highs.
Swallow Academy

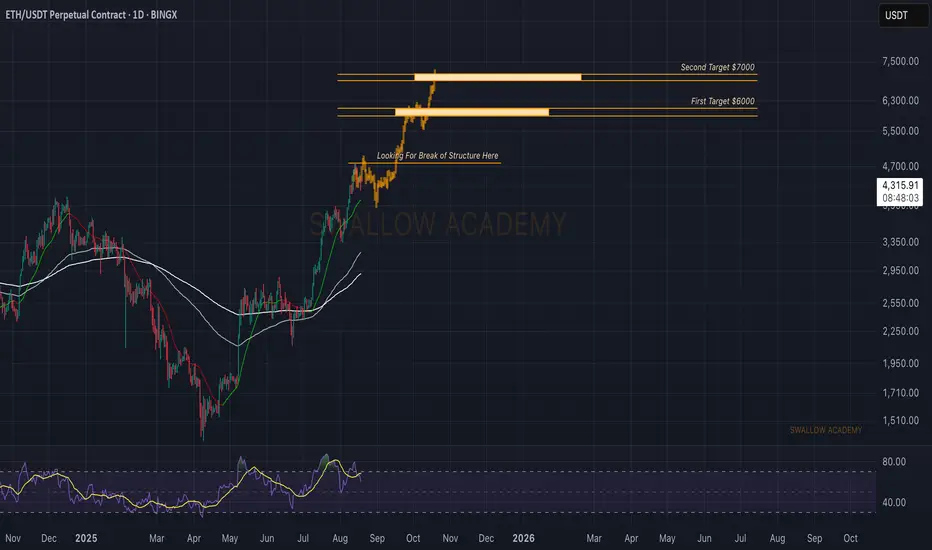
Ethereum (ETH): Looking for Break of Structure | $6000 | $7000ETH is on fire; with a recent break of local highs, the price has reached the ATH zone, where now we are looking for a sharp BOS to form, which would open for us the opportunity for a movement toward the $6000-$7000 range.
This is our current target for ETH, but we have to see that proper BOS before we can form the next ATH.
Swallow Academy
ethereum very bullishEthereum is finally starting to show its worth. It has received so much hate, but it will skyrocket again. Get ready.

For those who are long-term investors (not short-term traders), ETH maintains the key support at $3,800—which appears to be a critical Fibonacci and horizontal level—we could indeed see a bullish move toward $5,000, representing about a 16% gain from current levels. This target makes sense technically, as it would test the prior all-time high area and potentially break the descending trendline visible on the chart.
For those who are long-term investors (not short-term traders), you can consider buying ETH in parts from the current price (~$4,300 range) down to $3,850 to average in on any dips, while setting a stop loss at $3,800 to protect against a breakdown. This strategy allows for dollar-cost averaging into strength if the uptrend resumes or weakness if it tests support, but always manage position sizes based on your risk tolerance.

Analysis update.As we mentioned in yesterday’s analysis, the price stuck to the upper boundary of the higher timeframe channel and showed a tendency to break upward. With one candle, it finally broke above the channel, and now we should wait for breakout confirmation before considering a long position.

Symmetry
Hello awesome traders! Hope you’re having a great summer. I’ve been juggling a few projects and a little time off—but eyes always on the charts. Today: Ethereum showing a clean symmetry (equal-legs) bullish setup.
Overview
Pattern: Symmetry / AB=CD (equal-legs) bullish
Context: Price printed D ≈ 4,047 and reclaimed momentum above 4,140, then based inside PCZ1.
Bias: Bullish while holding/reclaiming the PCZ1 band.
Key Levels
PCZ1 (retest/reclaim zone): 4,204 – 4,329
Momentum line: 4,140 (hold above = bulls in control)
Target 1: 4,652 (prior measured level on chart)
Target 2 zone: 5,191 – 5,498
Trade Plan
Primary long: 4H close above 4,329 (top of PCZ1) → look for continuation toward T1 4,652, then T2 5,191–5,498.
Alternative long: Reactive buy on a retest/hold of 4,204–4,220 with a bullish rejection (wick + strong close back inside PCZ1).
If PCZ1 rejects: Watch for a higher-low setup back near 4,260/4,220. Lose 4,140 on a 4H close → stand aside; deeper pullback to 4,080–4,050 possible.
Risk Management
Risk ≤ 1% per idea.
Stops: Conservative below 4,120 (for PCZ1 retest entries) or below 4,040 (for deeper-pullback entries).
Management: Scale at T1, trail to BE after ~1R, leave a runner toward T2 if momentum holds.
Notes
Structure stays valid while 4,140 holds on closing basis and price continues to respect PCZ1.
Confirmation = clean 4H close and hold above 4,329 with rising momentum.
@tradechartpatternslikethepros.

ETHUSDT analysis – 1D OB & Market Structure Scenarios/ AltseasonOn the daily chart, Ethereum is consolidating below the ATH resistance (4859) after a strong rally.
We currently have two major Daily OB demand zones:
First Daily OB around 3200–3600
Second Daily OB around 2400–2800
From here, I see three possible scenarios:
1️⃣ Continuation without deep retracement → Price holds above 4100 and breaks ATH (4859).
2️⃣ Shallow pullback → Price dips into the 3200–3600 OB, then rallies back above ATH.
3️⃣ Deep correction → Price retraces into the 2400–2800 OB before starting a new bullish leg.
⚡ Key point: If any of these three bullish scenarios play out alongside a drop in BTC dominance and a rise in ETH dominance, it could be the real start of an Altseason, with ETH leading the market and altcoins following strongly.
📊 ProfitaminFX | Gold, BTC & EUR/USD
📚 Daily setups & educational trades

Ethereum 7 Days Later · Retrace Or Correction?More information is available now that Ethereum has been retracing for seven days, we can start to make some predictions by analyzing how the token is currently behaving, for example; there isn't much on this chart other than high volume the day that ETHUSDT peaked, the other bearish signals are weak.
The drop is not strong. ETHUSDT is trading safely above EMA55. This move resembles what happened 11-June. A retrace.
On 11-June ETHUSDT peaked at $2,879 and started to retrace. 11 days later, 22-June, ETHUSDT bottomed at $2,111 and that's it, that was the retrace. The entire move was a 26.65% drop, I think we can see something similar.
28-July ETHUSDT peaked again but only briefly, there was a six days long retrace totaling -14.89%. The drop happened from $3,941 to $3,354 but then Ethereum just kept on growing as if nothing happened like before; it is possible to see something similar.
The strength of the current drop, after seven days of bearish action, seems weak. It can intensify in a flash and we see a market crash, but the same dynamics that are present with Bitcoin are also present here. A major crash or flush would only result in a prolonged recovery followed by higher prices.
Ether is likely to move lower but not much lower. Ether is likely to consolidate just to move higher. Ether is growing. Keep it simple.
Namaste.

Potential ETH Reversal (Elliott Wave Related)It looks like the correction is over, and we are going into the next set of 12345 of impulse waves. If my count is correct and there are enough momentum to start the next 12345, we have a chance to hit 5K in the next 3-4 weeks. But of course anything can happen in this tariff / geo political driven environment.
Stay cautious! Make sure you set your stop loss / take profit.
Stopping out in profit and missing a huge run is better than stopping out in deep red.