ETHUSDT.3S trade ideas

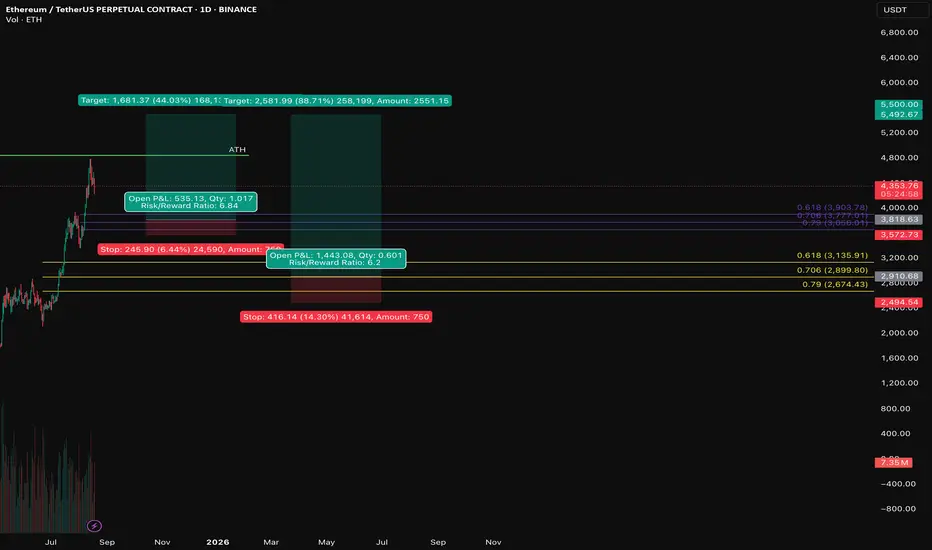
ETH Daily + 4H Fib Confluence — 4H is LeadingI’ve been watching ETH on the daily and 4H charts and lined up two fib pulls:
• Yellow = Daily fibs (macro swing levels)
• Purple = 4H fibs (short-term precision levels)
After watching how price reacts, the 4H fib is cleaner and more respected right now — especially around the 0.618–0.786 retrace zone. Intraday moves are sticking to these levels tighter than the daily.
Key Levels
• 4H 0.618 ≈ 3,903 → strong magnet already tested.
• 4H 0.786 ≈ 3,557 → line in the sand for bulls.
• Daily 0.618 ≈ 3,135 → if price breaks down further, this is the next major defense.
• Daily 0.786 ≈ 2,899 → last swing-long support before structure flips bearish.
⸻
Targets 🎯
• ATH test @ 4,861 → first major hurdle.
• 5,492–5,500 zone → realistic breakout target if ATH clears.
⸻
Trade Setup
• Running two positions:
• Tight stop / momentum play → R:R 6.8
• Wider swing play → R:R 6.2
• Both layered so I’m covered short-term and long-term.
⸻
TL;DR
ETH looks like it wants to respect the 4H fibs for now. Daily fibs stay on deck as the “backup parachute” if price retraces deeper. Watching ATH → breakout → 5.5k zone as the bullish path.
DYOR
Weekly trading plan for EthereumBINANCE:ETHUSDT showed strong growth last week but failed to break resistance, leading to a correction. At the moment, the price reacted from the first support level and is trying to reverse, though there’s still a chance to see a move down to the second support level before a gradual rise toward a new ATH.
In any case, if the trendline and the weekly pivot point are broken to the upside, the path toward 5,000 will open. If the price sets a new local low and fails to quickly reclaim 4,100 , a drop toward 3,850 becomes possible.

ETH - Eyes on a New All-Time High?ETHUSDT has been on fire lately, following a textbook bullish structure of Impulse → Fakeout → Impulse.
After breaking above the previous range in July, ETH confirmed strength with a sharp impulse move, only to shake out weak hands via a fakeout retest before pushing higher again. 📈
Currently, ETH is in the midst of another impulsive leg, with the next major target sitting at the ATH around $4,876.
📊 Key Notes:
- Fakeouts have served as liquidity grabs before strong rallies 🏹
- Current momentum favors the bulls 🐂
- As long as price holds above the last breakout zone (~$4,050–$4,150), the path of least resistance remains up.
🎯 Next Stop: ATH and beyond if bullish pressure sustains.
📚 Always follow your trading plan regarding entry, risk management, and trade management.
Good luck!
All Strategies Are Good; If Managed Properly!
~Richard Nasr

ETHUSDTBINANCE:ETHUSDT is overall trend in the 4-hour timeframe is bullish, with strong buying momentum. The price is currently at the 4200 USD resistance, and if this level breaks, the next target will be around 4500 USD.
Supports:3950 USD, 3730 USD, 3350 USD
Resistances: 4200 USD, 4500 USD
⚠️Always apply proper risk management.

Ethereum will consolidate above $4k ┆ HolderStatBYBIT:ETHUSDT on the 16h chart is pulling back after strong rallies, retesting the $4,000 support level. Sideways and consolidation phases remain visible, showing demand. As long as $4,000 holds, targets at 4,600–5,000 stay valid.

ETH Roadmap: $6900 → $11,000Hello Traders 🐺
I think now it’s the perfect time to say: I told you so!
But let me be honest with you, my dear followers — I truly believe we are one of the best communities out there, because we actually do what we say. Since ETH was around $1800, I was screaming louder than ever: this is your last chance to buy ETH this cheap!
Now we are sitting almost at the ATH price, and once ETH breaks above it and goes beyond the last barrier, we could witness a massive Altcoin season — especially among the top 20 coins.
But what’s my price target for ETH?
As you can see on the chart, price is now clearly above the huge bull flag. Based on Fibonacci levels, the next target is $6900. But honestly, my personal take profit area is around the Fibonacci golden ratio at 0.618, with a price target of $11,000. Yes, you heard it right!
I hope you enjoy this idea, and as always remember our golden rule:
🐺 Discipline is rarely enjoyable, but almost always profitable. 🐺
🐺 KIU_COIN 🐺

Ethereum's Bullish Market Conditions Intact —$11,111 NextNothing changes here. I am looking at the weekly timeframe and it seems Ether is ultra-bullish, it is literally growing above resistance.
The very insistent and annoying resistance from March 2024 was broken just last week. And as ETHUSDT trades above this level, it started to grow. This week is the first week above resistance and the chart looks great.
Things can change. But things can change. We can see multiple red candles show up and lower prices but this isn't what we have on the chart today. Right now we have strong bullish action, strong bullish candles, strong momentum, the break of resistance, the highest prices in four years and accumulating bullish volume. The chart doesn't point down rather it is saying "additional growth."
Ethereum will continue growing. Just think about it: One day ETHUSDT is trading at $1,500 and starts to go up. Four months later, ETH is trading at $5,000.
Thanks a lot for your continued support.
The next target is $6,000 to stop blank at $7,330 to continue rising until we go beyond $10,000, a price tag of $11,111 for this 2025/26 bull run. There is enough time in 2025 for ETH to produce a full bullish cycle. This chart doesn't need 2026. If it extends, better.
Namaste.

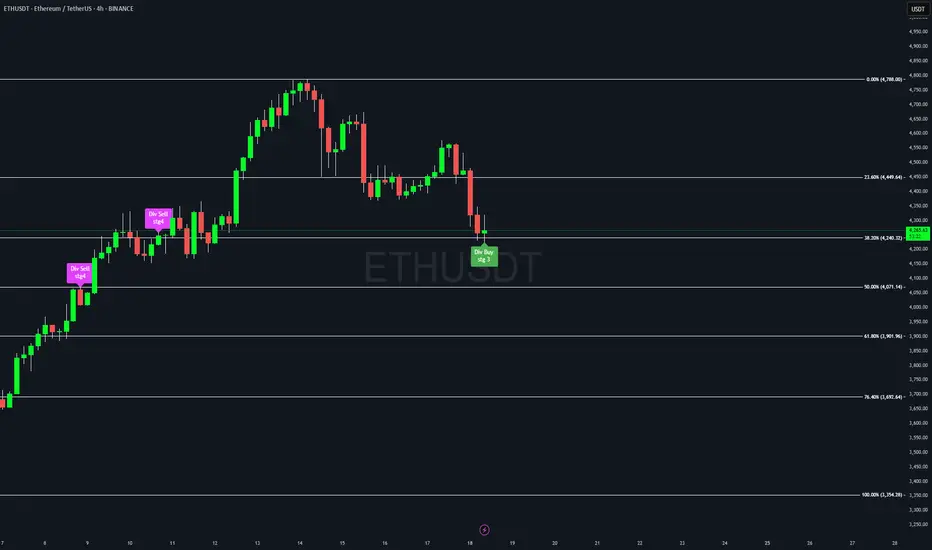
ETH pullback ?ETH presents a higher probability of a pullback following a buy signal of opportunity sinper indicator + near the 38% Fibonacci retracement. Price could either retest the recent swing high or retrace to the 23% level before resuming the corrective move. Traders should monitor key levels for confirmation
ETH watching the 4.00–4.20k pullback (Yearly VWAP heatmap)ETH just printed a strong impulse on expanding volume. On my chart the Yearly-anchored VWAP heatmap is bright green, which means price is trading far above VWAP. Great momentum— but also a spot where I prefer reaction trades over chasing.
First pullback reaction ?
I’m watching the 4.00–4.20k box (white circle):
It’s the 0.5/0.618 retracement of the latest leg.
It aligns with a previous pivot/structure on this timeframe.

Eth test run This graph shows ethereum technical trends for the long run. This chart is not a recommendation. This is only for self training.

ETH_USDT I'm expecting ETH will fill the CME Gap and Turn the Market from That Demand Zone. So you can catch a best trade with your confirmations.
HAPPY TRADING 💐


ETHETH make ATH and gave us a breakout and now retesting the breakout and also giving respect to the SR level which was the previous high.
What i see it hunt the long side liquidity and now gonna make a new ATH soon


ETH risk of further downside moves 1HR chartIf ETH breaks $3539, could see a further drop to next support. This is short time frame, the bigger Macro trends are still in tact.

Ethereum Price Aims at $5,000 As Exchange Balance Falls To 9-YeaBINANCE:ETHUSDT is currently priced at $4,531 , positioned just above the $4,500 resistance. The broader indicators, suggest a favorable environment for a breakout. On-chain data highlights a key trend supporting Ethereum’s macro outlook.
Exchange balances have dropped to a nine-year low of 14.88 million BINANCE:ETHUSDT , signaling that investors are moving their holdings into long-term storage.
If BINANCE:ETHUSDT manages to reclaim $4,500 as support , the uptrend could accelerate. This move would help the cryptocurrency push through the next resistance at $4,749, paving the way for a test of the $5,000 mark.
However, risks remain if investor sentiment shifts suddenly. Should holders decide to secure profits, BINANCE:ETHUSDT could slide toward $4,200 or even $4,000 . Such a decline would weaken the bullish thesis, opening the door to consolidation instead of continuation of the current uptrend.

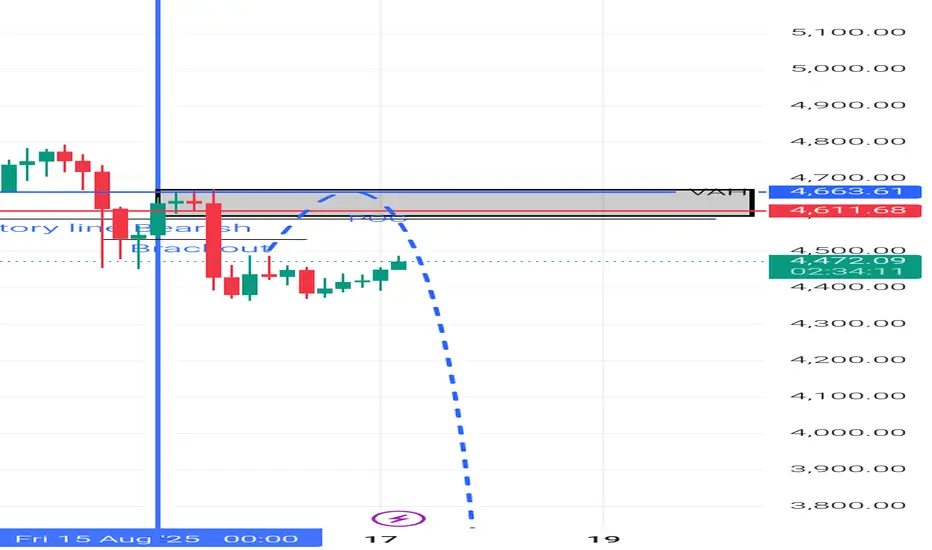
ETH ANALYSIS (4H)Ethereum has broken a weekly blind trigger and has now reached a higher-timeframe supply zone, which corresponds to the weekly timeframe.
Given the strength of the supply zone and the strong bullish momentum, there are currently two possible scenarios:
**Scenario 1:** It may have a pullback from this supply to demand before making an attack toward the all-time high.
**Scenario 2:** It may consolidate on the supply and go straight toward the all-time high.
In both scenarios, it is expected that after hunting the all-time high or moving slightly above it, the price will drop sharply toward lower levels.
For risk management, please don't forget stop loss and capital management
When we reach the first target, save some profit and then change the stop to entry
Comment if you have any questions
Thank You

ETH_USDT 4H Possible Scenario I'm expecting ETH will Rejecte From above black box. Keep watching on market to catch the best trade.
HAPPY TRADING 💐
Etherum to test resistance BINANCE:ETHUSDT My prediction 5% increase till monday. no more bear cycle here. gonna test resistance at 4500 if it clears, then resistance at 4600. resistance at 4600 seems weak, so we can expect target closer to 4700.

ETH on track for new All-Time Highcurrently, Ethereum is moving within a channel on the daily timeframe and the midline of the channel has temporarily limited further price growth. this price correction could present an entry opportunity for those who missed the 2000$, or a chance for re-accumulation. however the overall trend remains bullish. the support lines are clearly marked on the chart and it is expected that ETH will reach a new all-time high in the future, with the potential to grow up to $8000
ichimoku analysis was also used, but it has been removed for chart clarity.

ETH Fair Value Gaps and current resistanceBINANCE:ETHUSDT shortly before potential resistance at around 5k (last ATH roughly), as well as looking at BINANCE:ETHBTC pair it's hitting a major downward resistance that upheld since 2024.
Additionally two unfilled fair value gaps between 4100 and 4600 formed, which tends to be filled in a swift (or not so swift) correction. ofc I hope that #ETH still pushes through ATH, but that's the setup I see. Going into a very short ETH short with tight stop loss to test the waters.
But the narrative still says "Altseason", so use with caution.
