ETHUSDTmy expectation it is but there is most important thing is that even if eth drop to 4000 usd then there will not be any change on chart. Our way will just up but if we are in bull market then we have to push idm fvg and mitigation which is daily or weekly. I have to see that 3 combination.
Let see!!
ETHUSDT.3S trade ideas

ETH 8H – Pullback After Parabolic RunEthereum’s 8H chart shows a sharp rally stalling near 4,750, with price pulling back from local highs. The first key support lies around 3,950–4,050, followed by a major breakout zone near 2,750–2,900 if selling deepens. Stoch RSI sits mid-range, leaving room for momentum to build in either direction. A bounce above the first support could keep the uptrend intact toward fresh highs.

Drop to 4000 or trend reversal?We’ve been saying for days that Ethereum’s been climbing for no clear reason despite strong trend weakness, and now we can see it’s turning bearish for the moment. If this drop continues a bit more, many traders might FOMO-sell to lock in profits, potentially pushing the price down to 4000. It’s also possible that it finds support above 4000 and resumes the uptrend.

ETHEREUM THE ETHEREUM STRUCTURE remains valid for now,the buy zone triggers in the face of profit taking ,watch the price action.

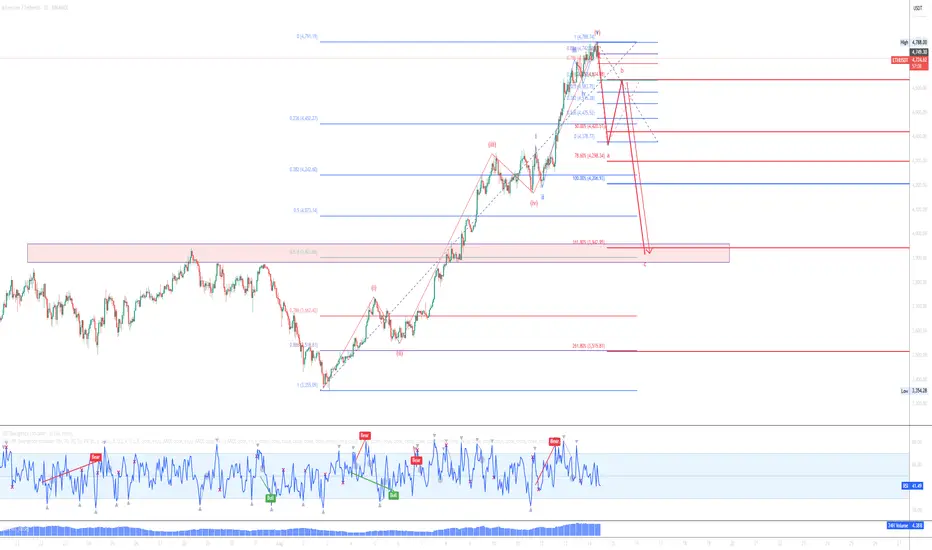
Ethereum's Last Wave? Bearish Trend Incoming!Ethereum ( BINANCE:ETHUSDT ) started to rise and pump as I expected in the previous idea .
Ethereum is currently trading in a Heavy Resistance zone($4,868(ATH)-$3,977) near the Potential Reversal Zone(PRZ) , Cumulative Short Liquidation Leverage($4,527-$4,452) , and the upper line of the ascending channel(potential) .
In terms of Elliott Wave theory , Ethereum appears to be completing microwave 5 of main wave 5 . Main wave 5 could complete at the Potential Reversal Zone(PRZ) .
Also, we can see the Regular Divergence(RD-) between Consecutive Peaks .
Before any conclusions, let's take a look at the ETHBTC ( BINANCE:ETHBTC ) chart.
ETHBTC also indicates the end of the uptrend, and if the market falls , we can expect ETH and the tokens on the Ethereum blockchain to undergo a correction this time.
I expect Ethereum to bearish trend in the coming days and at least close the CME Gap($4,185-$4,080) .
One of the tokens that we can use for short positions alongside Ethereum is the ENS token ( BINANCE:ENSUSDT ). ENS is the decentralized naming system built directly on the Ethereum blockchain, simplifying crypto addresses into human-readable names .
Cumulative Long Liquidation Leverage: $4,145-$4,094
CME Gap: $3,461-$3,417
Note: Stop Loss: $4,780
Do you think Ethereum will create a new All-Time High(ATH) soon, or should we wait for a correction?
Please respect each other's ideas and express them politely if you agree or disagree.
Ethereum Analyze (ETHUSDT), 4-hour time frame.
Be sure to follow the updated ideas.
Do not forget to put a Stop loss for your positions (For every position you want to open).
Please follow your strategy and updates; this is just my Idea, and I will gladly see your ideas in this post.
Please do not forget the ✅' like '✅ button 🙏😊 & Share it with your friends; thanks, and Trade safe.

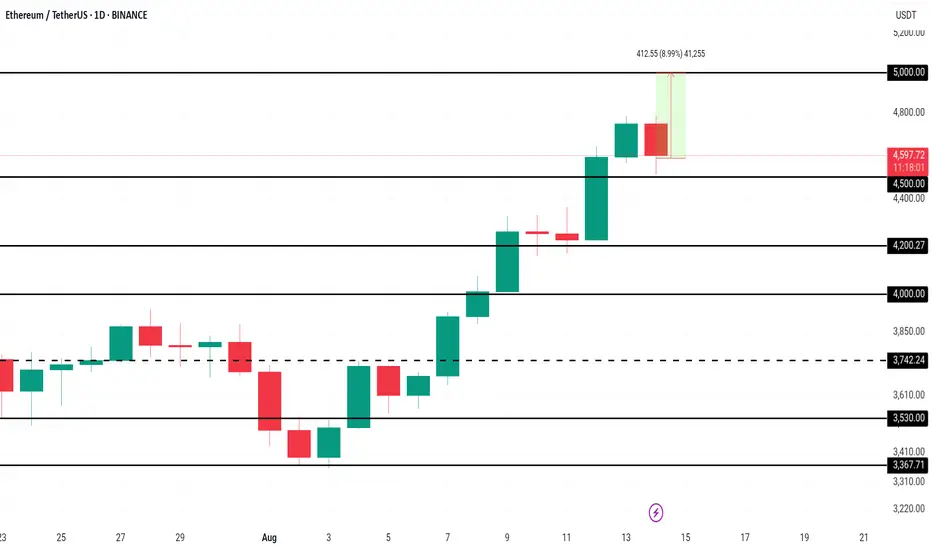
Ethereum Price Nears $5,000 After 3.5 Years; Will It Succeed?Ethereum is currently trading at $4,723, just 5.8% away from the $5,000 milestone. The asset has secured $4,500 as a solid support level, further strengthening its bullish outlook. This three-and-a-half-year high is energizing buyers, who see $5,000 as the next key target.
With robust whale accumulation, record futures interest, and positive funding rates, Ethereum’s path toward $5,000 appears intact. Once this level is breached, momentum could carry the price even higher, potentially targeting $5,500 in the following weeks.
However, the bullish scenario hinges on investor sentiment holding firm. If traders pivot to profit-taking, ETH could drop below the $4,500 support. A sustained move under this level might push prices toward $4,200, undermining the current uptrend and delaying further gains.
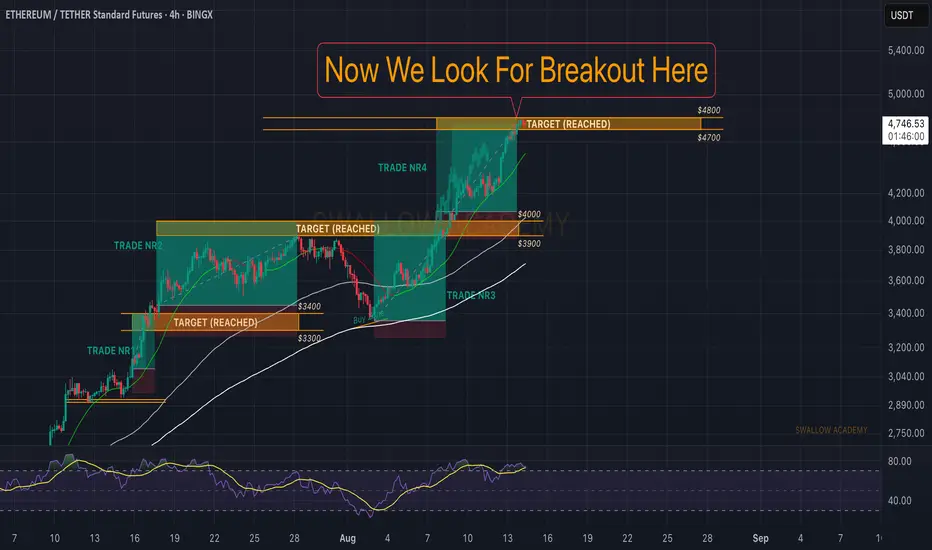
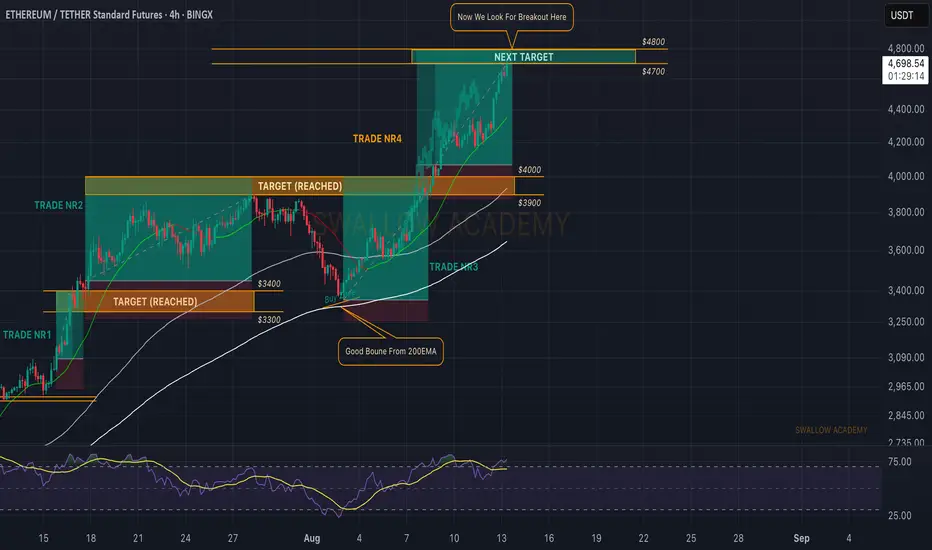
Ethereum (ETH): Now We Wait | We Hit All Targets 62% of market price movement combined—we caught up with all of you with 4 separate trades on ETH.
Amazing movement we have had so far, and now we start the worst part of trading, the waiting part.
We wait for a proper break of the local ATH zone, whereafter we will be aiming to see the $5000-$6000-$7000 areasreached.
Swallow Academy
Ready for correction?Hi there!
ETH is at ideal level where correction can start!
We can take look the BTC chart and it is the same story and the correlation between ETHBTC also!
Our most important level for watching is 3940 + -!
Good luck traders and Bears
Ethereum ETH Pullback Into Support Could Lead to Another Rally📊 Taking a close look at ETH/USDT, the market has recently shown bullish intent after a break of structure on the daily 📈. From a Wyckoff perspective, price is currently reaching into a key resistance zone. Im looking for a retrace into support and, potentially forming an accumulation phase. I’ll be watching for a shakeout below support — followed by a strong rally. If this confirms with a bullish market structure break, it could offer a high-probability long setup 🔍💡🚀 (not financial advice).

ETH ROAD TO 20K+ plan BAs far as we are getting closer to the final accumulation stage on ETH we can see a potential shape of huge channel in log scale but even bigger I posted previous time due to price action and ETH going better I thought.
Still after forming median of the channel I would like to see a big and fast correction from here towards 2900 support which must hold imo.
Top of that channel depends on timing so the later the better I guess.

Ethereum : Watch the breakout closely
ETH / USDT is currently at a critical juncture, testing a major multi-year resistance zone between $4100 and $4200. This level has historically been a significant ceiling for the price.
The current weekly candle is attempting a breakout above this resistance.
The Key Takeaway:
If this weekly candle closes definitively above the $4200 resistance, it would confirm a major breakout. This could propel ETH towards new all-time highs, with a potential price target of $5000 and beyond. This is the "fly" scenario.
Conversely, a rejection from this level and a close back below the resistance would indicate a false breakout, and we could see the price consolidate or correct in the short term.
All eyes are on the weekly close to confirm the next major move.

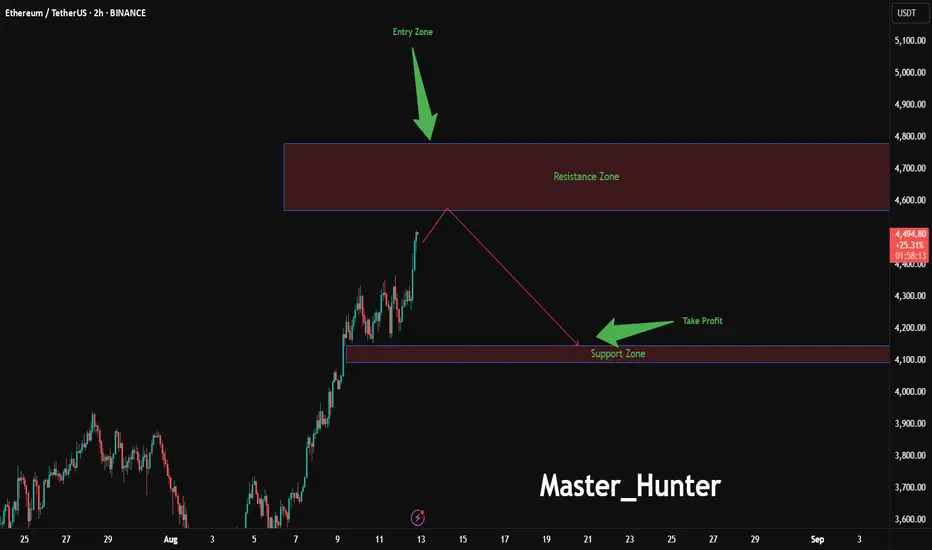
Ethereum Drop Zone Approaching?BINANCE:ETHUSDT is flashing warning signs on the 2-hour chart, with an entry zone between 4570-4780 near a critical resistance level that has capped recent rallies.
This setup suggests a potential reversal , targeting a profit zone between 4145-4093 where strong support and the 200-day EMA converge. Set a stop loss at 4780 on a close above to protect against a false breakout, keeping risk tightly controlled. A break below 4550 with increasing volume could confirm the downward move, especially if Bitcoin leads the market lower.
Keep an eye on Ethereum network upgrades and overall crypto market sentiment, as these could act as key catalysts. This trade offers a strategic opportunity for those ready to navigate the volatility—share your insights below!
#ETHUSDT #EthereumTrading #CryptoSignals #TechnicalAnalysis #TradingView #DayTrading #MarketAnalysis
Ethereum Breaks 504 Days Long Resistance · The 2025 Bull MarketEther just broke a 504 days long resistance. The next one is the 2021 all-time high which happened a massive 1,372 days ago. Early November 2021.
Ethereum is breaking all resistance. One is already gone and the next one will be gone very soon, just this week is the first time that ETHUSDT is moving freely after breaking the high from March and December 2024. This was a price level around $4,100 and this was a tough barrier.
First in March 2024 Ethereum started to decline from this price to a low of $2,111. The second time happened with a $1,385 bottom. This time, ETHUSDT is already trading at $4,725 so there is no resistance left.
The last all-time high is not a resistance level of relevance. It does have some psychological effects because people track it but the market isn't likely to stop there for any meaningful amount of time. The action is headed straight up.
You know we are open and aiming for $11,000 but right now $6,000 followed by $7,300 is an easy goal. Go higher.
Do you think Ethereum was expensive when it traded around $2,400?
Remember, "trading at bottom prices"? Not anymore.
Ethereum is ultra-bullish now and there is no going back, a new all-time high is upon us and once Ether hits a new all-time high, all bets are off. Everything will speed up and all the smaller altcoins will start to follow.
The high increase in trading volume that tends to happen on the third wave of a bullish impulse is not present here. In fact, there is no significant rise in trading volume since July 2022. The weekly session in April produced high volume but not higher.
This is good. This means that the best is yet to come. We haven't seen much yet. We still have to experience the bullish force, strong momentum, the completion of the third wave and then finally the fifth wave.
Whatever you do, keep holding long-term.
Ethereum is going up.
Namaste.

Ethereum's Hits New All-Time High · Next Target $7,332Ether (ETH) is approaching its 2021 all-time high and wow!, this is awesome, think about it. One day we are witnessing a correction, Ethereum crashing for years lower below $2,000 and then even lower, below $1,500 and then what? After just several months Ethereum is already trading way high above $4,500 and ready to hit a new all-time high, catching up to Bitcoin and XRP; the rest of the altcoins market will follow.
Yes, a new all-time high but that was never the goal. The previous peak is only a resistance point, a reference point which we use to know how good we are doing, how far advanced we are in the current cycle but it is never the end. The all-time high is meant to be broken in each cycle and this is exactly what we are seeing today.
As soon as ~$4,900 breaks, ETHUSDT is likely to continue to straight up to face resistance right around $6,000. Stops should be just like the past. A few days red or sideways then back green. Always up with maximum force, the entire move.
The main resistance for this current advance is $7,332 but for the current cycle, new and updated numbers based on current market action and fresh data suggests that $11,318 is a possible target based on standard cryptocurrency bull market action. That is, we don't even need an extraordinary bull market to make Ethereum worth $11,111 per Ether token.
Ok. Market conditions look great. It's been a long ride... We've been tracking Ethereum for so many years now and this entire bullish recovery, cycle and wave. Let's continue to ride the market together... Let's trade!
Namaste.

break the ressitanceif eth break 4800 resistance its possible to jump to 6800 or 700 in 2 days what do you think its is possible or not?? i wana buy eth please help me

ETH at resistance!Ok, finally ETH is making happy all his estimators but I jsut want to point out that it's close to ATH so maybe wait to see what happens before buying it. I'd wait for some short setup unless there's a stronk breakout!
I expect something like what I drawn there. I don't own a lot of ETH but remember that after ETH money will flows in big caps alts and that will make us happy.
Good luck!

ETH ready for ATH?Might be but for now lets wait for Structure shift on H1 or H4 short it and than from the zone wait for bullish shift and kabooom...
The zone is not refined the pullback can be deep so always look for bullish market structure shift.

ETH | Long Idea - All time highs soonETH | Long Idea
📊 Market Sentiment
Overall sentiment remains bullish, supported by expectations of a 0.25% rate cut in the upcoming FOMC meeting. A weakening USD and increasing global risk appetite are creating favorable conditions for further upside in crypto assets.
Ethereum is approaching all-time highs, fueled by a $1B single-day ETF inflow. Additionally, rumors of potential SEC approval for Ethereum staking policy could directly boost ETH’s utility — strengthening the long bias.
📈 Technical Analysis
Price is climbing steadily after sweeping LTF liquidity.
Retracements have been shallow due to strong momentum and market hype.
All-time highs are now clearly an institutional / smart money target.
📌 Game Plan
Watch for a sweep of 1H swing lows / equal lows at $4,605 followed by a bullish rejection.
Alternatively, 12H FVG at $4,561 could be taken before rejection — both liquidity runs are valid watchpoints.
🎯 Setup Trigger
Look for a 1H break of structure after liquidity grabs at the mentioned levels.
📋 Trade Management
Stoploss: 1H swing low that confirms the break of structure.
Target: Direct move towards all-time highs at $4,868.
💬 Like, follow, and comment if you find this setup valuable!

Market update for EthereumAs for BINANCE:ETHUSDT , setting a new ATH is only a matter of time — most likely today or tomorrow.
The price is currently in the resistance zone, with red candles appearing, so a slight pullback to 4,500 is possible before breaking the ATH. It’s easier to track this on a lower timeframe — just don’t even think about shorting the highs.
The first two targets have already been reached, and the final target is right at the ATH level.

Continuation of ETH -Sell/ShortIn continuation of the previous ETH/USDT Sell/Short outlook, the price has formed a bearish candle below the neckline. This position can be maintained until the bearish divergence is fully resolved across all three timeframes — 1H, 4H, and 1D.

Ethereum (ETH): We Reached $4800 | Looking For Break & New ATHEthereum is the boss, pushing for a new ATH, where we reached our target with ETH and now the price is going for the new ATH (potentially).
We are going to wait out for a proper breakout here from that new ATH and once we get it, we expect a very volatile upside movement.
Swallow Academy
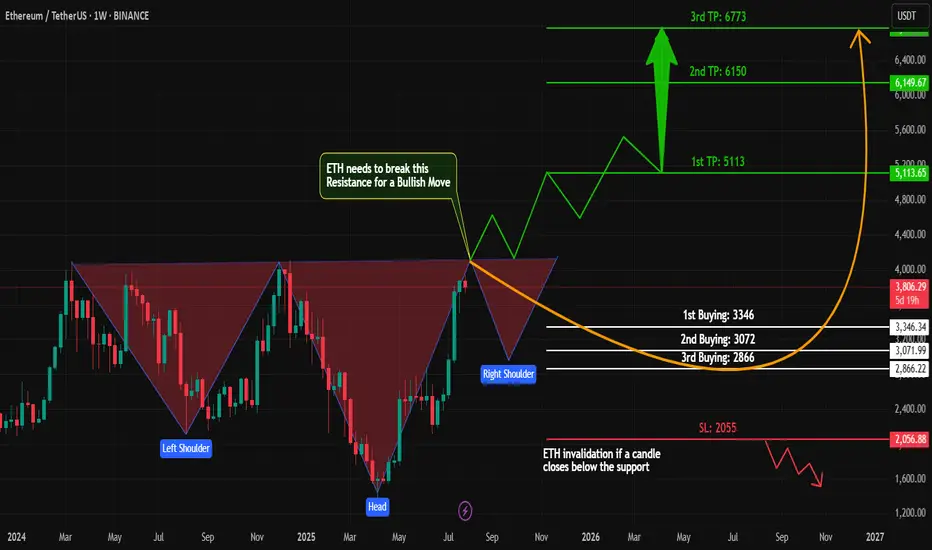
ETH Bullish – Inverse Head & Shoulders Pattern on Weekly Chart!Technical Analysis (Weekly Timeframe)
#Ethereum (ETH) is currently forming a strong bullish structure – the classic Inverse Head & Shoulders pattern – on the weekly chart.
✅ Left Shoulder ✅ Head
🟡 Now Printing the Right Shoulder...
This is a long-term spot trade setup, not for futures.
📈 Key Buy Zones:
1️⃣ First Buy: $3,346
2️⃣ Second Buy: $3,072
3️⃣ Final Support Buy: $2,866
We'll accumulate in these zones as #ETH forms its Right Shoulder.
🔓 Breakout Play:
Once #ETH breaks its All-Time High (ATH), we'll place a Buy Stop Order above the breakout level to ride the next big wave!
💬 Let me know what you think about this #ETH setup.
📌 Are you bullish on #ETH this cycle?
👍 Like, share & follow for more high-probability setups!
#ETH #Ethereum #CryptoTrading #TechnicalAnalysis #InverseHeadAndShoulders #LongTermTrade #SpotTrade #BullishCrypto #Altcoins #TradingView
Ethereum Returns to Key Resistance Zone After 401(k) NewsAfter last week’s panic selloff triggered by major payrolls revisions, Ethereum is now back at a key resistance level. The rebound has been fueled in part by President Trump signing an executive order allowing cryptocurrencies in 401(k) plans. With more than $12 trillion in assets, the 401(k) market could have a significant impact on crypto prices, even if only a small fraction flows into the sector. Bitcoin and Ethereum are likely to capture the lion’s share of these inflows, especially with ETF access already established.
Adding to the optimism, Axie Infinity’s co-founder recently stated that the project is considering a return to the Ethereum network, which could provide an additional boost.
However, it all comes down to the key daily resistance zone, which includes the 4110 horizontal resistance and the daily downtrend line at 3960. For Ethereum to fully kick off its next bull run, it will need to break and hold above the 3960–4110 zone.
