ETHUSDT.3S trade ideas

Exit Psychology – Reflections On The SeriesNOTE – This is a post on Mindset and emotion. It is NOT a Trade idea or strategy designed to make you money. If anything, I’m taking the time here to post as an effort to help you preserve your capital, energy and will so that you are able to execute your own trading system as best you can from a place of calm, patience and confidence.
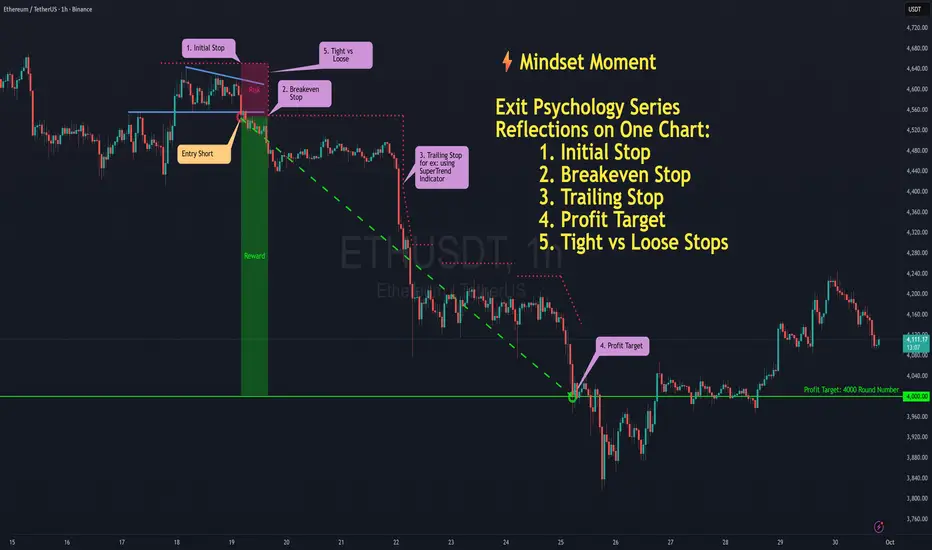
Over the last few posts we’ve walked through the psychology behind many exits. Here on this chart, you can see how they all might have played out on a single trade.
One trade, four different exits. Whichever you choose to implement isn’t just a technical decision - it’s a psychological mirror.
Taking each in turn:
The initial stop: the line where you admit, “The trade idea didn’t work”
The break-even stop: the comfort of “I can’t lose now.”
The trailing stop: the wrestle between protecting gains and letting them run.
The profit target: the choice between certainty and potential.
Put them all on the same chart and you’ll notice something: none of them are just about price. Each is a reflection of the trader making the call.
What we’ve uncovered in this series:
The initial stop tests whether you can accept being wrong on a trade idea without making it personal.
The break-even stop shows how much discomfort you’re willing to tolerate before reaching for relief.
The trailing stop mirrors your balance between fear of giving back and trust in your process.
The profit target surfaces your relationship with certainty versus possibility.
And tight vs. loose? That isn’t just a preference. It begins with trader type: your personality, values and beliefs set a natural baseline. It’s shaped further by how well your strategy fits that style. And in the moment, emotion (fear or hope) nudges you tighter or looser than planned.
The bigger reflection:
Exits reveal more than entries. They show how you handle:
Loss and regret.
Control and uncertainty.
Trust and identity.
Comfort and growth.
But reflection alone isn’t enough. To turn insight into progress, you need practical ways to anchor behaviour:
Pre-commit in writing: Note where you’ll exit before you enter, it closes the door to mid-trade negotiation.
Separate outcomes from emotions: Journal not just where you exited, but how you felt in the moment. Patterns emerge quickly.
Differentiate protecting vs. controlling: Ask yourself, “Am I moving this stop to protect the plan, or because I’m uncomfortable right now?”
Train the nervous system: Notice the physical urge to act and how it shows up in the body (ex: shallow breath, tense shoulders). Pause before execution and breathe. Slow down the ‘urge’ and re-train self trust.
These small practices are how you build the consistency to stay aligned with both your system and your psychology.
Closing thought:
The market doesn’t care where you exit. But your mindset does - and so does your account.
Clarity in those decisions is where growth begins and where your odds of staying in the game increase.
In the end, your edge isn’t only your system. It’s your state of mind - before, during and after engaging with the market.
I hope you’ve enjoyed this series. If so would love to hear in the comments.
Here’s a recap of the entire Psychology of Exits series in case you’d like to check out the details of each:
Exit Psychology 1/5 : The Initial Stop
Exit Psychology 2/5 : The Break-Even Stop - Comfort or Illusion?
Exit Psychology 3/5: The Trailing Stop – Patience vs Protection
Exit Psychology 4/5 : The Profit Target – Certainty vs. Potential
Exit Psychology 5/5: Tight vs. Loose
And finally here is the link to the original article by TradingView that inspired this series as promised:
p.s. Apols if anything is odd in this post, I have had to repost it.
Ethereum New Update (12H)On the chart, we have a bearish CH and a resistance SWAP zone has formed. This SWAP zone has been broken downward, and now on the pullback to this area, we can look for sell/short positions. As long as the price does not reclaim and hold above this zone, the bearish outlook on Ethereum remains valid
If the price strongly breaks TP1 to the downside, a much deeper drop may occur
A daily candle closing above the invalidation level would invalidate this analysis
For risk management, please don't forget stop loss and capital management
When we reach the first target, save some profit and then change the stop to entry
Comment if you have any questions
Thank You

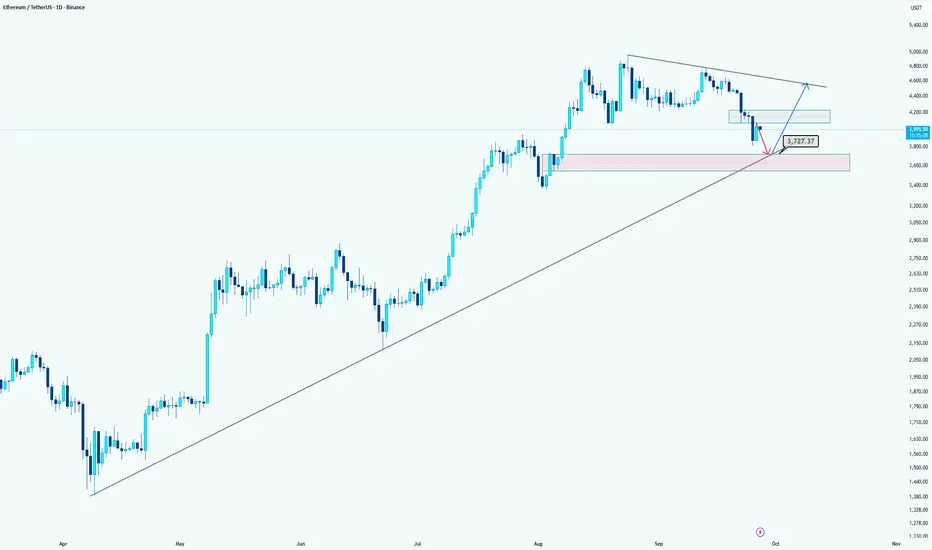
Ethereum: Levels to WatchHi guys!
Ethereum is currently showing weakness after failing to break higher. The price is likely to retest the MPL zone around $3727, which also aligns with the long-term ascending trendline, making it a strong confluence support.
The pink area highlights a potential demand zone where buyers may step in. If the market confirms bullish signals in this area, a long position toward the descending trendline resistance could be considered. However, extra confirmations are recommended before entering long.
Summary:
Short-term target for shorts: $3727 (MPL plus trendline support).
Watch the pink zone for potential long entries, but wait for confirmation.
Let's see what will happen!
ETH ideaETH has cleared the target zones from the previous plan and tapped the weekly key level, giving a solid reaction.
To me, this looks like manipulation below the range — now I’d like to see the same type of sweep to the upside.
We could get another dip early in the week if BTC tags the mentioned levels, but after that I’m expecting price to return back into the range.
Bigger picture — I’m looking for a push to new highs around 5K.

ETH finishing a re-accumulation for a last run?As the title and the graph show, looks like ETH is finishing up a re-accumulation pattern here. If so, things could get wild during a last HTF push up. I'll be sure to offload the boat during this (potentially) last HTF run.

Ethereum (ETH): Bounced Strong & Re-Testing EMAs | BullishETH bounced strongly from the oversold zone, and the recovery candle looks like a reaction to a liquidity grab rather than an actual dump. Price is now pushing back above EMAs, similar to the previous setups we saw in August (althought this time is is a little different)
The key now is a successful re-test of this reclaimed zone. As long as buyers hold structure and manage to break the zone of EMAs, the next step is continuation toward the $5,555 target.
Swallow Academy

ETH-USDTI talked about its rise yesterday and it is clear in the previous analysis
It rose to the resistance of 4770 ✔️🔼
But I think it needs a correction in the short term
I have identified two support levels for you 📊📉📉

ETH/USD on Support! Buy Setup!ETH/USD is testing a strong support. With an Instant Buy entry, we can take a 1:3 trade with low risk.

Ether / usd7Comprehensive analysis of Ethereum to start a new uptrend to complete wave 3 and its target. If the trend line breaks, expect a 1:7 risk-to-reward trade.

Trigger: 4h-close above 4732 (Donch-High)What does it mean now
1. The trend is strong: MACD↑, ADX ~51, CMF>0, candles above BB-Upper and above Keltner-Upper — the trend extension continues after the squeeze.
2. But: OI is falling (z168 < 0, ROC<0) → the movement is mainly driven by short covering/offer withdrawals, and its sustainability depends on the stabilization/growth of OI.
3. On the profile, we are at the upper limit of value (VAH ~4763); above is LVN ~4813 (a thin zone that can accelerate the breakout), and below is the POC magnet ~4497.
⸻
Key levels
• Resistances: 4732 (Donchian-High 20/55) → 4763 (VAH) → 4813 (LVN) → 4870-4900 zone (above LVN/narrow volumes).
• Supports: 4670/4666 (Keltner/BB-Upper — first edge) → 4583 (Donchian-Mid 20, ≈EMA20) → 4531 (Keltner-Mid) → 4497 (POC) → 4433 (Donchian-Low 20).
⸻
Scenarios and triggers (not the financial council)
A) Continuation of the upward trend (basic)
Why basic: strong trend (ADX~51), positive flows (CMF>0, MFI~67), MACD momentum↑, exit above BB/Keltner.
• Trigger: 4h-close above 4732 (Donch-High) + ~0.1·ATR ≈ +7$ → > 4739, with CMF>0, OBV z>0 and OI stabilization (does not fall).
• Targets: 4763 (VAH) → 4813 (LVN — thin acceleration corridor) → 4870-4900.
• Invalidator: a quick return below 4670/4666 (Keltner/BB-Upper) with a weakening of the MACD histogram and a drop in the RSI<65.
B) Rotation to the middle / balance
• Trigger: rejection of 4732–4763 (extended upper shadows) + 4h-close < 4670/4666, RSI goes < 60, MFI < 50, OI grows on the fall.
• Targets: 4583 → 4531 → 4497 (POC). If weak, 4433 (Don 20 Low).
C) Squeeze acceleration up (if shorts accumulate under 4750–4760)
• Trigger: breakout > 4739 on falling OI on a green candle (short-top) or a sharp increase in delta/OBV.
• Targets: 4813 → 4870–4900.
⸻
Tactics (example of logic)
• Impulse long: after fixing > 4739. Partial fixation at 4763, then trail to the area of 4813 → 4870–4900. Stop under 4670/4666 (or under the re-test level of the breakout).
• Reversal long (conservative): zones 4583–4531/4497 with signs of demand (candle reaction, CMF>0, OBV z>0). Stop under 4433.
• Contra-trend short: only with a clear rejection of 4732–4763 + RSI/MFI reversal down, MACD weakening and OI growth on the fall. Targets are 4670 → 4583 → 4531/4497; stop is 4765–4775.
⸻
Briefly: what to expect
• The basic expectation is for the trend to continue if it consolidates above 4739, with targets of 4763 → 4813 → 4870–4900.
• If we get a rejection and a close below 4670/4666, it is logical to rotate to 4583 → 4531 → 4497 (POC) to "reboot" the momentum.
• An important filter is OI: stabilization/growth will support the uptrend; a continued decrease in OI on growth increases the risk of a rollback to POC.

ETH Testing Descending Trendline — Targets 4,736 & 4,940Last week, Ethereum showed strong growth. The price is now right at a key descending trendline and trying to break through it. As long as the price stays above the SMA 50 , the green scenario remains in play, with targets at 4,736 and 4,940 .
If the SMA 50 breaks, there’s a high probability of the ascending trendline breaking as well, which could send the price down to the weekly pivot point at 4,404 . I expect support around this level, as the SMA 200 could also reinforce it.
After a successful bounce or a recovery above the pivot point, the next targets will be 4,600 – 4,700

Ethereum Chart updateTechnical analysis only indicates the fulfillment of certain conditions of a set of individual indicators that may help the user to spot potentially favorable conditions for a transaction if this is consistent with their strategy. You should not make a decision based solely on these ratings, but try and see the full picture of how well the asset is doing using other available information. Try reading related ideas to see what other users think, or check out our Crypto Coins Screener.

ETHUSDT.P - October 5, 2025This is a conservative set up for a potential continuation of the bullish trend.
Risk: Medium
Chance of Success: Medium to High
Entry Price: 4511.11
Profit Level: 5802.66
Stop Level: 3213.07

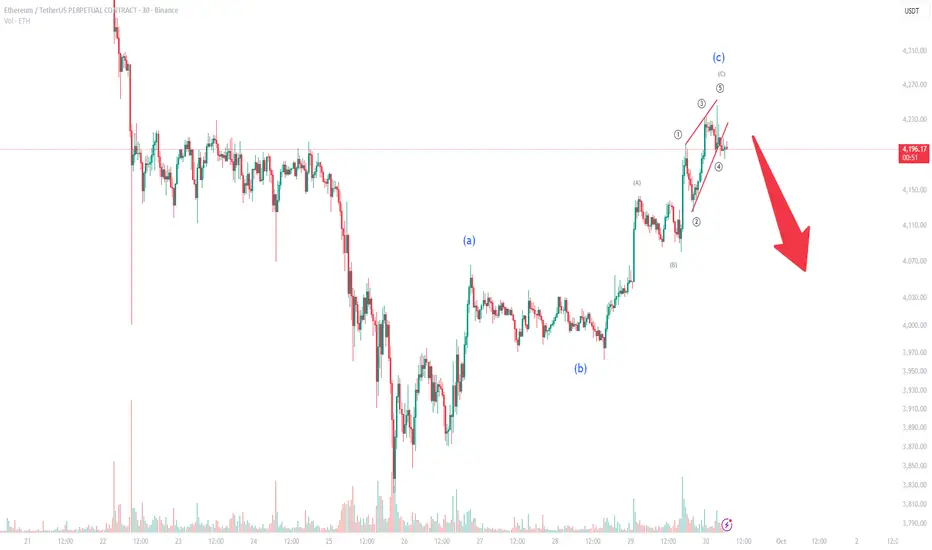
Ethereum Elliott Wave Update: Correction Ahead?Ethereum has recently completed the final leg of its ABC corrective structure, with the C-wave forming as a clear ending diagonal. This technical pattern often signals exhaustion in the current upward move and hints at a potential reversal.
With the structure now completed, a corrective move is likely. Current price action suggests that Ethereum could retrace toward the $4,000 support region, which aligns with both technical targets and key psychological levels.
📉 Trading Outlook:
Short-term traders should be cautious of potential downside volatility.
A corrective wave into the $4,000 zone may offer opportunities for repositioning or new entries depending on market reaction.
Risk management remains essential, as invalidation of the diagonal would occur if ETH pushes significantly higher without correction.
In summary, Ethereum’s Elliott Wave count points toward a possible short-term pullback before the broader trend becomes clearer. Traders should keep a close eye on the $4,000 level for signs of support and potential bullish re-engagement.
ETH HTF Butterfly HarmonicAs we can see, the Elliott Wave count for wave (V) is still incomplete. Combined with the Butterfly harmonic pattern, this suggests a target price in the range of $5,900–$6,400. The invalidation level is if wave (4) overlaps with the top of wave (1).

ETH - LONG SET-UPBINANCE:ETHUSDT
ETH Long Set-up
1️⃣Entry Between 4430-4500
SL below 4325
2️⃣ Entry Between 4200-50
SL Below 4100
Margin & Leverage as per your risk capacity

[SeoVereign] ETHEREUM BEARISH Outlook – October 05, 2025Hello everyone.
I hope you are all having a peaceful day.
Today, I am writing to share my short position perspective on Ethereum as of October 5th.
The first basis is the 1.13 Alternate Bat (ALT BAT). The Alternate Bat is a variation of the harmonic pattern established by Scott Carney, and its core principle lies in defining the PRZ (Potential Reversal Zone) where point D is located at 1.13 times the XA leg (=1.13XA). The convergence of these ratios creates a relatively narrow and reliable retracement (or reversal) zone, so when D is positioned around 1.13XA, it is necessary to carefully observe the potential for a short- or mid-term reversal.
The second basis is that an arbitrary wave N forms a 0.618 length ratio (that is, N ≒ 0.618 × M) with another arbitrary wave M. Among Fibonacci ratios, 0.618 (61.8%) is one of the representative standards used in Elliott Wave and harmonic analyses for measuring wave length and retracement. When one wave exhibits approximately 61.8% of another’s length, that point tends to act as a natural retracement or termination zone, and the reliability increases especially when it overlaps with other technical grounds.
Accordingly, the average target price is set around 4,415 USDT.
As the chart movement unfolds, I will provide updates on position management through revisions to this idea.
Thank you for reading.

Ethereum Price Approaches $4,500 Despite Crucial Holders’ ExitEthereum is trading at $4,383, just below the $4,500 resistance level. The altcoin king has attempted several times to secure $4,500 as a support floor but has not yet succeeded. This remains the most critical barrier in determining ETH’s near-term direction.
If inflows continue strengthening, ETH could break past $4,500 and secure it as support. Such a move would pave the way for a rise toward $4,775 and potentially retest the all-time high of $4,956. The continuation of this momentum would reinforce a strongly bullish outlook.
However, failure to breach resistance could change sentiment. Ethereum risks slipping back to $4,222 support, with the possibility of falling to $4,074. Such a decline would invalidate the bullish thesis and signal renewed weakness in the altcoin king’s price action.

Ethereum - too big to failIf you try to find top100 coinmarketcap coin list, you will be amazed by how many cryptocurrencies are now forgotten or even dead. Even 100M+ mcap coins die because they turn out to be merely speculative or scammy ventures. But one of the few that stayed on top of all the garbage was Ethereum.
It stayed on top of everything because it was the first crypto which created an ecosystem hosting multiple
"protocols" and tokens, which also helped crypto market grow not only in terms of market cap but infrastructurally.
So I believe it is now too big to fail, but not just because of ~400B. market cap but also due to how many project are based on top of EVM.
I think it might reach at least ~700B market cap during this cycle but later it will be among trillion mcap assets

Trigger: 4h-close < 4 486/4 464 (BB-Mid/KC-Mid) when RSI < 60Scenarios and triggers (not financial advice)
A) Basic - balance/rotation to the averages at 4.49-4.46 with an attempt to hold the uptrend.
Why basic: ADX is high and CMF>0 (the trend is alive), but MACD-hist is negative, OI↓, and we are close to the upper edges of BB/KC → more often, the market "breathes" down to the averages before continuing.
• Trigger: 4h-close < 4 486/4 464 (BB-Mid/KC-Mid) with RSI < 60 or weakening of the MACD histogram.
• Targets: 4 475 → 4 324; with inertia, 4 342 (POC)/4 140 (VAL).
• Cancel: quick redemption and consolidation above 4 592–4 604.
B) Continuation of the upward trend (accepting above the high zone).
• Trigger: holding above 4 55x–4 56x and 4h-closing > 4 618.9 with a buffer ≈ +0.1·ATR ≈ +7$ → > 4 626, while OBV z50 ≥ 0 and OI ROC(5) ≥ 0.
• Goals: 4 686 (LVN) → 4 727 (VAH) → 4 808 (LVN).
• Invalidator: return < 4 591 with an increase in OI on a red candle.
C) Acceleration downwards (explicit rejection from above).
• Trigger: false takeaway 4,591-4,619 (long upper shadows) + confirmed bearish divergences of RSI/MFI/OBV and OI↑ on the decline.
• Goals: 4 486 → 4 464 → 4 324; if weak, test 4,342 (POC) and only then 4,140 (VAL).
⸻
Tactics (example of logic)
• Reversal long: zones 4 486 / 4 464 with signs of demand (candle reaction, CMF≥0, OBV z50≥0). Targets: 4 592–4 604 → 4 619; stop under 4 464 − 0.3×ATR ≈ 20$.
• Impulse long: after fixing > 4 626. Partial fixation at 4 686, then 4 727/4 808; trail on EMA20/KC-Mid.
• Contra-trend short: only when 4 591–4 619 is rejected + divergence and MACD-hist↓, OI↑ on the fall. Targets: 4,486 → 4,464 → 4,424–4,324; stop at 4,626–4,635.
⸻
Briefly: what to expect
The trend is strong (ADX), the demand is positive (CMF), but the momentum is cooling, the OI is decreasing, and the price is stretched towards VWAP/BB-Upper. I expect a basic balance/rotation to 4.49→4.46, after which the market will decide:
• Fix above 4 626 → chance for 4 686 → 4 727 → 4 808.
• Fall below 4 464 → 4 324, with weakness at 4 342 (POC)/4 140 (VAL).
ETH/USDT -> Clear Head & Shoulders → bearish biasHello guys!
Pattern: obvious Head & Shoulders on the 4-hour. The neckline was taken out by a large bearish candle, which is a good confirmation of the breakdown.
Retest: price is testing the broken neckline/supply zone (blue box). The current action is a classic retest → if it gets rejected here again, probability favors more downside.
Target: the measured move projects into the red box; roughly ~$3,850 (range $3.7k–$3.9k depending on where you measure the neckline/head). This level also lines up with the last major resistance zone, so it’s a natural magnet.
Momentum: RSI showed divergence around the head and has dropped into oversold territory with a small relief bounce.
Invalidation: a clean, sustained reclaim and close back above the blue supply zone (above ~4.32–4.40k with conviction) would invalidate the immediate H&S bearish thesis and open the door for a deeper retrace.
-----------------------
A simple trade idea:
Short on a failed retest of the blue box (4.20–4.32k) after a bearish price candle.
Stop: just above the supply zone / last swing high.
Targets: scale profits into 3.9k then 3.8k (final target ~3.7–3.9k). Trail if price action turns constructive.
Manage risk: keep position sizing sensible.

ETH Price Action Looks Heavy – Danger Ahead?This chart is showing a clear pattern of accumulation followed by decline. Every time price moves sideways in a box range, instead of breaking upward with strength, it rolls over into another drop.
What this tells us is that the market is using these sideways phases as resting points for sellers to reload, not buyers to take control. Until CRYPTOCAP:ETH can break out of this cycle and hold above one of these consolidation zones, the overall trend remains heavy to the downside.
DYOR, NFA
#PEACEFUL
Follow for more updates and market insights on TradingView
