Double Tops = LIES. Market Structure is a ScamRetail traders call it resistance.
Smart money calls it liquidity.
This is why price comes back to the highs
Not for confirmation. But for your stop loss.
ETHUSDT.3S trade ideas

ETHUSDT 2DFollowing its recent rally, Ethereum has entered the critical $3,800 – $4,000 zone — a level that previously acted as a strong resistance and now serves as a key support area.
🔹 If price holds and consolidates above this level, the bullish momentum could extend toward $4,800 and $5,600, with long-term targets at $6,000 and $6,400.
🔹 However, a breakdown below $3,800 may trigger a deeper correction toward the $3,200 – $2,800 range.
This zone represents a decisive point for Ethereum, and its reaction here will determine the next major direction of the market.

#ETH is on a mission New ATH#ETH is on a mission to reach its new all-time high (ATH).
First, it may liquidate some long traders, then fill the order blocks of smart buyers before creating a new ATH.
~Namaste~
$ Jai Shree Ram $

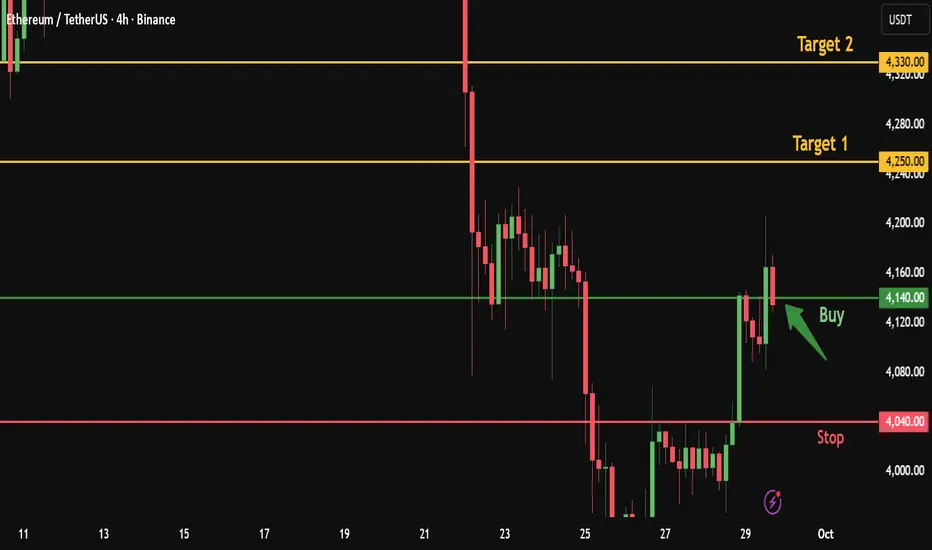
Ethereum Quick Buy from Broken Resistance – Targeting 4330After Ethereum broke the 4140 resistance with a bullish 4H candle and reached 4205, the price has now retested the broken resistance at 4140.
This level acts as a strong entry point for a long position, aiming for higher targets.
Here’s my personal trade plan:
✅ Entry : Buy from current price 4140
🎯 Target 1: 4250
🎯 Target 2: 4330
Stop-loss: 4040
👍 Don’t forget to boost this trading idea if you found it helpful,
and follow me for more daily crypto insights and trade signals.
Please note:
This is not financial advice – I’m only sharing my personal trades.
Always do your own research before taking action.
Best of luck 🌹
#ETHUSDT 6H ChartPrice moved up from the 4h demand zone at $3,850 and it is currently getting rejected off a 6h supply zone. MACD is bullish, RSI is bought and EMAs are bearish. Price needs to break and close above this 6h supply to expect further upward movements towards the next 6h supply at $4,450.

ETH market snapshotFor ETH to continue its upward movement, it needs to break above 4200. Currently, the attempt to approach resistance looks weak and unconvincing. Support is at 3900, but on the next test, there’s a high chance it could fail down to 3500–3600

Never miss Eth on 4160 !I am all eyes on Eth to break my trigger line (around 4230). then the buy setup on 4160 will be activated :)
First midterm target --> 6300

ETH Trade Update📊 Current Setup
My limit long on ETH got triggered with that bullish push we saw at the start of the week. But here’s the play — I closed it out at break-even. No loss, no gain 💯. Why? Because this bullish leg ain’t showin’ me the structure I wanna see. No bearish reversal forming inside this move, so no clean setup yet.
🚦 Next Moves
👉 I’m waiting for a clearer structure to form.
👉 If we get confirmation of a bullish trend reversal, I’ll hop back in long 🌊🚀.
👉 If instead the market sets up a better short structure, I’ll load up there 😈📉.
🧭 My Take
Patience over forcing trades. Right now ETH feels like it’s in “prove it” mode — I’d rather wait for the wave to shape up than wipe out on chop 🤙.
💬 What do you think about this scenario? Only share your idea if you’ve got another opinion — otherwise just hit that button 👍

Ethereum’s $4K Battle: What's Next?CRYPTOCAP:ETH is currently retesting a strong support level on the weekly timeframe, previously acting as resistance, around the $4,000 mark.
If Ethereum holds this support, we could see a potential bounce back towards higher levels. However, if the price fails to hold, further downside may test lower support areas.
This could be a pivotal point for Ethereum’s next move, so monitoring this zone is essential for short- or long-term strategies.
DYOR, NFA
#PEACE

$ETH Analysis🚨 CRYPTOCAP:ETH Analysis 🚨
Still waiting for the setup to fully play out 👀
✅ Long plan: sweep of the recent low before entering
❌ Short plan: looking for a bearish reaction at the 4H FVG or bearish OB 🔥
Patience here could pay off big — no need to rush 🚀

ETHUSDT #009 (Be careful, need 15-20% correction for next cycleHello dear traders.
Good days.
First of all thanks for your support and comments.
————————————————————————
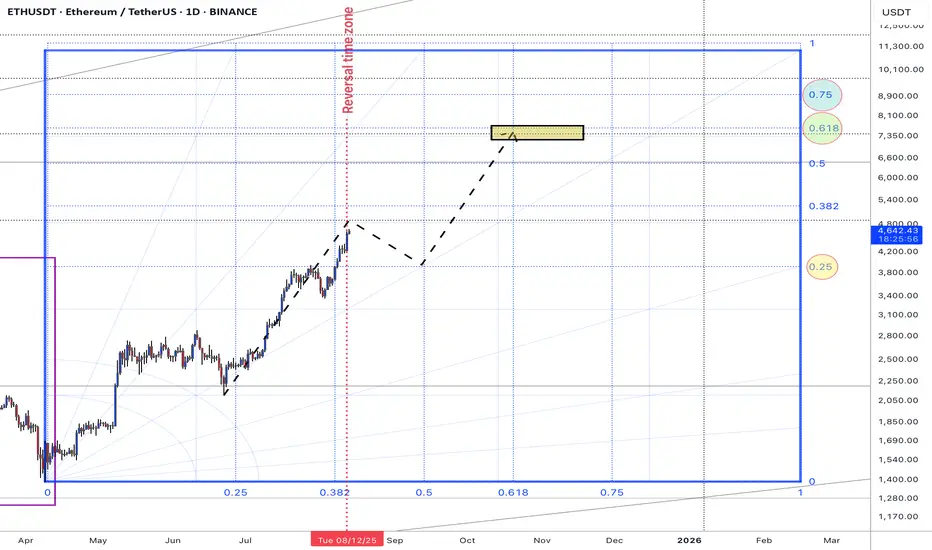
On daily Gann Square ETHUSDT break out 0.5 Gann Square price zone and with good strength trend line support it expected to fill 0.618 Gann box price level at exact reversal time zone .
So be careful and do not be FOMO . expected to grow up to 4800$ and correct 15-20 % correction for retest 0.5 Gann price zone .
If support at 3940-3915 $ will grow up fro next bull cycle .
BTC Dominance is mached also at exact time with ETHUSDT .
Weekly overview of ETHUSDT Chart will updated.
Good luck and safe trades.
The #1 Reason This Is A Strong Support Am currently thinking of the worse case scenario..
What if I fail in business?
What if I face a family crisis? For example the death of a family bread winner
What if Bitcoin or Ethereum or Pepe coin get delisted on the exchange?
Imagine this happens to you when you have borrowed 💰 money
On the price of Bitcoin going up.
Hoping to use that money to support your business or financial independence?
Life is full of challenges and you have to burn the ⛵ boat.
Now don't get reckless and place all your eggs in one basket.Thats foolishness right?
Well that's what I did I placed all my eggs in one basket.Atleast in the beginning.
Why ?
Because diversification is fake..
It doesn't exist.
What matters are systems and strategies.
With out the right mentors you will fall hard this is what happens to the best of us.
The key is to stay cool and fall back on a system.A system you can hang on to.
Ethereum has its faults but if you can trade it with confidence you will be okay.
Especially if you have a hardware wallet to store it in.
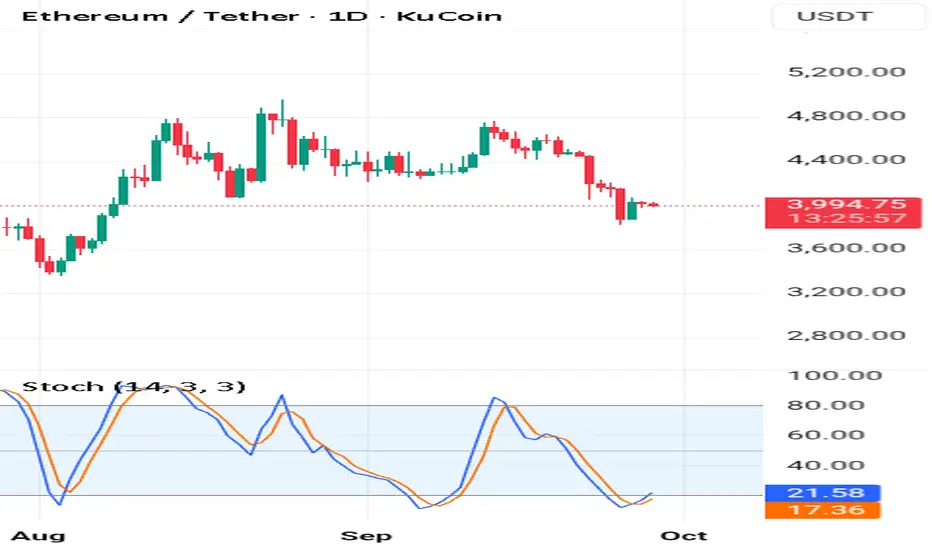
Look at the stochastic the blue line has crossed above the orange line.
Right below level 20 the oversold territory.
This has came after the bullish harami and so far the price is yet to break this support.
The bullish harami support is strong that the reason it's a good buy.
Rocket 🚀 Boost This Content To Learn More
⚠️Warning!!! Don't trade zero day options that expire in one day with high fees for forex trades.
Disclaimer ⚠️ Trading is risky please learn about risk management and profit taking strategies. Also feel free to use a simulation trading account.
ETH Elliott Wave - WXY Correction Complete soon!This chart analyzes Ethereum (ETHUSD) at the conclusion phase of a major WXY corrective structure, highlighting the technical environment for a new impulsive wave sequence. Price action is assessed using multiple technical indicators:
Elliott Wave Structure: The chart maps a completed 1-2-3-4-5 impulse, followed by W–X–Y corrective waves. The final Y leg approaches the critical Point 4 support, maintaining overall cycle validity and setting the stage for significant trend reversal once completed.
Ichimoku Cloud: ETH price is currently testing the lower bounds of the Ichimoku cloud, reinforcing a major support zone. A close above the cloud would further validate trend reversal; a breakdown would signal extended bearish pressure.
Volume Profile: Recent sessions show a spike in trading volume as price approaches historical support levels, indicating potential capitulation and increased probability of trend exhaustion.
Fibonacci Retracement: Key supports are identified at the 38.2%, 50%, and 61.8% levels, with the 38.2% zone (around $3,600) as a strong candidate for final Y wave completion based on confluence with cloud and momentum indicators.
RSI and Stochastic RSI: Both relative strength oscillators are in oversold territory, consistent with the final stages of a corrective structure. A bullish crossover or RSI divergence would strengthen the reversal thesis.
CVO/OBV: Volume-based momentum indicators confirm heavy participation during the latter stages of the sell-off, validating the probability of a strong bounce once buyers re-enter.
Scenario Outlook:
The analysis anticipates that, upon completion of the WXY correction—ideally above the Point 4 support (roughly $3,350)—Ethereum is set for a new impulsive uptrend as part of the final bull market rally. The setup favors strategic accumulation in the defined support zones, with projected upside targets ranging from previous all-time highs (~$4,950) to extended Fibonacci projections should the market move through a classical 1-2-3-4-5 impulsive wave.

Ethereum's Scenarios for the Week Ahead??The key points are indicated in the chart. And if the stop point is broken downwards, the next stop will be $3370 and there is a high probability of a deeper drop. However, if the price of Ethereum breaks above $4251, this scenario will be invalidated, which is unlikely but not impossible.

Ethereum Analysis – Climbing Step by Step🚀 Ethereum (ETH/USDT) Analysis
📌 The purple line shows my own projection.
📌 The small rectangles represent a steady, step-by-step growth in price.
📌 This structure on the chart indicates that the market is gathering strength at certain levels before moving higher.
✨ In short, the market seems to be recharging with corrections and getting ready for new highs.
👉 Target zones are marked above. Let’s see if my projection plays out!
💡 Do you think this scenario will happen? Or will the price take another path?

Ethereum. Watching the 3,880–4,060 Zone: Setup for a New ATH?Hi traders and investors!
This analysis is based on the Initiative Analysis concept (IA).
The price has entered the 3,880–4,060 range — the scenario I was waiting for in the related post.
The September 25 seller candle is an IC candle and shows the highest volume since August 22.
And with September — typically a weak month for asset growth — coming to an end, we watch closely.
On the daily timeframe, the price is in a sideways range. The black lines mark the boundaries of this range. We’re waiting for the price to return back inside, absorb the seller’s candle that broke the lower boundary, and then it will be possible to look for buy setups targeting a new local ATH.
Wishing you profitable trades!

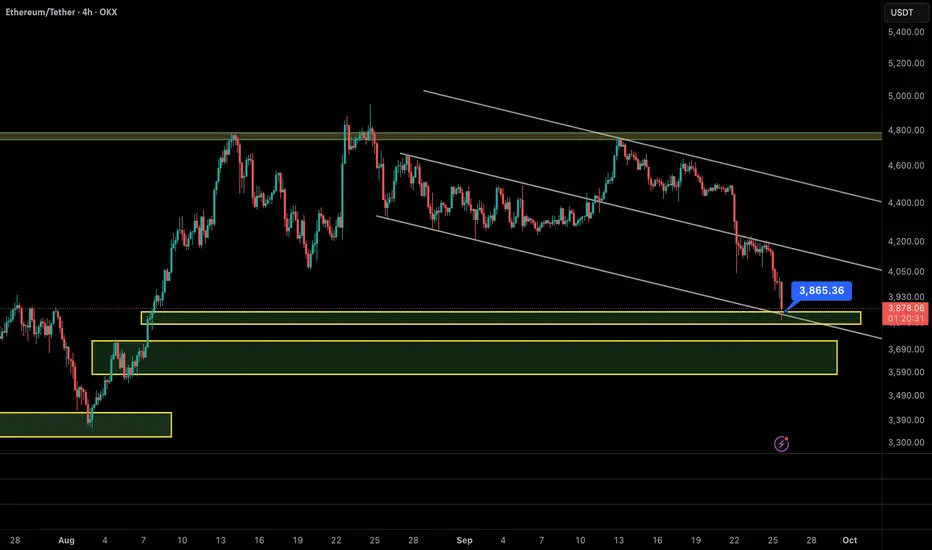
Ethereum (ETH/USDT, 4H) – Bounce Setup After Textbook Drop In my previous analysis, I highlighted the $4,700–$4,800 zone as a critical resistance cluster. ETH was rejected exactly from $4,720 and dropped sharply to $3,850, just as projected. ✅
⸻
🔎 Current Outlook:
• ETH has now reached the lower boundary of its descending channel.
• Price is sitting right on the $3,850 support zone, where buyers are showing early signs of activity.
• Momentum indicators suggest that the downside pressure may be exhausting, increasing the probability of a relief rally.
⸻
📊 Scenarios:
🔸 Bullish Reversal (more likely):
If $3,850 holds, ETH could rebound toward:
• First target: $4,100–$4,200
• Extended target: $4,400
🔸 Bearish Case (alternative):
A clean breakdown below $3,850 would expose the next demand zone at $3,600–$3,700.
⸻
📌 Conclusion:
After a sharp and accurate rejection from $4,720, Ethereum is now testing strong support at $3,850. Given the confluence of channel support and demand, the odds favor a bounce scenario over continued downside.
Ethereum — The Big Wave Towards New Highs, Bullish 10k?📝 Full Analysis
Ethereum (ETH/USDT) on the 1W timeframe is showing a clear 5-wave Elliott Impulse structure. Currently, price is assumed to be in the (4) corrective phase after wave (3) peaked around the 4.9k–5k zone.
Wave (4) is now retesting the critical support zone between 3.21k – 3.54k, which perfectly aligns with the Fibonacci retracement 0.5–0.618 levels. This area also acts as a key demand zone (previous resistance now flipping into support).
If this zone holds, ETH is well-positioned to start wave (5), targeting new all-time highs. But if this level breaks, ETH could fall into a much deeper corrective scenario.
---
🔑 Key Levels on the Chart
Main Support (yellow zone):
0.5 = 3,541
0.618 = 3,210
Bullish Extension Targets (Wave 5):
0.5 = 4,940
0.618 = 5,272
1.0 = 6,345
1.618 = 8,082
2.618 = 10,891
These are not just Fibonacci levels, but psychological points where the market often decides whether to continue or reverse.
---
📈 Bullish Scenario
1. Support 3.21k–3.54k holds → confirms wave (4) completion.
2. ETH prints a weekly rejection candle or bullish engulfing → buyer strength confirmed.
3. Breakout above 4.95k activates bullish momentum with staged targets:
Target 1 → 5.27k (0.618 extension)
Target 2 → 6.34k (1.0 extension)
Extended Target → 8.08k (1.618 extension)
Maximal Target → 10.9k (2.618 extension, potential new ATH)
4. Wave (5) is often accompanied by volume surge & market euphoria → a prime opportunity for swing traders and mid-term investors.
---
📉 Bearish Scenario
1. ETH closes below 3.21k weekly → weakens bullish wave structure.
2. Possible deeper retracement:
2.13k (0.5 retracement from macro impulse)
1.95k (0.618 retracement)
3. If ETH breaks below ~1.95k, the 5-wave Elliott structure becomes invalid, and the market could enter a prolonged accumulation/sideways phase similar to 2018–2019.
---
🔍 Pattern Breakdown
Elliott Impulse Wave (1–5) with strong extended wave (3).
Fibonacci retracement & extension for precise S/R validation.
Resistance → Support Flip Zone (3.2k–3.5k).
Potential Bullish Flag Structure (macro) if wave (4) is confirmed as a healthy correction.
---
🎯 Extra Insights
Wave (5) is usually shorter than wave (3) if wave (3) was already extended → realistic target sits around 6.3k–8k.
If crypto market euphoria (ETH ETF narrative, altseason) kicks in, then 10k+ ETH becomes a valid macro target.
Caution: wave (4) often forms complex corrections (flat/triangle), meaning sideways consolidation before the breakout.
---
🛡️ Trading Notes
Conservative entry: wait for weekly rejection confirmation at 3.2k–3.5k.
Aggressive entry: buy the dip in support zone with tight stop below 3.2k.
Breakout entry: wait for breakout + retest above 4.95k.
Take profit progressively: 5.2k → 6.3k → 8k.
---
Ethereum Weekly is forming a 5-wave Elliott Impulse. Currently, price is testing the critical support zone at 3.21k–3.54k.
If this zone holds → ETH is ready for wave (5) rally targeting 5.2k → 6.3k → 8k → even 10.9k.
If this zone fails → ETH risks a deeper correction towards 2.1k–1.95k.
This is the decisive moment for ETH: either break into new ATHs or enter a prolonged correction.
Not financial advice — manage your risk.
---
#Ethereum #ETHUSDT #CryptoAnalysis #ElliottWave #Fibonacci #CryptoTrading #SwingTrading #WeeklyChart #PricePrediction #AltcoinSeason

ETH Trade Plan 27/09/2025Dear Traders,
📊 Ethereum (ETH) Technical Analysis
As shown on the chart, ETH has broken out of the upper range box and is currently making a pullback.
🔻 If this breakout is not a false trap, we could see a decline toward the key levels of 3700 – 3500 – 3400.
💡 Such a heavy drop would create a strong buying opportunity at lower prices, potentially leading to a new all-time high 🚀.
🟢 Support levels: 3700 – 3500 – 3400
🔴 Resistance: Previous broken box high
Regards,
Alireza!

ETH 4H Analysis - Key Triggers Ahead | Day 28❄️ Welcome to the cryptos winter , I hope you’ve started your day well.
⏰ We’re analyzing BINANCE:ETHUSDT on the 4-Hour timeframe .
👀 On the 4-hour chart, after the recent drop, Ethereum managed to hold above $3,900 thanks to support from its maker-buyer zone. Price is currently trading below a key resistance at $4,034. A breakout and confirmation above this level could lead ETH toward its next major trend-shift resistance.
The primary resistance for initiating a new bullish leg sits at $4,133. A break and stabilization above this zone could trigger a solid upside move, potentially extending toward the $4,800 area.
🧮 The RSI oscillator shows that during the recent sell-off, ETH dipped twice into deep oversold territory, with significant time spent under selling momentum. The key RSI zone now is the 50 baseline, which acts as resistance. A momentum break above this level would support price stabilization over $4,034, and allow ETH to retest and potentially break its resistance on the way to the overbought zone.
🕯 The candle size and volume on the rebound from the maker-buyer support have been reasonably strong, suggesting that ETH has likely established a key floor around $3,837. As price approached the $4,034 resistance, red candles have become smaller — signaling weakening bearish pressure and absorption of sell orders at that zone.
Given the weekend environment, volume has cooled off, and price is moving in a range. With the start of the new week, increased volume could spark a breakout, and trader reaction on ETH may be notable.
💸 The BINANCE:ETHBTC pair is also sitting below a key resistance zone. A breakout and confirmation here could shift ETH’s trading behavior and momentum. On RSI, the pair is around the 50 level, showing reduced volatility due to weekend conditions.
The first key resistance is at 0.03687. A breakout and confirmation above this level could support a long setup on ETH. However, the critical resistance sits at 0.03853 — which aligns with the pair’s overbought potential. Breaking and stabilizing above that level would likely trigger notable bullish continuation, but only if RSI enters the overbought zone as confirmation.
🧠 Since CRYPTOCAP:USDT.D recently rejected from 4.72% and Bitcoin has shown some support, Ethereum now holds a reliable floor that can be used for long setups once the specified resistances break. Two main scenarios are in play:
1️⃣ Scenario 1: We need a higher-timeframe candle close above key resistance, starting with $4,034, which also aligns with RSI’s 50-level resistance.
After that, spotting a multi-timeframe indecision candle could allow an entry with controlled risk.
Upon a confirmed break of the major resistance at $4,133, or signs of trend reversal, additional position size can be added.
Essentially, we require a higher low above $4,034, enabling formation of a higher high and eventual breakout through $4,133.
2️⃣ Scenario 2 : A short on ETH is less favorable due to strong buying interest at current levels and weaker risk-to-reward. However, if price breaks and confirms below the key support and maker-buyer zone, a deeper correction could follow.
❤️ Disclaimer : This analysis is purely based on my personal opinion and I only trade if the stated triggers are activated .

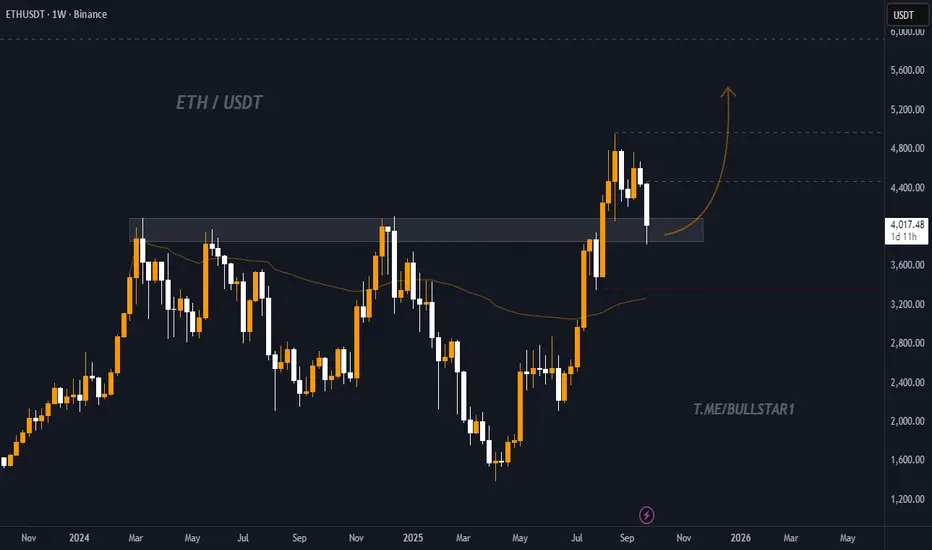
ETH/USDT – Weekly Support Retest Before ContinuationEthereum (ETH) on the 1W chart has pulled back to a key resistance-turned-support zone around 3,800 – 4,000 USDT. This level also aligns with the 50-week moving average, creating a strong liquidity and demand area.
After a sharp rally towards 4,800 USDT, the price is currently correcting and consolidating above support. As long as this zone holds, a bullish continuation towards higher targets is expected.
🔑 Key Idea
As long as ETH holds above the 3,800 – 4,000 USDT zone, upside momentum remains valid.
A breakdown below this level would invalidate the mid-term bullish scenario.
📈 Targets:
Target 1: 4,400 USDT
Target 2: 4,800 USDT
Target 3: 5,200 USDT
⛔ Stop Loss:
Below 3,600 USDT to limit downside risk if support fails.
ETHUSDT - Faces Downtrend👋Hello everyone, glad to see you again. Let’s take a look at BINANCE:ETHUSDT !
Currently, Ethereum is moving in a clear downtrend. After breaking through the support zone, the decline has intensified. The current resistance levels are around 4,300 USD and 4,450 USD. If the support at 4,100 USD is not held, ETH may continue to experience further correction.
With the Fed's rate cuts and geopolitical issues like the Russia-Ukraine conflict increasing market instability, capital is flowing out of riskier assets like cryptocurrencies. This will continue to put downward pressure on ETH.
Unless there's a reversal from this zone, the strategy and scenario mentioned above seem likely. My target is a short-term price decline. What about you?
Feel free to leave your thoughts in the comments below.
Good luck!

Peter Schiff bearish posting about Ethereum at S/R levelInteresting to see FUD at S/R levels
Short support & sell the bottom
Trade your charts not others opinions
