ETHUSDT 1D chart review📊 1. Main trend
• The chart shows a long -term movement in the inheritance trend channel in which the price is currently fighting for the mountain, but here you can see that the inferior canal limit is a strong resistance for the price.
⸻
🧠 2. Medium walking
• We see the cut SMA 50 and SMA 200 (so -called Golden Cross) - this is an upward signal in day interval.
• EMA 50 (green) is approaching the intersection of EMA 200 (red) - if the growth cross is confirmed, it may mean further growth time.
⸻
💹 3. Horizers of support and resistance
Support:
• 4,034 USDT - strong level, defended after the last inheritance.
• 4,252 USDT - short -term support (after breaking above trendline).
Resistance:
• 4 720 USDT - local resistance, previously rejected several times.
• 4,966 USDT - next strong resistance (local peak).
If ETH pierces 4 720 with a volume, the road opens towards 4,950-5,000 USDT.
⸻
⚙️ 4. Indicators
Macd:
• The histogram grows green → growth momentum.
• The MacD line cut the signal line from the bottom → buy signal.
RSI:
• RSI around 60, which indicates the advantage of bulls, but without buying out.
• If the RSI pierces 70, a short -term pullback may occur.
ETHUSDT.3S trade ideas

EtheriumEtH usdt daily analysis Time frame hourly Risk rewards ratio >2.3 👈👌
Target 4474$
Move up and down in the rectangle and waiting for good news to pump
I set my SL too far to scrap of sl hunting

Etherium ETH usdt daily analysis
Time frame 4hours
Risk rewards ratio >4.3 👈👌
Target 5.748$
I think this target is final target for this bullrun .
The 5th wave.

ETH I think it has reached a resistance level from which I thinkI think it has reached a resistance level from which I think it will fall.
ETH: Drop from $4334On September 22, Ethereum turned downward from the $4334 level on the 1-hour timeframe. The move was strong: the price broke through all four profit-taking stages and reached $3819, giving a difference of more than $500 per coin. Those who held the trade systematically captured a result that would have been painful to miss.
I managed the trade step by step: the algorithm highlighted key profit zones and moved the position to breakeven in time. This removed emotions and allowed me to focus on strategy rather than doubts. Such an approach works like a navigator — the road is clear in advance, even when the market throws sharp turns.
An interesting fact: most financial indicators are based on mathematical formulas that exclude the psychological factor. That’s why discipline and algorithm often outperform intuition. In my experience, the win rate for Ethereum trades stays above 80%, and this case only confirmed that statistic.
The market will always look chaotic to those who act emotionally. But when the process is built on a system, trading shifts from guessing to a structured process, where results are defined by discipline.

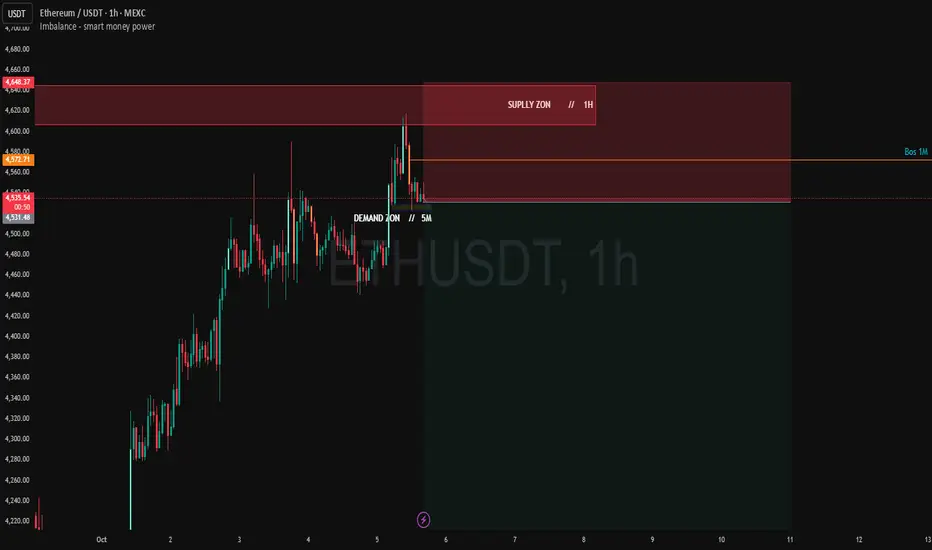
ETHUSDT Short - Trendline Rejection & Breakdown Below ConsolidatI’ve entered a short position on Ethereum after clear technical confirmation on the 1H chart.
Reasoning:
🔹 Trendline Rejection: Price took a strong rejection from the descending trendline, showing sellers are defending the upper zone.
🔹 Consolidation Breakdown: After a period of sideways movement, ETH closed below the recent consolidation range, confirming bearish continuation.
🔹 Momentum Shift: The candle close below structure indicates weakness and potential for further downside movement.
Trade Setup:
📍 Entry: 4,468
⛔ Stop Loss: 4,510
🎯 Target: 4,291
As long as ETH stays below 4,510, my view remains bearish. A breakout above that level will invalidate this setup.


Trigger: 4h-close < 4 422–4 416 (BB-Mid/KC-Mid) and RSI < 60 What does it mean now
1. The trend is strong (ADX≈50, CMF≫0), but the MACD has cooled down, OBV-ROC<0, and OI is falling → momentum is dragging on inertia, and there is little "fuel" for new positions.
2. We are on/near POC ~4 492 (magnet). This often leads to balancing/sawing around POC with pokes to KC-Mid/BB-Mid.
3. RSI66 / MFI73 and z(Price−VWAP)~+1.1σ → moderate upward stretching: for a sustainable upward continuation, we would like to see stabilization/growth of OI and resumption of growth of OBV.
⸻
Key levels
Resistance: 4 553 (KC-Upper) → 4 592 (Donch-High 20/55) → 4 619 (BB-Upper) → 4 765 (VAH).
Support: 4 422 (BB-Mid) / 4 416 (KC-Mid ≈ EMA20) → 4 357 (Donch-Mid20) → 4 278 (KC-Lower) → 4 177 (VAL) → deeper 4 052 / 3 968 / 3 863 (LVN-pockets).
⸻
Scenarios and triggers (not the financial council)
A) Basic — POC balance with punctures, rotation to the middle.
Why basic: on POC, OI↓, MACD-hist <0, a series of bearish divergences on oscillators, while the trend is strong (ADX/CMF) — the market often breathes through returns to averages rather than accelerating immediately.
• Trigger: 4h-close < 4 422–4 416 (BB-Mid/KC-Mid) and RSI < 60 / MACD-hist does not grow.
• Targets: 4 357 → 4 278 → at inertia 4 177 (VAL).
• Cancel: hold above 4 500+ and re-attack 4 553/4 592.
B) Continuation of the up-trend.
• Trigger: fixing > 4 592 with a buffer ≈ +0.1·ATR ≈ +7$ → > 4 599, when OBV z50 ≥ 0 and OI ROC(5) ≥ 0.
• Goals: 4 619 (BB-Upper) → 4 700–4 740 → 4 765 (VAH); with a good OI↑, it is possible to extend to the LVN-thin zones of 4 807+.
• Invalidator: a quick return < 4 553 and a failure to 4 500–4 480.
C) Acceleration downwards (failure from above).
• Trigger: false exit 4 553–4 592 (long upper shadows) + OI↑ on a red candle, MACD-hist ↓, confirmation of bearish divergences RSI/MFI/OBV.
• Targets: 4 416 → 4 357 → 4 278; if weak, test 4 177 (VAL).
⸻
Tactics (example of logic)
• Reversal long: at 4 422 / 4 416 with signs of demand (CMF≥0, candle reaction, OBV z50≥0). Targets: 4 553 → 4 592; stop below 4 357 (buffer ~0.5×ATR ≈ 34$).
• Momentum long: only after consolidation > 4 599. Partial fixation at 4,619, then 4,700–4,740/4,765; trail by EMA20/KC-Mid.
• Counter-trend short: when 4,553–4,592 is clearly rejected + bearish divergences, OI↑ on the fall. Targets: 4,422 → 4,357 → 4,278; stop at 4,605–4,615.
⸻
Briefly: what to expect
The strong uptrend continues, but the momentum is cooling, the OI is decreasing, and we are at POC. I am waiting for a balance/rotation to the average of 4 42x → 4 35x, from where the market will decide whether to restart upwards with OI/OBV support or move to 4 28x → 4 177.

Eth Update📈 Ethereum (ETH)
According to Bitget’s daily technical ratings, ETH leans Buy: moving averages are mostly bullish, though some oscillators are mixed.
On TradingView, ETH is in a consolidation zone, and a bullish MACD crossover is being watched as a possible trigger for a move up (~10-12%) in the near term.
Coinalyze shows ETH is trading under its 20 and 50 EMA in shorter timeframes, which suggests some resistance overhead.
Insight: ETH is balancing between resistance and support zones. If buyers break above the near-term resistance with volume, we could see continuation. But weakness below key MAs could tilt momentum back to the downside. Be alert for a breakout signal.

Ethereum (ETH/USDT) — Decision Point at $4,760–$4,960Ethereum is testing the $4,760–$4,960 resistance zone inside its long-term ascending channel.
🔼 Bullish case: A daily close above $4,960 opens the path to $5,500–$6,300, targeting the upper channel.
🔽 Bearish case: Rejection here could pull ETH back to $4,000–$4,100, with deeper supports at $3,200–$2,800 and $2,130.
ETH follows BTC’s momentum — but U.S. macro risks (shutdown, Fed uncertainty) keep downside risk alive.
⚖️ Summary: ETH is at a decision point — breakout above $4,960 = bullish continuation, rejection = bearish retrace.
❗ Not financial advice — only my personal view.

ETH market snapshotETH has broken above the key $4,250 level and is now hesitating. If we keep consolidating here today/tomorrow, it will signal buyer weakness and likely send us back to retest $3,800. For now, I see this as just a correction within the broader downtrend from the highs. I’ll reconsider my view only if we move above $4,500.

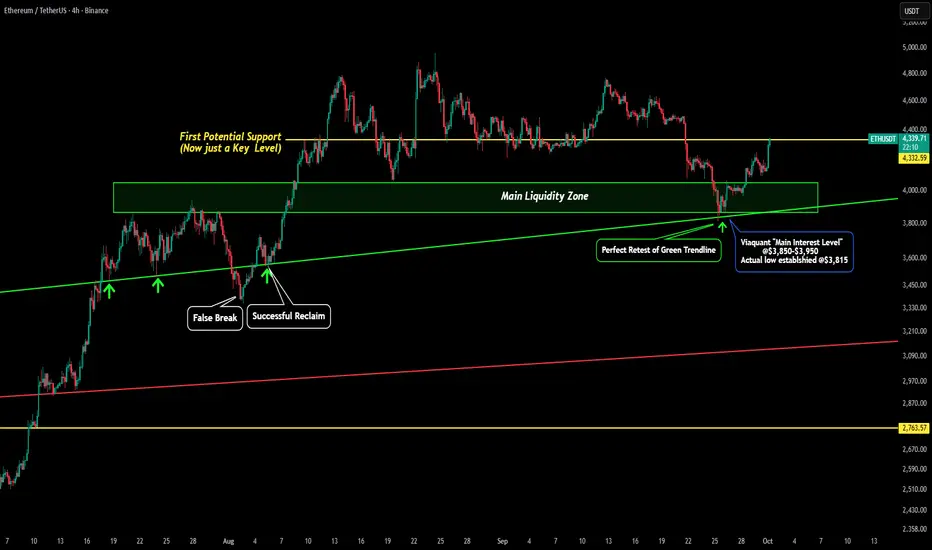
ETH - Viaquant Predicts the Future yet Again Here is an update to our post over 45 days ago:
From the time we hit the top @$4,950 we laid out all the levels to watch for ETH. We were watching some short term levels but the MAIN level we were watching for was the green box titled "MAIN LIQUIDITY ZONE". This zone ranged from $3,800-$4,100.
Since this was a multi-year resistance level we were watching it to act as a new macro support level. We pointed out how "buyers should find this level very appealing if we get a dip to there. The main interest level would lie between $3,850-$3,950."
Current day we can see how perfectly this prediction played out.
First main thing to not is the accuracy of our targets: the main level of interest ($3,850-3,950) was just $35 higher than where the actual bottom was established!
Also the "MAIN LIQUDITY ZONE" was even better with it only be $15 lower than the actual bottom being established at $3,815!!
The next key thing to note is how accurately price retested our green trendline. I have been posting about this green trendline for the past 3 months! Here are some other charts where I had this trendline that called the bottom drawn.
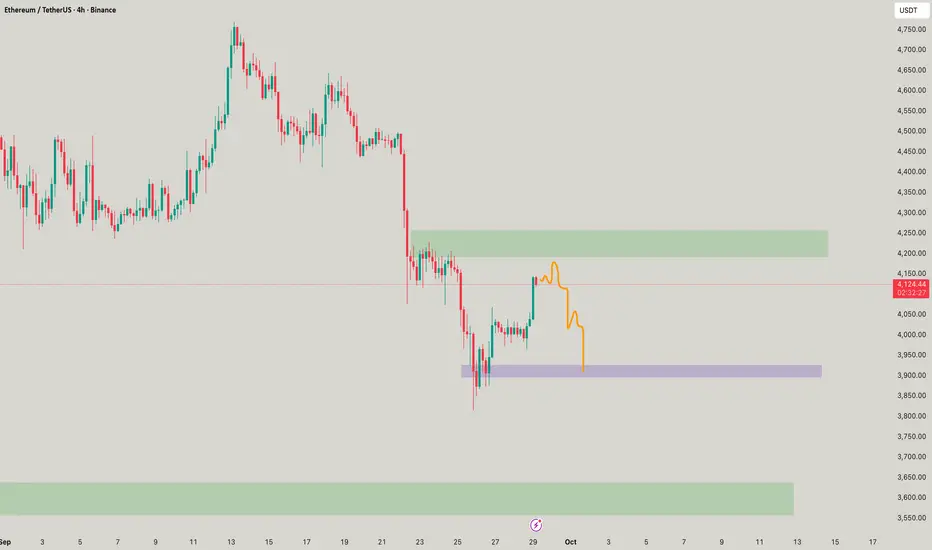
ETH - Zoomed In UpdateHere is an update to our last post:
In our last post we identified ETH was testing its key macro support of the green box and would be looking for a low established in that range.
We saw our $4,060 support level broken which led price to fall into our green box. Once price initially rebounded from the green box we topped out at the $4,060 level as (old support became new resistance). After a secondary dip to the $3,950 level price rebound and broke our resistance.
Upon the pullback we reclaimed our $4,060 as support again! This was our first major bullish signal. Then the next dip we got bulls front ran price around $4,090 showing strong demand once that level of support was reclaimed.
Now we have seen a move to our first key level around $4,280. All candle bodies have been holding above this level and need to continue to do so to potentially make a move towards our main resistance level.
This level would be the green trendline of old support that could now act as new resistance so keep an eye out for that.

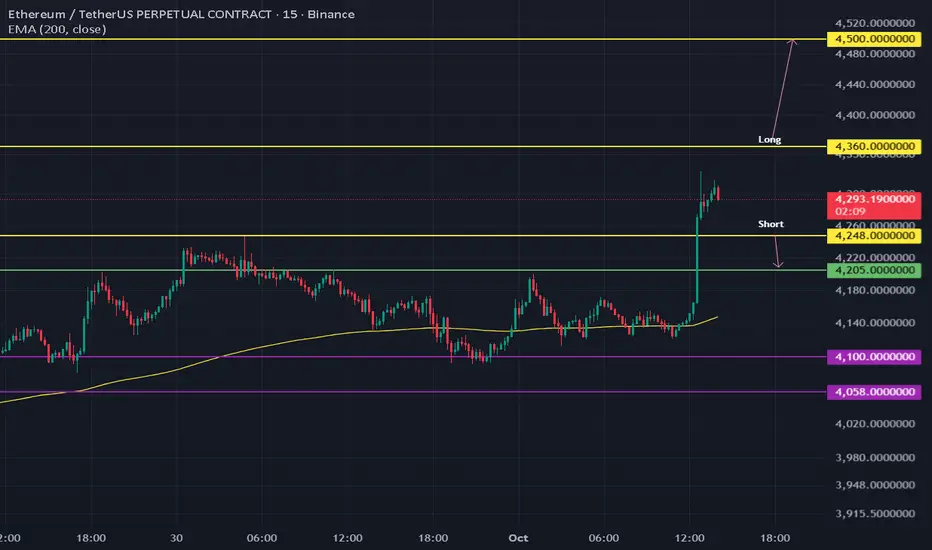
scalp ETHUSDTHi
LONG
Momentum Entry: Enter on a confirmed break and close above the immediate swing high (≈$4,350). This indicates the consolidation is over and the rally is resuming.
Take Profit (TP) $4,500.0 A ≈3.2% move, targeting the major daily resistance at $4,490 and the psychological $4,500 level.
Stop Loss (SL) $4,250.00 Placed precisely at the major pivot point (previous resistance, now strong support) to strictly manage risk. A break below here invalidates the entire pump structure.
Risk/Reward ≈1:2.8 (Risk: $110 / Reward: $140) - Excellent R:R for a strong trend continuation trade.
SHORT
Entry Price $4,248.00 Sell the Failure: Entry on a confirmed close below the critical $4,250 support, which would signal a large liquidity grab.
Take Profit (TP) $4,205.00 A ≈1.0% move, targeting the $4,200 psychological support, which was the first level reclaimed during the pump.
Stop Loss (SL) $4,300.00 Placed above the last hourly low and below the current high. If the price reclaims $4,300, the short is invalid.
Risk/Reward ≈1:0.8 (Risk: $52 / Reward: $43) - Lower R:R, strictly a defensive scalp.
Etherium UsdTComprehensive analysis of Ethereum to start a new uptrend to complete wave 3 and its target. If the trend line breaks, expect a 1:7 risk-to-reward trade

Trigger: hold > 4 117 and 4h close above 4 244.7Snapshot (last 4h-candle) and what each point means
Price: ~4 158.5 — current spot/futures price based on the last candle.
VWAP (entire period): ~4 270.1, z(Price−VWAP) ≈ −0.54 — trading below the "fair by volume" for 100 candles; the discount is moderate → there is room for upward rotation to VWAP.
aVWAP (anchors): start 4 270.1, 60d 4 295.2, from swing low 4 129.5, from swing high 4 164.7 — the price is above the local anchors (from swings), but below the senior ones (start/60d) → from above the zone 4.27–4.30k as a resistance magnet; from below — support 4.13–4.16K.
Donchian 20: H 4 244.7 / M 4 102.9 / L 3 961.0 — local range of 20 candles; output above H = lock update. maximum.
Donchian 55: H 4 497.7 / M 4 159.5 / L 3 821.3 — price at Mid of the senior channel → balance in a broad context.
Volume Profile (~60d): POC ~4 490.5 / VAL ~3 627.2 / VAH ~4 778.2 — we are below POC and inside the Value Area.
HVN (magnets): ≈ 4 274–4 350–4 395–4 418–4 490; LVN (thin): ≈ 4 059, 3 771–3 819, 4 802.
RSI(14): ~56.4 — moderately bullish momentum, no overheating.
MFI(14): ~66.0 — above-average money inflow, but not overbought (>80).
CMF(20): ~+0.16 — positive cash flow, demand prevails.
MACD(12/26/9): 27.4 > 18.5, hist +8.9 — bullish momentum phase.
ADX/DMI(14): ADX ~25.7; +DI ~19.8 / −DI ~20.0 — moderate trend, DI in balance → tendency to rotate before a clear breakout.
ATR(14): ~63$ — typical 4h range; used as a buffer for levels/stops.
Keltner(20, ±2·ATR): Upper 4 244.9 / Mid 4 117.0 / Lower 3 989.2 — trading above Mid, upward trend slope.
Bollinger(20, 2σ): Upper 4 251.3 / Mid 4 097.1 / Lower 3 942.8, BB-Squeeze: OFF — no squeeze, normal range.
z(Price−VWAP) : −0.54 — лёгкий дисконт к VWAP, норм для ротации вверх.
OBV z-скоры: z50 −0.39 / z100 −1.07 / z200 −1.68, OBV ROC(10) ≈ −0.007 — краткосрочно почти нейтрально, на средних окнах остаётся след прежнего оттока. Для устойчивого ап-движения хотим видеть z50 ≥ 0 и ROC>0.
Open Interest: ~1.039M, z(168) ≈ −0.62, ROC(5/10) ≈ +1.0% / −0.5% — OI is below average and sluggish → some up-moves are easier to achieve through short-covering than through adding new longs.
Latest divergences (auto-detector)
RSI: bullish on 18 Aug 07:00 → 19 Aug 03:00, bearish on 24 Aug 03:00 → 24 Aug 19:00
MACD: bearish on 15 Sep 23:00 → 17 Sep 07:00, bullish on 27 Sep 19:00 → 28 Sep 11:00
OBV: bullish on September 7 at 19:00 → September 8 at 07:00, bearish on September 15 at 23:00 → September 17 at 07:00
MFI: bearish on September 10 at 15:00 → September 11 at 07:00, bullish on September 27 at 19:00 → September 28 at 11:00
Interpretation: bullish divergences increase the likelihood of a rebound/breakout upwards; bearish divergences increase the risk of a downward rotation. The signals are stronger when confirmed by a candlestick pattern + OBV/CMF.
What does this mean now
Weak bullish bias: MACD↑, CMF>0, price above EMA20/KC-Mid; RSI~56.
VWAP/Profile context: we are below the senior aVWAP (4.27–4.30k) and far from the POC 4.49k; OBV z is negative on the middle windows, OI is sluggish → for now, this is a rotation to the middle/HVN, not a confirmed trend breakout.
Profile: within the Value Area; the nearest "magnets" from above are the HVN belt 4.27–4.35k, followed by the POC 4.49k.
Key levels
Resistances: 4 244.7 (Donch-H20) → 4 270–4 295 (aVWAP start/60d) → 4 346–4 418 (HVN) → 4 490.5 (POC) → 4 497.7 (Donch-H55) → 4 778 (VAH).
Supports: 4 117 (KC-Mid/EMA20) → 4 097 (BB-Mid) → 4 103 (Donch-Mid20) → 3 989 (KC-Low) → 3 961 (Donch-L20) → deeper 3 627 (VAL).
LVN-pockets: ~4 059 (thin → you can fly quickly when passing through).
Scenarios and triggers (not the financial council)
A) Basic — rotation up to the VWAP/HVN anchors.
Why basic: MACD+, CMF>0, price above KC-Mid, RSI~56; z(Price−VWAP) is negative (there is space for a pullback to VWAP/aVWAP).
Trigger: hold > 4 117 and 4h close above 4 244.7 with a buffer of ≈ +0.1·ATR ≈ +6$ → > 4 251, with RSI > 55, CMF ≥ 0, OBV z50 → ≥ 0.
Targets: 4 270–4 295 (aVWAP 60d/start) → 4 346–4 418 (HVN) → 4 490 (POC).
Invalidator: quick return and fixing < 4 117 with weakening of MACD/CMF.
B) Down rotation (reloading of momentum).
Trigger: 4h close < 4 117 and < 4 097, RSI < 50 / MACD-hist ↓, while OI ROC+ is falling.
Targets: 3 989 (KC-Low) → 3 961 (Donch-L20) → if weak, test LVN ~4 059 and, if broken, corridor to VAL 3 627.
Cancel: return and hold > 4 244.7 with an increase in OBV.
C) Acceleration up (mini short-squeeze).
Trigger: a series of 4h-closings > 4 251 against the background of falling OI and rising OBV.
Targets: 4 295 → 4 346–4 418 → 4 490 (POC); with inertia — 4 498 (Donch-H55).
Tactics (example of logic)
Impulsive long: after fixing > 4 251. Partial fixes: 4 270–4 295, then 4 346–4 418, the main one at 4 490. Stop under 4 117 (or under the retest level), buffer ~0.5×ATR ≈ 31$.
Pullback long (conservative): zones 4 117 / 4 097 with signs of demand (CMF≥0, candle reaction, OBV z50 turns). Targets: 4 244 → 4 270–4 295.
Contrary-trend short: only when 4 244–4 295 is rejected (upper shadows + bearish RSI/MFI divergences, weakening of the MACD histogram) and if OBV z50 ≤ −0.5. Targets: 4 117 → 3 989 → 3 961. Stop at 4 305–4 315.
In short: what to expect
The bullish bias remains, but without confirmation of OI/OBV, it is more of a rotation to VWAP/aVWAP and HVN than a full-fledged trend breakout.
If we secure above 4,251, it is logical to rise to 4.27-4.30k, then to 4.35-4.42k, and with good flow, to POC ~4.49k.
If we fall below 4,117/4,097, there is a chance of a reset to 3.99–3.96k; only breaking through these zones will open the way to VAL ~3.63k.

eth big short Carry trading, where investors borrow in a low-interest currency to invest in high-yield assets like Ethereum, has sparked concerns about potential price declines in the cryptocurrency. With the Federal Reserve announcing that interest rates will remain fixed until March 2026, how does this affect Ethereum’s outlook?Fixed interest rates typically stabilize borrowing costs, encouraging carry trades to persist. Investors may continue leveraging low-cost loans to buy Ethereum, potentially supporting its price in the short term. However, if market volatility spikes—due to geopolitical events or crypto-specific factors—carry trades could unwind rapidly. This would lead investors to sell Ethereum to cover loans, creating downward price pressure.Ethereum’s high liquidity makes it a prime target for such strategies, amplifying its vulnerability. Recent data shows Ethereum’s price dipped 3% last week amid broader market uncertainty, hinting at sensitivity to carry trade dynamics. While fixed Fed rates may delay aggressive unwinding, any sudden shift in sentiment could still trigger sales.On the other hand, Ethereum’s strong fundamentals—its role in DeFi, NFTs, and upcoming upgrades—may mitigate some risks. Nonetheless, investors should remain cautious, as carry trade liquidations could still impact prices before March 2026, especially if volatility rises.In conclusion, fixed Fed rates until March 2026 may provide temporary stability for Ethereum, but carry trading risks persist. Monitoring market sentiment and volatility is crucial for investors.

Ethereum Price Bounces Off 7-Week Low—Future Still Promising?Ethereum trades at $4,187, just under the $4,222 resistance level after rebounding from a $3,872 low. This recovery highlights buyer interest at support levels. However, the broader market remains cautious, waiting to see whether Ethereum can sustain momentum and reclaim critical price barriers.
If Ethereum breaches $4,222, it could flip this level into support, potentially extending gains. Still, breaking above $4,500 will be difficult without fresh inflows. Limited liquidity and investor hesitation could keep Ethereum rangebound, consolidating until stronger catalysts emerge in the market.
On the downside, failure to maintain support could reignite bearish sentiment. If selling intensifies, Ethereum might slip through $4,074 and retest $3,872. Such a decline would invalidate the bullish outlook.

ETH climbs toward key resistance in rising channelThe ETH/USDT 4‑hour chart shows a recovery rally unfolding within a broader downtrend. After a sharp decline earlier in September, prices have been climbing in a rising channel, while still respecting the boundaries of a larger descending channel. Short‑term momentum has shifted bullishly as higher highs and higher lows form inside this smaller channel, and trend indicators suggest strengthening buyers.
Upcoming U.S. economic releases—non‑farm payrolls, the Consumer Price Index, and the Federal Reserve’s October meeting—could inject volatility into the crypto market. These events often alter investor expectations for interest rates and risk assets, so traders should be prepared for sudden swings.
Trade view: A bullish setup would involve waiting for a decisive break and retest above recent highs in the rising channel, with targets at the next major resistance area. A bearish setup would trigger if the asset falls below the rising channel’s base, aiming for the previous swing low and then the broader channel floor. In both cases, stops should be placed just beyond the invalidation level, and risk‑to‑reward ratios should be kept favorable.
Overall, ETH remains in a corrective rebound within a longer‑term downtrend. A confirmed breakout from this pattern could signal a larger upside move, while failure to hold the current support zone might send prices back toward prior lows.

[SeoVereign] ETHEREUM BEARISH Outlook – September 30, 2025Hello everyone,
As of September 30, I would like to share my perspective on an Ethereum short position.
At present, I believe that Bitcoin, among others, still has one more downward wave remaining. Therefore, I am closely monitoring Bitcoin’s movement to capture the timing of its bearish reversal. Given that Bitcoin is likely to enter a declining phase, I am presenting a bearish scenario for Ethereum as well.
The basis of this idea is relatively clear: the entire structure is formed according to the classical ratio relationships of Elliott Wave Theory. All detailed ratios and projections have been drawn on the chart for your reference.
-Ratio Relationships
1. WAVE.C = WAVE.A * 1.618
2. WAVE.C = WAVE.A * 0.786
3. WAVE.C = WAVE.A * 1.272
The average target price for this decline is set around 4030 USDT.
As always, I will continue to share updates on position management based on this idea as the chart develops.
Thank you for reading.

Is ETH Bottomed?
Observations from ETH 4 Hour Charts – 2025-09-28
• ETH is currently in a downtrend
• Key Support is $3945, Key resistance is $4202
• Projected time for trend reversal is early November with the following two Consolidation Ranges (CR): $3945 and $4202 then break and hold above $4200 level.
Warning Sign (Further Dropping)
1). Cannot make new lower lows than $3821.02
Play Strategy
Swing Trader: Trade the ranges.
Long-term Investor: Buy in dip, 20% - 30% buy

ETH - SUpercharged? Or Yet a move to be faked?ETH is charging itself up but the move was rather a fake one, ecpecting reversals in full
ETH Salaam
Just see and share a possible scenario.
ETH could make a bull flag on daily time frame just below the weekly key level of 4,000.
Also in weekly time frame, ETH broke the large triangle to the upside and now retesting, it should build it there is any will to contribute rise!
Look at 4h candle with high volume make it like accumulation.
For now confirmation wait for daily and weekly close above 4k.
Break the bill flag, retest and go for tp1 and 2.
Have great trade
Consider risk management
