ETH: Another Attempt To Resume Upward MovementETH: Another Attempt To Resume Upward Movement
Ethereum is showing strong bullish momentum after forming a bullish flag pattern on the chart. The price has broken above the flag, confirming the potential for further upside movement.
As long as ETH stays above the breakout zone, the next target levels are around $4,125 and $4,285.
If the price fails to hold above the breakout area, a short pullback could occur before another attempt to move higher.
Overall, the structure remains bullish while ETH trades above the $3,900 support zone.
You may find more details in the chart!
Thank you and Good Luck!
❤️PS: Please support with a like or comment if you find this analysis useful for your trading day❤️
Trade ideas

ETH: Head and Shoulders Pattern Targets $3,800Hi Teams!
Ethereum has recently completed a head and shoulders formation. The neckline around $3,920 was broken decisively, confirming the pattern and triggering further downside momentum.
After the breakdown, the price slipped toward the lower boundary of the descending channel, finding temporary support near $3,860. A short-term corrective move is now unfolding, with ETH likely to retest the neckline zone and the upper boundary of the channel before facing renewed selling pressure.
As long as Ethereum trades below $3,920–$3,940, the bearish structure remains valid. A rejection from this area could accelerate the decline toward the target of the head and shoulders pattern, which aligns with the $3,800–$3,820 support zone.
However, a clear breakout above the descending trendline would invalidate this bearish outlook and could open the way for a recovery toward the $4,000–$4,050 resistance area.
Levels to Watch:
Resistance: $3,920 – $3,940 / $4,000 – $4,050
Support: $3,860 / $3,800 – $3,820
Bearish Target: Around $3,800 zone
Outlook: Bearish while below $3,920.

The Next Crypto Winter or Just a Cold PauseThe past few months in the crypto market feel strangely quiet.
Volatility has slowed down, emotions are swinging between fear and confusion, and trading volume has dropped noticeably.
But is this just a calm pause before the next bull runor the early whisper of another crypto winter?
Hello✌️
Spend 2 minutes ⏰ reading this educational material.
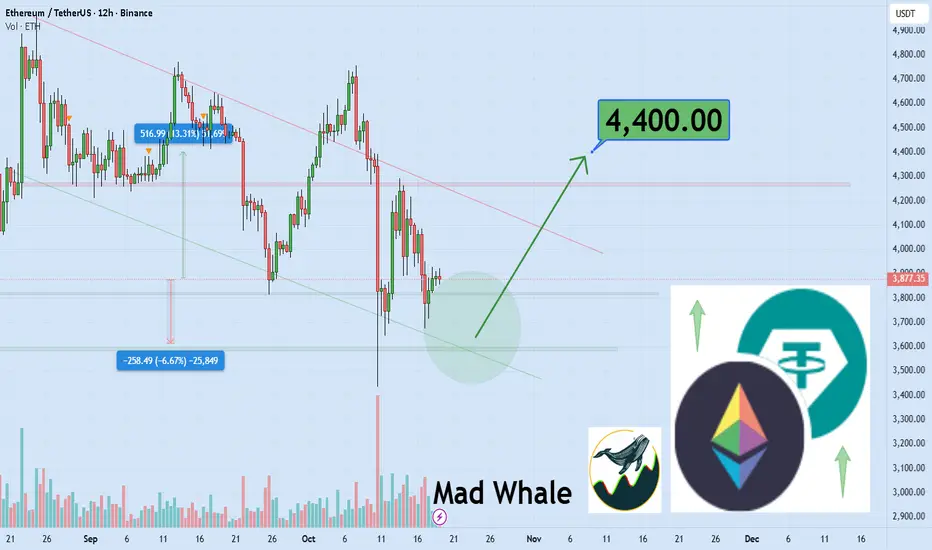
🎯 Analytical Insight on Ethereum:
Ethereum is testing the lower boundary of its bullish channel and key daily support 📉.
If this level holds, a potential 13% upside could target $4,400$🚀.
Now , let's dive into the educational section,
❄️ What Does “Crypto Winter” Really Mean?
A Crypto Winter is not just a price drop. It’s a long period when market excitement fades, liquidity dries up, and investors lose confidence.
During this phase, traders turn cautious, smaller projects disappear, and overall volume falls sharply.
We’ve seen this before most notably in 2018 and 2022 when Bitcoin crashed from all-time highs and stayed frozen for months.
📉 Current Signals: Are the Cold Nights Coming Back?
Recent data shows patterns that can’t be ignored.
Massive leveraged positions have been liquidated, exchange volumes are shrinking, and activity in DeFi projects is fading.
Many traders complain about the lack of momentum. In short, the engine of the market seems to be cooling down.
🧠 Market Psychology: When Fear Overpowers Greed
The Fear & Greed Index is once again leaning toward “Extreme Fear.”
This is when inexperienced traders panic and pull out their funds—while the smart money starts to accumulate quietly.
In these phases, separating logic from emotion becomes the trader’s greatest skill.
Fear blinds, but data reveals opportunity.
🧭 Educational Section: Using TradingView Tools to Spot Market Winters
If you want to visualize this on your charts, TradingView offers everything you need.
Start with the Volume Profile Visible Range indicator—it helps identify zones where the most trading activity occurred, showing where “smart money” might be hiding.
Next, try the Fear & Greed Index Indicator by searching it in the Indicators tab.
Then add the Moving Average Ribbon; when multiple averages compress or align downward on higher timeframes like Daily or Weekly, it’s often a sign of market exhaustion.
Finally, keep an eye on RSI (Relative Strength Index). If RSI stays below 40 for an extended period, buyers are losing control.
Combining these tools gives a realistic view of whether the market is cooling down.
Traders who master these indicators can stay objective and confident while others are led by noise—exactly the kind of analysis TradingView editors love to highlight.
🔍 Do the Data Confirm a Real Winter?
According to sources like Fool, CoinTracker, and BankRate, the signs are cautious but not final.
Bitcoin remains above key support levels in some timeframes, and on-chain data doesn’t show a complete capitulation of long-term holders.
So right now, we’re standing at a crossroads—one that could lead to either a deeper freeze or a quiet recovery.
💡 Final Advice for Traders
In times like this, your most powerful tools aren’t indicators or news—they’re your mindset and risk control.
If the market feels cold, slow down your trading, tighten your stops, and keep your liquidity flexible.
Sometimes, a winter is not a punishment—it’s an invitation to rest, learn, and prepare for the next move.
🪶 Summary
The crypto market is balancing on a fine line.
The cold signs are visible, yet hope still breathes beneath the surface.
Focus on data, emotion control, and TradingView tools to stay ahead of the crowd.
Don’t fear the frost sometimes, opportunity is hidden in the ice.
💡golden recommendations
Always define your exit and stop loss before entering.
Enter trades only when your mind is calm, not emotional.
✨ Need a little love!
We pour love into every post your support keeps us inspired! 💛 Don’t be shy, we’d love to hear from you on comments. Big thanks, Mad Whale 🐋
📜Please make sure to do your own research before investing, and review the disclaimer provided at the end of each post.
ETHUSDT – Bullish Breakout Ahead?👋Hello everyone, do you think BINANCE:ETHUSDT will go up or down?
From a technical perspective, the pair has successfully broken above the descending trendline. This breakout opens up a potential opportunity for a new short-term uptrend. In addition, ETHUSDT is currently reacting to a clearly defined support zone.
If Ethereum continues to hold above this support area, I expect the price could rise toward the next resistance level near $4,300.
From a broader viewpoint, market sentiment is gradually improving as investors regain confidence in risk assets, amid expectations of a softer Fed policy and growing interest in Ethereum’s upcoming network upgrades.
As long as ETH stays above $3,750, the bullish outlook remains valid, and buyers may soon regain control of the market.
What about you — do you agree with this view? 💬Share your thoughts in the comments below. I’d love to hear your opinion!

TradeCityPro | Ethereum: Break Key Levels for Bullish Momentum👋 Welcome to TradeCity Pro!
In this analysis, I want to examine Ethereum for you. The queen of the crypto market, with a $497 billion market cap, is ranked 2nd on CoinMarketCap.
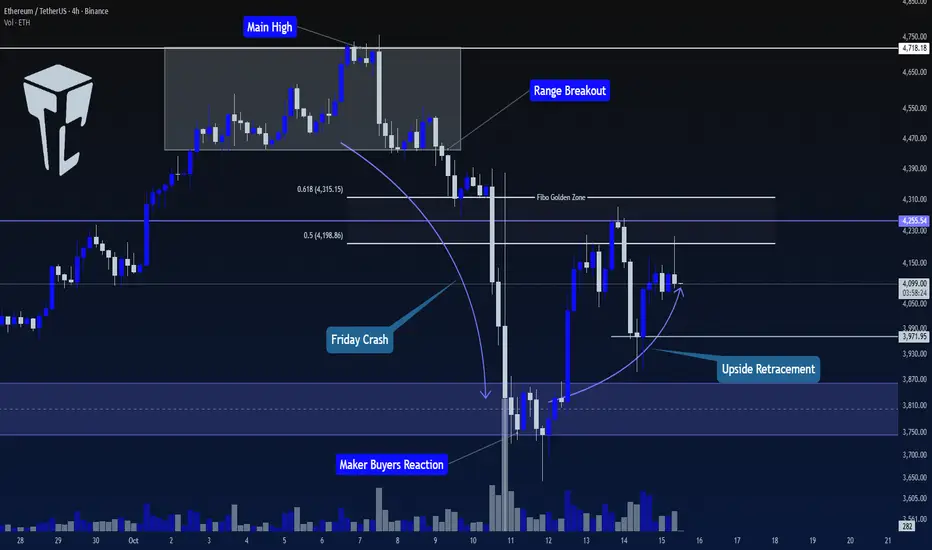
⏳ 4-Hour Timeframe
This coin, in the 4-hour timeframe, after breaking the range box at the ceiling and moving towards the $3800 level, is now in a corrective phase and has made an upward movement.
⭐ The $3800 range is a very important level for Ethereum, and this zone was not broken even during the Flash Crash that occurred on Friday, and it managed to hold the price.
🚀 Now, the price has moved towards the range between 0.5 and 0.618 Fibonacci, and has been rejected once from this zone.
📊 The volume has not increased significantly during this move and has mostly been range-bound, but since the price has created a higher low at the $3971 level, if the buying volume increases, we can get a bullish confirmation with a break of the $4255 level.
💥 Since this coin is bullish on higher timeframes and is currently undergoing a correction on lower timeframes, if the price gives us a small bullish confirmation, we can take advantage of it and open a long position.
💡 The main resistance for Ethereum is the $4718 level. Breaking this level will initiate the next wave for Ethereum on higher timeframes, such as weekly charts. Therefore, I will try to open a long position on Ethereum before this level is broken.
📈 The suitable trigger right now seems to be a break of $4255. With this break, the price can move towards $4718, and if this level is broken, we will have a very good and attractive entry point for a long position on Ethereum.
📝 Final Thoughts
Stay calm, trade wisely, and let's capture the market's best opportunities!
This analysis reflects our opinions and is not financial advice.
Share your thoughts in the comments, and don’t forget to share this analysis with your friends! ❤️
ETHEREUM → Manipulation before a possible fall BINANCE:ETHUSDT , as part of manipulation and updating the local maximum to 4108, confirms strong resistance, forms a false breakout, and falls, testing key support.
Bitcoin, as part of yesterday's rally in the US trading session, is trying to turn the tide, but after encountering resistance at 113600, it forms a false breakout and sells off all the growth, which is generally a signal of readiness for a decline. This could have a negative impact on the entire market...
Ethereum is testing support - trigger 3822.5. After a sharp drop, there is no rebound, which indicates buyer weakness. Consolidation is forming near support, which only reinforces the pre-breakdown potential.
Resistance levels: 3963, 4030, 4090
Support levels: 3822, 3660, 3366
The classic implementation of the “liquidity hunt” scenario led to a rally to resistance, and a false breakout at 4090 led to heavy selling. As part of the current consolidation, the market is reducing volatility ahead of support, which only increases the chances of a breakdown. A close below 3822 could trigger a further decline. Key liquidity zones are 3658 - 3366.
Best regards, R. Linda!

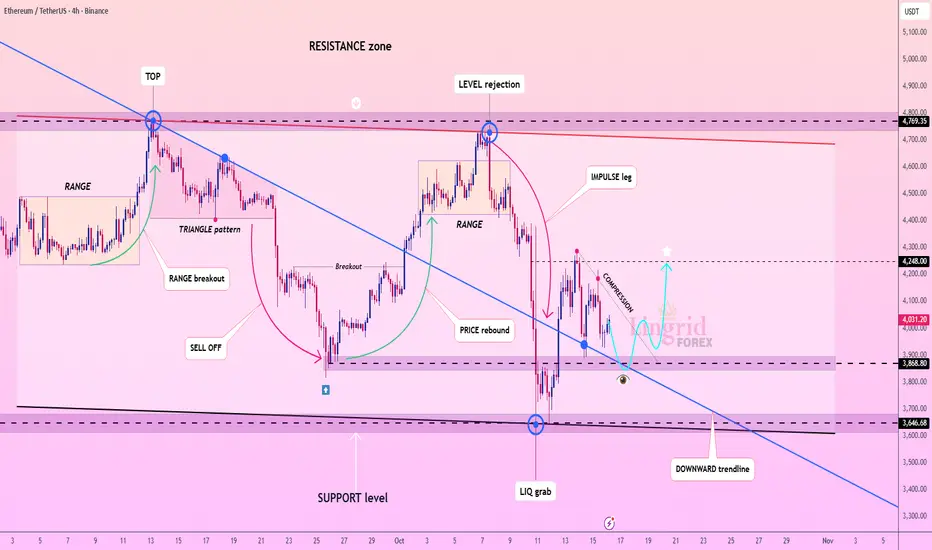
Lingrid | ETHUSDT Squeeze Pattern Breakout ExpectedThe price perfectly fulfilled my previous idea . BINANCE:ETHUSDT rebounded sharply from the liquidity grab near 3500, signaling the defense of the major support level after a deep sell-off. The structure now shows compression just below the downward trendline, hinting at a potential bullish breakout setup. If price sustains above 3900, it could trigger an impulsive rally toward 4250. Momentum remains constructive, and the recovery phase suggests a possible reversal if buyers maintain control.
⚠️ Risks:
Failure to clear the downward trendline may extend the consolidation.
Renewed BTC weakness could cap ETH’s recovery potential.
Unexpected macro data or regulatory developments could pressure the broader crypto market.
If this idea resonates with you or you have your own opinion, traders, hit the comments. I’m excited to read your thoughts!
ETHUSDT: Breaks Through FVG Zone – Can It Push Beyond 4,200?Hello everyone,
Ethereum is showing a convincing recovery after the recent sharp decline from the 4,400–4,500 region. On the H4 timeframe, price formed a short-term bottom near 3,780 before bouncing, maintaining a Higher Low structure – a signal that buyers have begun to regain partial control of market momentum. More importantly, ETH has just broken through the final Fair Value Gap of the previous downtrend and is now approaching the key resistance zone at 4,100–4,200 – which aligns with the upper boundary of the Ichimoku Kumo and a significant historical supply zone. This will be a decisive region to determine whether the ongoing move is merely a pullback or the beginning of a new bullish leg toward 4,300–4,350 or even 4,420 where another unfilled FVG remains.
On the macro side, current sentiment slightly favours the bulls. US bond yields have cooled off, putting pressure on the Dollar and allowing capital to rotate back into risk assets like crypto. The market is also pricing in a 70% probability of a Fed rate cut in December 2025, reducing the opportunity cost of holding non-yielding assets such as gold and Ethereum. Adding to that, Ethereum Spot ETF approval is entering its final review phase, raising expectations of institutional inflows – similar to the effect seen with Bitcoin previously.
However, I remain cautiously optimistic as the upside bias has yet to be confirmed without a decisive candle close above 4,200. This area may trigger short-term profit-taking. If ETH faces rejection here, a pullback to 4,000–4,050 would be considered healthy, and a deeper correction towards 3,880–3,820 (bullish FVG + previous structure support) is also possible before bulls accumulate enough liquidity for the next leg.
Do you think ETH breaks 4,200 from here – or one more liquidity sweep before launch?

#ETHUSDT: Fill The Gap At $3200, Target At $6000 The significant price gap has been closed and the market is now in correction mode. We anticipate a further decline of approximately $3200 which remains a key support level for buyers. Our next step is to observe the market’s reaction and remain patient.
Please note that this is not a guarantee and you should always conduct your own research before making any significant investment decisions.
Best regards,
Team Setupsfx
ETH bottomed at 3825, 1st Target 422522025-10-19 EST 5:39 AM
ETH Bottomed at 3825
1st Target 4200 to 4225

ETHUSDTETH is making LH/LL within certain boundaries, where support ranges from 3663 to 3821 and resistance is at 4091 may take entry while breaking the resistance, but it is better to take entry with 2nd BoS in 1H TF. There is no divergence .

ETHUSDTHello Traders! 👋
What are your thoughts on Ethereum?
Ethereum is currently trading between two major zones of support and resistance.
In this range, we expect a short-term correction toward the ascending trendline, followed by some consolidation before a potential breakout above the resistance zone.
If the support holds, followed by a positive reaction from the trendline and a breakout above the resistance level, Ethereum is expected to begin a new bullish wave and move higher toward the identified target levels.
If a daily candle closes below $3,500, this bullish scenario will be invalidated and a deeper correction could follow.
Don’t forget to like and share your thoughts in the comments! ❤️

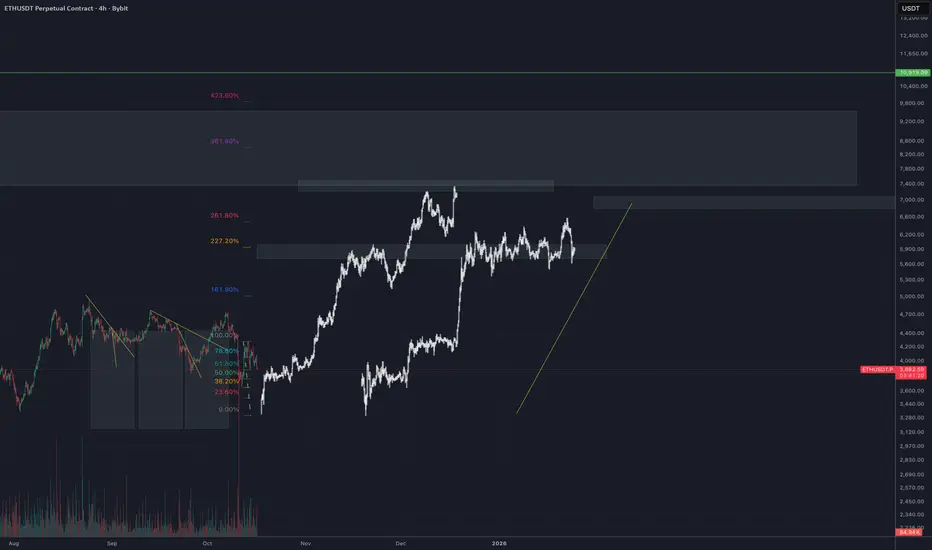
ETH/USDT the Final Push Before the Parabolic Run!Ethereum has completed Waves 1–4 and is now coiling for the explosive Wave 5 breakout. After breaking out of a Descending Broadening Wedge, price is retesting the structure a decisive moment that could define the next major leg up.
Holding above $3,430 keeps the bullish setup valid, while a confirmed bounce could ignite a rally toward $12,100+, marking ETH’s potential move into five digits.
Momentum is building the next breakout may not wait long.
Like, share & follow for precise, high probability setups!

ETHUSDT: Possible Minor to Major Corrections May HappenETHUSDT has a higher chance of experiencing a minor or major correction in the coming days, although we haven’t confirmed this yet. We need more confirmation before we can be certain about the future of ETH. However, if the price decides to undergo a major correction, it’s likely to drop to our second area, where it’s expected to fill the liquidity gap and then reverse, continuing towards our three targets.
Please use this analysis as secondary bias only or even only for educational purposes. Always conduct your own analysis and risk management before trading or investing in cryptocurrencies, as they carry significant financial risk. Good luck and trade safely.
If you want to support us, you can do so by liking the idea, commenting with your views, or sharing it.
Much love ❤️
Have a great weekend
Team Setupsfx_

Will Ethereum reach $9,000 in the next 2 years?
Hi my dears
Will Ethereum reach $9,000 in the next 2 years?
Yes, definitely
If its price stabilizes at $4390, which is likely to happen.
I think the price of Ethereum will grow a lot over the next two years and can make very good profits, just like BNBUSDT, whose analysis I posted on my page.
If you want to make big profits, just follow me and my page.

ETHUSDT 18 oct 2025am confident that in the long term, Ethereum will reach a price of $8,000. Despite experiencing a significant correction due to yesterday's crash, the price has rebounded and is now showing bullish signs with a bullish flag pattern, indicating a short-term target of $5,500 to $6,000.

Dealers Were in Short Gamma. No Surprise We DroppedA massive flip zone just showed up on the GEX map and dealers were positioned deep in short gamma.
That means every downward move in spot forced them to sell even more to hedge, amplifying the pressure.
So it’s not a random sell-off , it’s a mechanical reaction from the dealer flow itself.
When the market enters negative gamma territory, volatility feeds on itself.

ETH – Wave 5 Projection (Fibonacci Targets) 16.10.2025Ethereum is entering the final wave 5 of the current impulsive cycle.
Wave 4 correction held strong above the 0.382–0.5 Fibonacci zone, keeping the bullish structure intact.
#ETH #Ethereum #ElliottWave #Fibonacci #Crypto #Wave5
ETH is now preparing for a rally toward the $4,500 zone.Ethereum will bounce within the channel, moving toward the $4,500 target.
Even in a spot position, this move could deliver around 18% gains.


Defend that zone or drop furtherAnytime market tries to push up it always come back down
If ETH lose that zone we'll see further drop to like 3,500 or 3,400
Let's see what happens in the coming days
Hold the zone or lose the zone

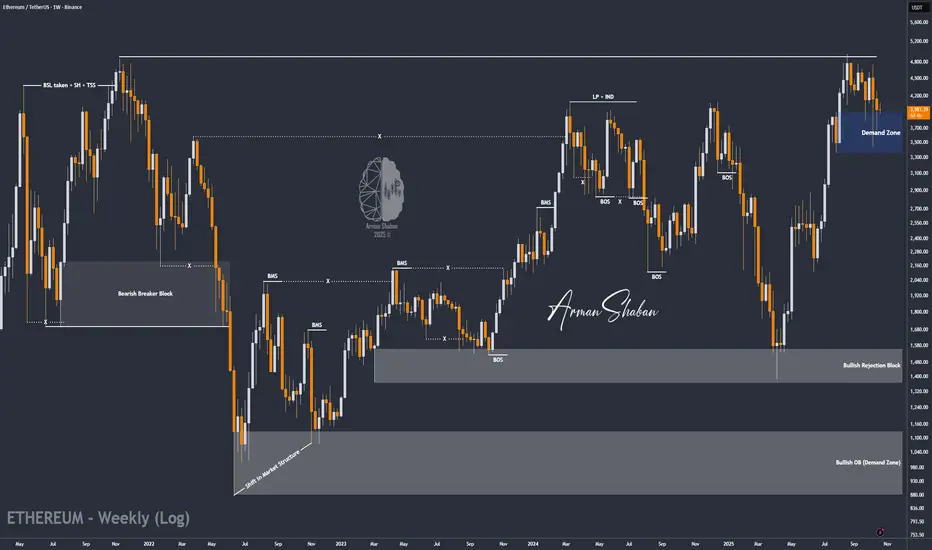
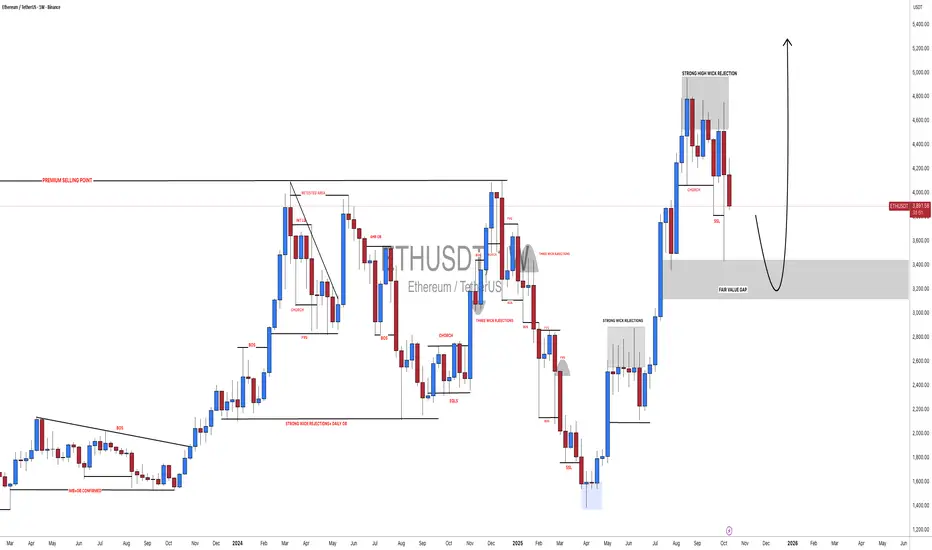
ETH/USDT | ETH Update – Waiting for Confirmation Above $4K!By analyzing the #Ethereum chart on the weekly timeframe, we can see that price has been consolidating around the $4,000 level after a sharp recovery from the $3,400 demand zone. This sideways movement shows ongoing accumulation, but a clear breakout and close above $4,000 is still needed to confirm renewed bullish momentum.
As long as ETH holds above the $3,900–$4,000 support range, the broader bullish outlook remains valid. The next upside targets are $4,950, $5,500, and $6,000 , but continuation strongly depends on Bitcoin’s ability to stay above $112K .
In short — ETH is gearing up for its next move, but the key lies in a confirmed breakout above $4K with BTC providing stability.
Please support me with your likes and comments to motivate me to share more analysis with you and share your opinion about the possible trend of this chart with me !
Best Regards , Arman Shaban