Long trade Pair: ETHUSDT
Date: Wed 12th Nov 25
Time: 6.30 pm
Session: Tokyo PM
Direction: Buyside
Timeframe: 15-min Execution
🔹 Trade Details
Field Value
Entry 3410.66
TP 3623.43 (+6.23%)
Stop 3368.96 (–1.23%)
RR 5.1: 1
🔹 Technical Context
Model: FVG → Inducement → BOS → Mitigation Entry
📝Higher-Timeframe Bias
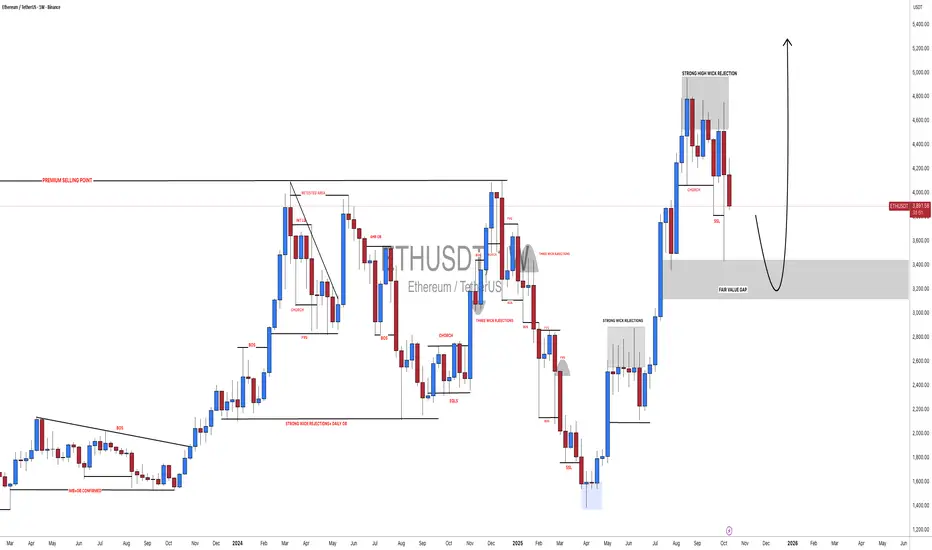
The chart shows ETH sweeping a major HTF discount zone around 3200–3240, which aligns with Base Level 3244.28. This region acted as a Sell climax, Secondary test (Wyckoff Phase B/C), and Liquidity grab beneath all previous London and NY lows. FVG between ~0.62–0.70 retracement zone. It remained untouched, leaving a clear inefficiency target for a mitigation tap.
Before price tapped the FVG, ETH created:
A micro liquidity shelf and consecutive equal lows during Tokyo → London
Narrative:
Price swept the HTF base level around 3240, confirming bullish accumulation. Multiple session lows were engineered then taken (Tokyo → London → NY), creating strong sell-side liquidity. After displacement, ETH left a clean bullish FVG, whose price never fully mitigated. A shallow 0.25 pullback created inducement, ensuring weak hands entered early. Once the BOS printed, the price sharply retraced into the FVG, Discount Fib zone, Breaker block, and Tokyo PM session demand, creating an algorithm-driven entry.
🔹 Sentiment / Narrative Context
Liquidity vacuum above 3500 with clean inefficiencies makes buyside continuation likely.
Broader sentiment remains positive as the market left a re-accumulation range rather than a distribution. Volume aligned with bullish displacement — institutions supporting the move.
No major macro headwinds at this moment; volatility stable and favouring upward expansion.
Trade ideas

Update ( ETHUSD )After the sweep of LQ we may see a run of those lows before reversing higher , we aren't gonna enter yet , not until higher time frame confirms to us that the state of dilevery has changed.


Ethereum#ETH 1H chart is showing signs of a Double Bottom forming a potential reversal structure.
If the neckline breaks and price holds above the 1h FVG zone, next target aligns with the 4h FVG area around +$3.8k.
Structure looks clean smart money might already be positioning.
Thank me later for this setup.
#Ethereum #Crypto #YodaXCalls

ETH-USDTI said yesterday that as long as it stays above 3450, the price could reach 3700 and it's moving along that path 💵💵
If the scenario changes, I’ll update you 🤩💰💰

#Ethereum BREAKOUT INCOMING!Ethereum is coiling tightly inside this symmetrical triangle.
A breakout is coming and momentum is already shifting. 🔥
Watch ETH closely… the next move could be explosive. 🚀

Ethereum updateLast night, after a rejection, the price touched a **trendline resistance** and is now bouncing back from that area. Buyers seem to be showing more strength at the moment, and it looks likely that the price could **revisit the range high** once again.

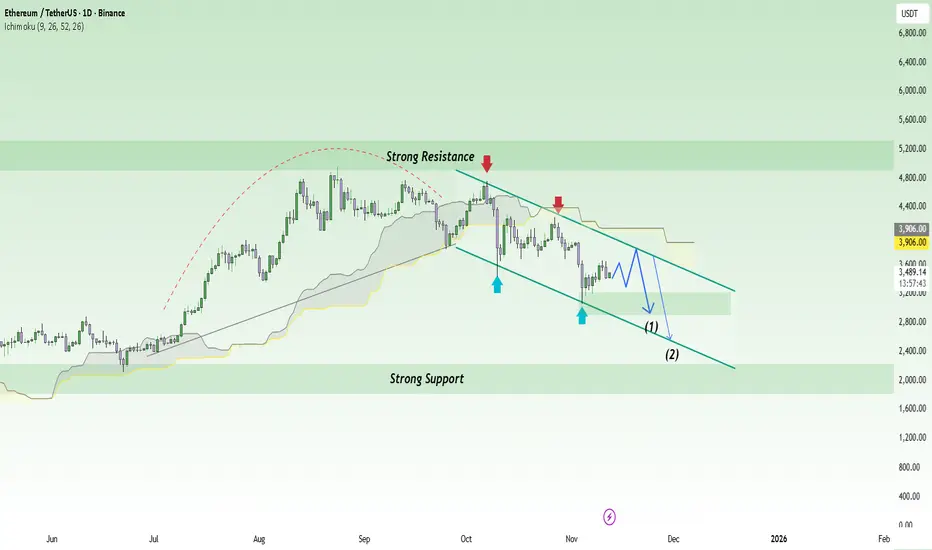
ETH Breaks Structure! Are the Bears Back in the Race?Ethereum (ETH) is entering a sensitive phase as overall market sentiment turns more cautious following recent declines across the crypto market. While it remains the leading platform for tokenization and DeFi, short-term selling pressure is becoming increasingly evident — especially as speculative capital shifts toward safer assets.
On the daily chart, ETHUSDT remains inside a medium-term descending channel , with every rebound quickly rejected at the dynamic resistance line. Price is currently trading around $3,480, signaling a weak recovery attempt while momentum remains trapped below the Ichimoku cloud.
The current scenario suggests that ETH could retest the $3,800 resistance zone before continuing its move lower toward $2,900 and $2,500 — both aligning with the lower boundary of the channel and a strong support area from previous price action.
Overall, the primary trend remains bearish , and any short-term bounce is likely just a technical pause before renewed selling pressure. In the short run, the bears are clearly still in control.
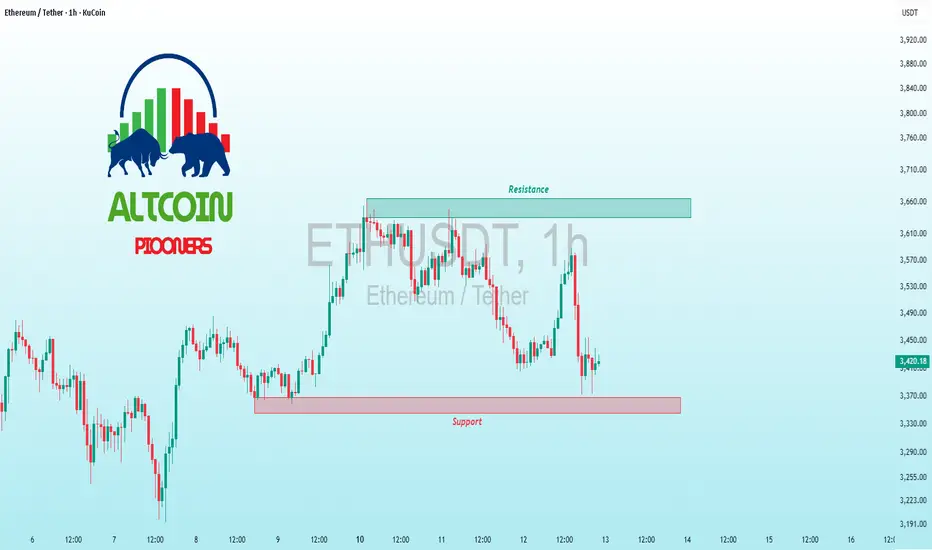
$ETH Support Test Amid Volatility – Ready for Rebound?KUCOIN:ETHUSDT CRYPTOCAP:ETH Support Test Amid Volatility – Ready for Rebound?
Current trend: ETH is grinding lower in a choppy range, now hugging the pivotal 3,370 support after a swift rejection from 3,470 highs—buyers defending hard, but volume thinning signals caution ⚡.
Hold support? Likely yes, with hammer candles forming and price stabilizing; a close above 3,390 flips bias bullish.
Breakout above resistance? Possible if BTC stabilizes—targeting 3,550 on volume surge, unlocking alt momentum.
Dip risk? Elevated to 3,300 if support cracks on weak close, especially with overbought divergence looming.
Target: Upside 3,550 short-term; deeper 3,700 if 3,470 clears decisively.
Indicators watching: RSI dipping to 40 (bounce zone), Bollinger Bands squeezing for volatility pop, and OBV for accumulation confirmation 📉.
#ETHTrading #CryptoBounce #AltcoinPioneers
ETHUSDT-LONG IDEAETHUSDT is in internal short term bearish trend very soon it is going to hit its Higher time frame support of demand area. I've market the zone if you find eth in this zone wait for LTF structure shift and Buy. This is just an idea not a Financial Advice.

Long trade
1hr TF overview
📘 Trade Journal Entry
Pair: ETHUSDT.P (Perpetual Contract)
Date: Wed 12th Nov 2025
Time: 7:00 AM
Session: London to New York Session AM
Direction: Buyside Trade
Timeframe: 15-Minute
🔹 Trade Details
Entry: 3552.98
Profit Level (TP): 3807.27 (+7.17%)
Stop Level (SL): 3530.45 (–0.63%)
Risk-Reward Ratio (RR): 11.31
🔹 Technical Context
Market Structure:
🧾Prior Consolidation Phase at top range followed by a significant markdown breaking below structural support.
🧾The secondary retest formed at the base level (3244–3200 zone) aligned with liquidity grab beneath prior lows (PDL).
🧾Subsequent shift in structure (CHOCH → BOS) on the 15M chart suggests transition from distribution to early accumulation.
Key Confluences:
🧩Fair Value Gaps (FVGs) identified within the 0.75–0.25 retracement zone, acting as re-entry and mitigation areas.
🧩Breaker Block formation confirmed following BOS, validating bullish continuation setup.
🧩Volume expansion visible around 3550 region, signalling strong buy-side interest.
🧩Kaufman Adaptive Moving Average (KAMA) providing dynamic trend support near 3475 level.
📈Target Narrative:
We assume that price aims to rebalance inefficiency toward the 3,800–3,850 liquidity zone, corresponding to prior unmitigated FVG and institutional range midpoint.
🔹 Narrative & Sentiment
The setup reflects a buyside re-accumulation model emerging from deep discount levels post-sell climax. The corrective structure within the descending wedge aligns with the Wyckoff “Spring” and “Test” phase, suggesting smart money re-entry before expansion.
Macro sentiment also supports ETH strength into mid-November amid rotational flow from BTC dominance cooldown and speculative positioning ahead of CPI data.

Ethereum analysis Hello traders,
Ethereum, based on the higher time frame (weekly) and the lower time frame (4-hour), is showing bullish potential. As you can see, after taking liquidity below the weekly level and returning to the previous range — along with a confirmed trigger candle on the 4-hour chart and RSI dropping below 30 (oversold) — I believe we could see Ethereum retest the $4,000 level.
Stay profitable!

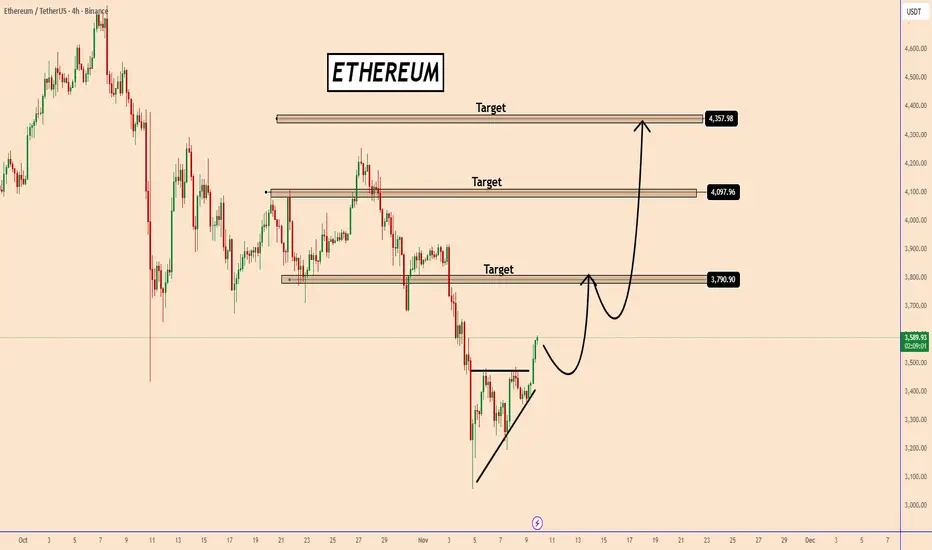
Ethereum Poised for a Bullish ReversalEthereum Poised for a Bullish Reversal
Ethereum has been consolidating in an ascending triangle pattern after a strong bearish move, showing signs of a potential bullish breakout. The price is currently pushing higher from the recent lows, indicating that buyers are slowly regaining control.
If momentum continues, ETH could first test the resistance near $3,790, where a short consolidation may occur before aiming for the next upside targets.
A confirmed breakout above that zone could open the path toward $4,097 and eventually $4,357, aligning with previous supply areas.
As long as ETH stays above the recent structure low, the bullish scenario remains valid.
Key Targets:
🎯 $3,790
🎯 $4,097
🎯 $4,357
You may find more details in the chart!
Thank you and Good Luck!
❤️PS: Please support with a like or comment if you find this analysis useful for your trading day❤️
Long trade 📘 Trade Journal Entry
Pair: ETHUSDT.P
Date: Thu 7 Nov 2025
Session: London → New York AM
Direction: Buy-side Trade
Timeframe: 1 Hour
🔹 Trade Details
Entry: 3202.91
Take Profit (TP): 3803.73 (+18.76 %)
Stop Loss (SL): 3181.80 (–0.64 %)
Risk / Reward (RR): 28.54 R
🔹 Market Context
The structure shows a clear Selling Climax with heavy volume expansion, signalling the potential completion of the markdown leg.
🧾A Secondary Re-test at the 3200 base level confirms buyer absorption and shift in short-term order flow.
🧾The Consolidation Phase and Preliminary Stop above mark prior distribution range now serving as the target zone (premium liquidity pool).
🧾KAMA (MA) flattening suggests a transition from distribution to accumulation.
🧾Price defended the POI (Point of Interest) at ≈ approximately 3244, forming higher lows in the intraday structure — confirmation of buyside intent.
1Hr TF
🔹 Model Type
Accumulation → Re-accumulation → Continuation Model
🧾The setup follows a textbook Wyckoff Accumulation: Selling Climax → Automatic Rally → Secondary Test → Spring → Markup.
🧾The Spring formed via liquidity sweep below 3200, reclaiming structure with strong close and volume support.
🔹 Execution Notes
Entry refined at re-test of the spring low on volume tapering (sign of absorption).
Risk confined below the Selling Climax wick. Target placed at prior consolidation premium zone (≈ 3.8 k) aligning with inefficiency fill. Volume profile and session timing support entry during London–New York overlap, consistent with institutional execution windows.
🔹 Trade Narrative
This ETHUSDT setup captures a phase-transition shift from markdown into early markup.
After the Selling Climax, the market re-tested structural demand at 3200 — confirming buyer presence. The confluence of liquidity sweep, volume divergence, and EMA / KAMA flattening provides a strong foundation for a buyside reversal.
🧩The trade aims to ride the short-term expansion leg toward the higher-timeframe premium zone, capturing displaced liquidity left by prior distribution. A clean break and close above 3.4 k would further confirm continuation toward the 3.8 k objective.

ETH short term tradeI noticed activity of big whales, according to on-chain data, people are buying ETH, including Bitmine, but looking at the chart we can see that ETH lost a strong support level of $3900, we should wait we upcoming liquidity after seeing new Trump's announcement about giving away $2000 to everyone in the USA. So far I'm waiting for return of the price back to ex support level and after giving reacting from there, Ima going to open a long position.

ETH-USDTIt has reached the support level at 3450 again.
If it can stay above this,
it could rise again up to the top of the range box at 3715 🔼🔼
Keep an eye on the chart 👀💰

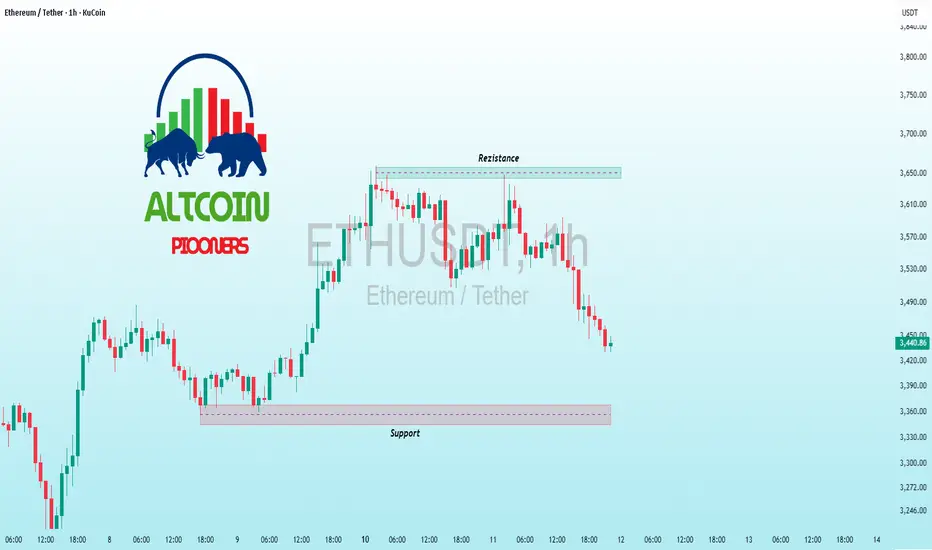
$ETH Pullback to Support – Rebound Chance?KUCOIN:ETHUSDT CRYPTOCAP:ETH Pullback to Support – Rebound Chance?
ETH's 1H chart in correction mode, rejecting resistance at 3.66k and now probing support ~3.32k at 3.45k—strong hold here could spark bounce to 3.50k retest, but breakdown risks deeper to 3.20k on sustained selling.
Bullish bias lingers.
Key indicators: RSI at 45 (neutral, watch oversold), 50MA descending, MACD bearish crossover.📉🔄
#ETH #Ethereum #AltcoinPioneers
Ethereum Bulls Defending $3,500 Zone – Time to Rise?Today, I want to walk you through a quick 15-minute timeframe analysis of Ethereum ( BINANCE:ETHUSDT ), so stick around.
Right now, Ethereum is hovering near a Support zone($3,520-$3,348) and a Cumulative Long Liquidation Leverage($3,507-$3,460) .
From an Elliott Wave standpoint, it seems like Ethereum is wrapping up a microwave Y of the main wave 4.
Also, looking at the ETHBTC ( BINANCE:ETHBTC ) chart, Ethereum is in a favorable position there as well, which suggests that if Bitcoin ’s( BINANCE:BTCUSDT ) price increases, Ethereum might see an even stronger upward move.
My expectation is that in the coming hours, Ethereum can resume its bullish trend , push up toward the Resistance lines , and then aim for the next Resistance zone($3,726-$3,649) .
First Target: $3,631
Second Target: $3,665
Third Target: $3,707
Stop Loss(SL): $3,449
CME Gap: $3,513-$3,483
Cumulative Short Liquidation Leverage: $3,715-$3,671
Please respect each other's ideas and express them politely if you agree or disagree.
Ethereum Analyze (ETHUSDT), 15-time frame.
Be sure to follow the updated ideas.
Do not forget to put a Stop loss for your positions (For every position you want to open).
Please follow your strategy and updates; this is just my Idea, and I will gladly see your ideas in this post.
Please do not forget the ✅' like '✅ button 🙏😊 & Share it with your friends; thanks, and Trade safe.

#ETHUSDT: Fill The Gap At $3200, Target At $6000 The significant price gap has been closed and the market is now in correction mode. We anticipate a further decline of approximately $3200 which remains a key support level for buyers. Our next step is to observe the market’s reaction and remain patient.
Please note that this is not a guarantee and you should always conduct your own research before making any significant investment decisions.
Best regards,
Team Setupsfx
ETH/USDT | Ethereum Eyes $4K After Holding Above Key Support!By analyzing the Ethereum (ETH) chart on the weekly timeframe, we can see that after the previous analysis, the price started rising from $3300 and climbed up to $3700 before facing a correction.
Currently, ETH is trading around $3500, and we’ll need to see if it can hold above $3300 in the next couple of days. If it manages to stay above this level, we can expect a bullish continuation toward $4000.
Please support me with your likes and comments to motivate me to share more analysis with you and share your opinion about the possible trend of this chart with me !
Best Regards , Arman Shaban

ETH - Still Bearish BUT...📉ETH has been trading inside a falling red channel , keeping the short-term outlook bearish for now. As long as price remains within this structure, sellers continue to dominate.
⚔️However, ETH is now approaching a massive confluence zone between $2850 and $3000, which aligns with the lower bound of the channel, an area that has acted as a powerful support in the past.
🏹From here, I’ll be looking for potential long setups, anticipating a rebound toward the $3850–$4000 resistance area. But for the bulls to fully take over long-term, a confirmed break above $4000 is essential.
Could this be the last dip before Ethereum’s next explosive move? 👀
⚠️ Disclaimer: This is not financial advice. Always do your own research and manage risk properly.
📊All Strategies Are Good; If Managed Properly!
~Richard Nasr

ETHUSDT the supports are holding strong to pump it upAs observed on the ETHUSDT chart, the previously identified support zone near $3,100 has demonstrated expected resilience, validating our technical assessment. The price is now undergoing a corrective phase as it tests a significant trendline resistance around $3,700. We anticipate a potential breakout above this resistance level, which would signal renewed bullish momentum and establish a projected trajectory toward initial targets at $4,000, followed by a secondary objective at $5,000.
DISCLAIMER: ((trade based on your own decision))
<<press like👍 if you enjoy💚

ETHUSDT – Reclaiming Liquidity Zone, Eyeing Supply TestETH successfully closed above the $3,350 liquidity area on both the 3D and weekly timeframe, confirming a clean liquidity sweep and reclaim. This type of move often signals the start of a bullish rebound, which we’ve already seen with ETH recovering strongly over the weekend.
Currently, price is likely heading toward the supply zone between $3,930 – $3,795, where we should monitor the reaction closely. A rejection from this zone could trigger a short-term pullback, potentially revisiting the $3,350 support area once again. However, if ETH manages to break and close above this supply, the next major challenge will be the key resistance near $4,089, a crucial level before retesting the All-Time High (ATH) region.
On the flip side, the bearish scenario would be a weekly close below $3,350, opening the door for a deeper retracement toward the Monthly Order Block (OB) zone around $2,878 – $2,125. This could unfold if Bitcoin also drops below the $100K level, reinforcing broader market weakness.
