ETH long to 4506The Bearish Candlestick and Volume aren't strongdecline cannot continue cannot continue
so Long now to 4506
Trade ideas

ETH/USD Short Trade Idea on S/R FlipIt looks like ETH has done a S/R Flip and is now trying to come down.
If it breaks the level of 4395, we can take a 1:1 Short Trade here. Let's see how it goes.

ETH-USDTThere was a pullback to the $226 level 🔽
If the trend line is broken, the correction could continue to the two green supports
The main and important support is around $200

ETHEREUM will holdEthereum has 2 supports in 4H timeframe with bullish divergence on RSI, and I think it will bounce from those areas

The U.S.–China Trade WarIntroduction
The U.S.–China trade war, one of the most significant economic confrontations in modern history, represents far more than a dispute over tariffs and trade imbalances. It is a geopolitical and economic conflict between the two largest economies in the world—one an established superpower, the United States, and the other, China, an emerging global powerhouse. At its core, the trade war reflects deeper struggles over technology, global influence, intellectual property rights, and the future architecture of the global economy.
Beginning officially in 2018 under the administration of U.S. President Donald Trump, the trade war disrupted global supply chains, affected billions of consumers, and redefined international trade relations. The tariffs imposed by both sides reshaped business decisions, investment patterns, and economic strategies across the globe. Although several rounds of negotiations and partial deals have attempted to ease tensions, the rivalry persists, influencing trade policy, economic planning, and diplomacy even into the mid-2020s.
This essay explores the origins, dynamics, and far-reaching consequences of the U.S.–China trade war. It examines the historical background, economic and political motivations, key developments, global reactions, and long-term implications for international trade and economic order.
1. Background: U.S.–China Economic Relations Before the Trade War
1.1 The Rise of China as a Global Economic Power
Over the past four decades, China’s economic transformation has been nothing short of remarkable. Following economic reforms initiated by Deng Xiaoping in 1978, China transitioned from a centrally planned system to a market-oriented economy. The nation’s entry into the World Trade Organization (WTO) in 2001 marked a turning point, integrating China into the global trading system and allowing it to become the “world’s factory.”
China’s GDP grew at an average of 9–10% annually for decades, lifting hundreds of millions out of poverty. Its exports—ranging from low-cost manufactured goods to high-tech products—flooded global markets. By 2010, China surpassed Japan to become the world’s second-largest economy.
1.2 The U.S.–China Trade Relationship
For decades, the U.S. and China maintained a mutually beneficial, though increasingly unbalanced, trade relationship. The United States became China’s largest export market, while American companies gained access to cheap Chinese manufacturing and labor. However, this relationship created large trade imbalances. By 2017, the U.S. trade deficit with China exceeded $375 billion, the largest bilateral trade deficit in the world.
While American consumers benefited from lower prices, U.S. policymakers and industries grew concerned about lost manufacturing jobs, intellectual property theft, and China’s alleged unfair trade practices. These issues planted the seeds of economic confrontation that would later erupt into a full-scale trade war.
2. Causes of the U.S.–China Trade War
2.1 The Trade Imbalance
A central grievance of the U.S. was the massive trade deficit with China. The Trump administration viewed this imbalance as evidence that trade relations were unfair and that China was manipulating the system to its advantage. While economists argue that trade deficits are not inherently harmful, politically, the deficit symbolized lost jobs and weakened American industries.
2.2 Intellectual Property and Technology Theft
Another major factor was the alleged theft of intellectual property (IP). The U.S. accused China of forcing American companies operating in China to transfer technology as a condition of market access. Reports suggested that Chinese firms benefited from stolen U.S. trade secrets, patents, and software, particularly in advanced sectors like aerospace, semiconductors, and biotechnology.
2.3 “Made in China 2025” Strategy
China’s “Made in China 2025” initiative, launched in 2015, aimed to transform the country into a global leader in advanced manufacturing and high-tech industries such as robotics, AI, and renewable energy. The U.S. perceived this policy as a direct challenge to American technological dominance and economic leadership. Washington feared that China’s state-led industrial policies would tilt global competition unfairly.
2.4 Currency Manipulation Accusations
The U.S. also accused China of artificially devaluing the yuan to make Chinese exports cheaper and imports more expensive, thereby maintaining its export competitiveness. Although this accusation has been debated, it contributed to the perception that China was manipulating market dynamics to gain an advantage.
2.5 Political and Strategic Rivalry
Beyond economics, the trade war was deeply rooted in strategic competition. The U.S. viewed China’s growing influence in Asia, its Belt and Road Initiative, and its military modernization as a challenge to American global dominance. Thus, the trade conflict became a proxy for broader geopolitical rivalry.
3. Timeline of Key Events
3.1 2018: The War Begins
March 2018: The U.S. imposed tariffs on steel (25%) and aluminum (10%) imports, targeting China among other nations.
April 2018: China retaliated with tariffs on $3 billion worth of U.S. goods, including agricultural products.
July 2018: The U.S. imposed 25% tariffs on $34 billion worth of Chinese goods. China responded in kind.
September 2018: The U.S. levied tariffs on $200 billion worth of Chinese imports, prompting further Chinese retaliation.
3.2 2019: Escalation and Negotiations
May 2019: Trade talks broke down, and the U.S. increased tariffs on $200 billion of Chinese goods from 10% to 25%.
August 2019: The U.S. labeled China a “currency manipulator.”
December 2019: Both nations agreed on a “Phase One” trade deal, easing tensions.
3.3 2020: The Phase One Deal
The Phase One Agreement, signed in January 2020, required China to purchase an additional $200 billion in U.S. goods over two years and improve intellectual property protections. However, the COVID-19 pandemic disrupted trade flows, and China failed to meet its purchase commitments.
3.4 2021–2024: Lingering Tensions
Even after President Joe Biden took office, most tariffs remained in place. The administration maintained a tough stance on China, focusing on strategic decoupling, technology restrictions, and alliances with other democratic nations to counter China’s rise. The U.S. CHIPS and Science Act (2022) and export controls on semiconductors further intensified competition.
4. Economic Impact of the Trade War
4.1 Impact on the U.S. Economy
The trade war had mixed effects on the American economy.
Manufacturing and Agriculture: U.S. manufacturers faced higher input costs due to tariffs on Chinese components, while farmers suffered from China’s retaliatory tariffs on soybeans, pork, and corn. The U.S. government provided billions in subsidies to affected farmers.
Consumers: American consumers paid higher prices for goods such as electronics, clothing, and furniture. Studies by the Federal Reserve and academic institutions found that most tariff costs were passed on to U.S. consumers.
Employment: While some domestic industries benefited from tariff protections, others faced uncertainty, layoffs, and reduced investment.
4.2 Impact on the Chinese Economy
China also faced significant challenges:
Export Decline: Chinese exports to the U.S. fell, forcing many manufacturers to seek alternative markets.
Economic Slowdown: China’s GDP growth slowed from over 6% in 2018 to around 5% in 2020.
Currency Fluctuations: The yuan depreciated during the height of the trade war, cushioning export losses but signaling instability.
Policy Response: China implemented fiscal stimulus measures and accelerated domestic innovation to reduce reliance on U.S. technologies.
4.3 Global Impact
The trade war had global ripple effects:
Supply Chains: Many multinational companies diversified production away from China to countries like Vietnam, India, and Mexico.
Commodity Markets: Global demand fluctuations affected prices for oil, metals, and agricultural goods.
Stock Markets: Trade tensions fueled market volatility and investor uncertainty.
Global Growth: The International Monetary Fund (IMF) estimated that the trade war shaved 0.8% off global GDP by 2020.
5. Technological Competition and Decoupling
5.1 The Technology Frontline
Technology became the heart of the trade war. The U.S. targeted Chinese tech giants like Huawei and ZTE, citing national security concerns. Restrictions were imposed on the export of American semiconductors, software, and equipment to Chinese firms. The U.S. also pressured allies to exclude Huawei from 5G networks.
5.2 Semiconductor and AI Race
Semiconductors emerged as the most critical battleground. The U.S. sought to limit China’s access to advanced chips used in artificial intelligence and defense systems. In response, China invested heavily in building its domestic semiconductor capabilities, aiming for technological self-sufficiency.
5.3 Digital Decoupling
The concept of “decoupling”—separating U.S. and Chinese technological ecosystems—gained traction. This shift included restrictions on data sharing, investment screening, and the creation of alternative technology supply chains. While full decoupling remains unlikely, the trend has reshaped the global tech landscape.
6. Political and Strategic Dimensions
6.1 Nationalism and Domestic Politics
In both countries, nationalism played a major role. In the U.S., the trade war was framed as a battle to protect American jobs and sovereignty. In China, the government used the conflict to rally domestic support and promote economic self-reliance under slogans like “dual circulation” and “national rejuvenation.”
6.2 Global Alliances and Power Shifts
The trade war pushed countries to reassess alliances and trade policies. The European Union, Japan, India, and ASEAN nations found themselves balancing relations between the U.S. and China. Many nations benefited from supply chain diversification, attracting new investments as companies sought alternatives to China.
6.3 The New Cold War Narrative
Many analysts have described the trade war as part of a broader “New Cold War”—an ideological, technological, and strategic struggle between democratic capitalism and authoritarian state capitalism. Unlike the U.S.–Soviet Cold War, however, the U.S. and China remain economically intertwined, creating a complex interdependence.
7. Lessons Learned and the Future of Global Trade
7.1 The Limits of Tariffs
The trade war demonstrated that tariffs alone cannot resolve complex structural issues. While they exerted pressure, they also harmed domestic stakeholders and disrupted global commerce. Both economies remained resilient but not without cost.
7.2 The Shift Toward Protectionism
The conflict accelerated a broader global shift toward economic nationalism and protectionism. Countries began to prioritize domestic production, strategic autonomy, and resilience over globalization. The COVID-19 pandemic further reinforced this trend.
7.3 The Redefinition of Global Supply Chains
Multinational corporations began adopting a “China + 1” strategy—maintaining operations in China while expanding production elsewhere. This diversification has benefited emerging economies like Vietnam, India, and Indonesia.
7.4 The Rise of Technological Sovereignty
Both nations are pursuing technological sovereignty—control over critical technologies like semiconductors, 5G, and AI. This race will define future power dynamics more than traditional trade measures.
8. The Way Forward
8.1 Diplomatic Engagement and Cooperation
Despite tensions, cooperation remains essential on global issues like climate change, cybersecurity, and pandemic response. Constructive dialogue and adherence to multilateral institutions such as the WTO can prevent further escalation.
8.2 Economic Rebalancing
Both nations must address the structural causes of imbalance. The U.S. should invest in innovation, education, and industrial competitiveness, while China should open markets, reform state enterprises, and enhance transparency.
8.3 The Role of Multilateralism
Global trade institutions need reform to reflect modern economic realities. A rules-based system that ensures fair competition and technological collaboration is crucial for global stability.
Conclusion
The U.S.–China trade war is more than a dispute over tariffs or trade deficits—it is a defining conflict of the 21st century that encapsulates the struggle for global leadership in economics, technology, and ideology. While both nations suffered short-term losses, the deeper consequence has been a reconfiguration of the global economic order.
The trade war accelerated shifts toward protectionism, technological nationalism, and supply chain diversification. It exposed vulnerabilities in global interdependence and highlighted the need for a balanced approach between competition and cooperation. As both the U.S. and China continue to shape the post-globalization era, the rest of the world watches closely, adapting to the new reality of multipolar economic power.
Ultimately, the future of global prosperity depends not on economic warfare but on how effectively the two giants can coexist—balancing competition with collaboration, and rivalry with responsibility. Only through a stable and fair trade environment can sustainable global growth be achieved in the decades ahead.

ETH LONG - Bullish reversal anticipation
On the H1 timeframe, a Market Structure Shift (MSS) has been observed, indicating a potential change in trend direction and establishing a bullish bias following a sweep of the previous day’s low (PDL).
We are currently anticipating a retracement towards a potential buy zone, specifically around the 0.6182 Fibonacci retracement level.
This level is further supported by confluence from a visible imbalance, an unfilled Fair Value Gap (FVG) on the M5 chart within the same price region.
Additionally, on the M15 timeframe, the closure of a series of bearish (down-close) candles during the retracement phase suggests a possible bullish reversal setup.
Moreover, there is a clear draw on liquidity (DOL) on the buyside, supported by an unfilled imbalance on the H1 chart (Sell-side Imbalance Buy-side Inefficiency – SIBI) in alignment with a cluster of equal highs (EQ highs). This strengthens the bullish case, as price may seek to target this liquidity resting above.
I am expecting price to be manipulated towards our POI during NY session open.
Our strategy will be to monitor price action closely as it approaches the point of interest (POI), the M5 unfilled FVG for signs of a favorable reaction before considering any entries. 🧑💻 🎯
Will keep you updated on this trade , talk to you soon !

ETH Second retest completed soon above 5.5KThe major resistance which was red trendline broke successfully and now price did complete retest there and soon we can expect more gain and rise here to the 5500$ at least and even 7000$.
DISCLAIMER: ((trade based on your own decision))
<<press like👍 if you enjoy💚

ETHUSDTPersonally I don't see a clear trade on this
Although I short from top but I'm out cuz I think we might still see a move upward
Let's see how BTC moves
Note: don't force a trade if you don't see a clear entry
Stay out

#ETHUSDT 4H ChartPrice is currently sitting on the EMAs and consolidating on lower timeframes after getting rejected off our 6h supply zone and leaving another 4h supply at $4,650. MACD is showing bearish weakness, RSI is sold and EMAs are bullish. Price should tap into the 4h supply zone before potentially retracing again.

ETH - UPDATECRYPTOCAP:ETH - price update: 5000$+ next? 👀📈
Let's keep it simple and not change the plan.
🟩Weekly candle close above 5000$ could confirm price discovery mode 📈
🟨Double top resistance under 4950$ & rejection possible.
Bullish momentum building above 3800$, exactly as predicted (50% fib test) (correction) to grab liquidities & confirm potential new uptrend + ATH breakout.
The best to do for me is to keep an eye on the consolidation area: 4800$ - 3800$ to track the next big wave!
Without breakout confirmation, price could move on both side for now.
Overall, as long as the monthly and weekly candle remain above 3780$, bulls are in control.
Key levels:
4950 - 4840 - 4750 - 4400 - 4350 - 4230 - 4090 - 3850 -3800 - 3560 - 3200

ETH - UPDATE - MASTERCLASSCRYPTOCAP:ETH - 22/09 vs today: Update - MASTERCLASS 🔥
"Still bullish medium/long term, but a further correction is very possible before liftoff!
Bulls need to hold $3780. Below = trouble…Above = game still on for ATH attempts later. 📉"
Insane setup shared if you followed! 3800$ liquidities grab ✅
Prices is up 23%+ from this zone mentionned! 🔥
Are we ready to fly toward 5000$ now??
I'll let you discover on the next analysis Im working on!
Life if you want to see it! 👍

Ethereum (ETH): Looking For Reversal And Bullish Dominance!ETH had a good rally to upper zones until yesterday's liquidity sweep, where the price had taken out high-leverage traders.
Despite that, we are still above our local support zone and EMAs so our game plan for Ethereum has not changed at all. Currently seeing signs of MSB forming on smaller timeframes, so as soon as we get one, we expect a similar price movement to happen like we had yesterday (just in upside direction)
Swallow Academy

ETH USDTEthereum I expect to see prices between 5200 and 5800 in the short term
And with this jump I think wave 5 will end and we can enter a correction wave
No analysis is 100%

ETH -bias long Bullish indications:
Previous day's close is respected.
MA 21 being respected.
HHHL
Hammer candle formed.
Bullish wedge formation
Trend line resistance break.
Bullish divergence.
IHS formation in 15 min.
Bearish indications:
MA 21 is still bove the price in 1 hr
Trade plan bias long @ 4497
SL:4417
TP1:4585
TP2:4663

ETH Pullback Setup – Eyeing the Next Wave Down💥 🌊
📊 Current Setup
On the lower time frames, ETH couldn’t hold that $4,750 zone — price got smacked down hard by the bears, printing a clean double top up there 😤. After that rejection, we broke structure and even printed a new low, showing that bulls are runnin’ low on energy for now ⚡.
🚦 Scenarios
👉 I’m watchin’ for a pullback into resistance — a clean retrace could offer a sweet entry for the next leg down.
👉 Target zone sits near $4,250 support, where the next bounce might line up 🌊.
👉 If ETH somehow regains momentum and flips $4,750 back into support, that’d cancel the bearish play and open room for a higher push 🚀.
🧭 My Take
Structure looks clean, momentum’s clear — bears got control short-term. I’m just waitin’ for that perfect retracement setup to jump in and ride the next wave down for some solid gains 🏄♂️💥. Until then, patience over impulse 🤙.
💬 What do you think about this scenario? Only share your idea if you’ve got another opinion — otherwise just hit that button 👍

ETH Range Watch – Calm Before the Next Set🌀 🌊
📊 Current Setup
ETH’s been cruisin’ sideways for a bit now — price is locked inside a tight range and the daily chart’s showing clean consolidation. Zoom out to the weekly and you’ll spot it shaping into a wedge pattern, pressure building like a tide ready to shift 🌊.
We’re basically boxed in between $4,000 support and $4,750 resistance. That’s the battlefield — bulls are holding the floor, bears are guarding the ceiling.
🚦 Scenarios
👉 Bullish breakout: If ETH can break and hold above $4,750, then build a fresh higher low on the retest, that’s when the next leg of the run could kick off 🚀.
👉 Range continuation: If we keep bouncing inside, the play’s just to surf the channel, buying support, trimming near resistance, and keeping stops tight.
👉 Bearish break: A clean drop below $4,000 would flip structure short-term — but so far, buyers keep paddling back every time it dips.
🧭 My Take
No need to fight the chop here. The best trades come when the market shows its hand — patience pays. Set your alerts around the key zones, manage exposure, and let the next big move come to you, not the other way around 🏄♂️💨.
💬 What do you think about this scenario? Only share your idea if you’ve got another opinion — otherwise just hit that button 👍

ETH-USDTThe first target I gave was hit
5% correction without leverage from yesterday to now ✔️🔽
Now the failure or not can determine whether the move continues to 4230 or not

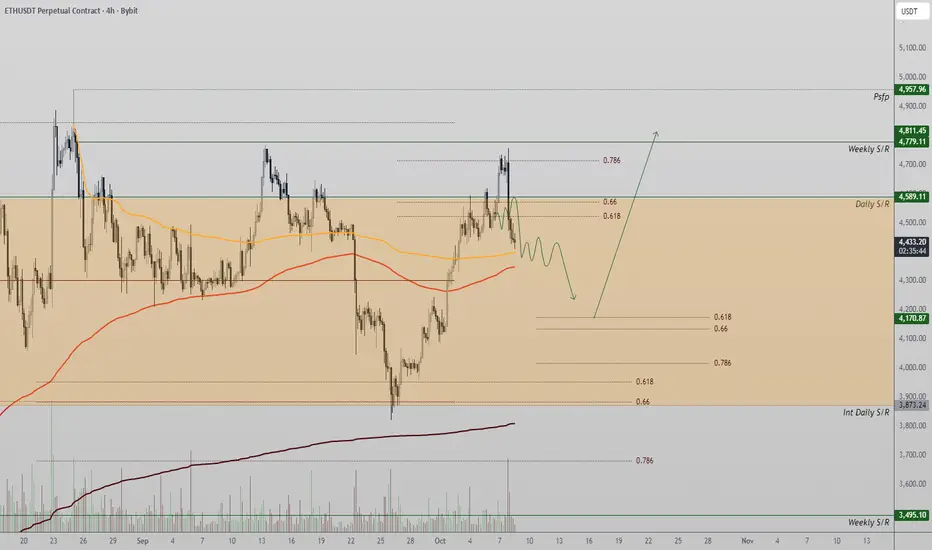
Ethereum Maintains Bullish Structure Despite Range Re-entryEthereum re-entered its prior trading range after a failed breakout above $4,589. Despite the retracement, market structure remains bullish, with a potential higher-low formation developing near the 0.618 Fibonacci zone.
Ethereum’s recent failure to sustain momentum above the $4,589 resistance led to a quick re-acceptance back into its prior range. This type of “failed auction” pattern often triggers short-term corrections, allowing the market to rebalance and find fresh demand at lower levels. However, despite the rejection, the broader uptrend remains intact, supported by higher highs and higher lows on both the daily and weekly timeframes.
The area between $4,250 and $4,300 represents a critical support zone — aligning with the 0.618 Fibonacci retracement level. Historically, ETH has treated this level as a springboard for continuation moves during trending conditions. A controlled pullback into this region would likely attract dip buyers, reinforcing the macro bullish narrative. Furthermore, on-chain metrics show steady network activity and staking participation, which supports long-term accumulation.
Should ETH reclaim the $4,589 zone, bullish continuation toward $4,950–$5,000 becomes likely. Conversely, if the 0.618 level fails to hold, a deeper retracement into $4,050 could occur before recovery.
What to Expect:
Ethereum remains bullish overall, with the current dip seen as corrective. A confirmed higher low at the Fibonacci zone would reaffirm momentum toward $5,000 resistance in the sessions ahead.
ETH/USD on Support! Buy Setup!ETH/USD is testing a strong support. With an Instant Buy entry, we can take a 1:3 trade with low risk.

ETH/USD Buy Setup on Range BreakoutETH is in a range on 1H Timeframe. If it breaks this range in the upward direction, we can take a 1:1 trade. I have placed a Buy-Stop order above the range. Let's see how it goes.

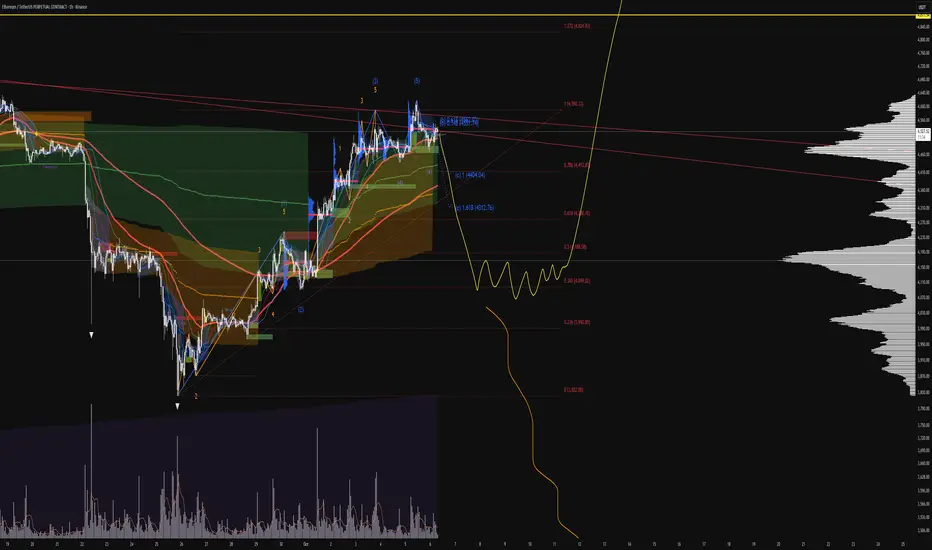
ETH UPDATE - Return to Entry Level, Short Trade InitiatedIn similar fashion to the Bitcoin trade today, here is details on my ETH Short Flash Crash idea.
For detailed information and explanation, please see my linked related posts made today.
Entry / Risk Management:
Entry - 4,460 to 4,480
Stop Loss - 4,800
Take Profits:
1) 3,400 - 20-50% Closure
2) 2,550 - 20% Closure
3) 1,650 - 40-60% Closure
4) 200 - 100% Closure
ETH may create a 3 wave corrective move - and I will be hedging with a long position from 1,600 to 3,000 - timed entry with Bitcoin hitting 35,000
I will buy SPOT ETH only at the range of 200-500
Yours truly,
- DD
ETH | 6 Hrs | Long | Target +10%This technical analysis is for informational and educational purposes only. It does not constitute financial advice. Remember to always research and consult with a professional before making investment decisions. Good luck! 📈💼🚀

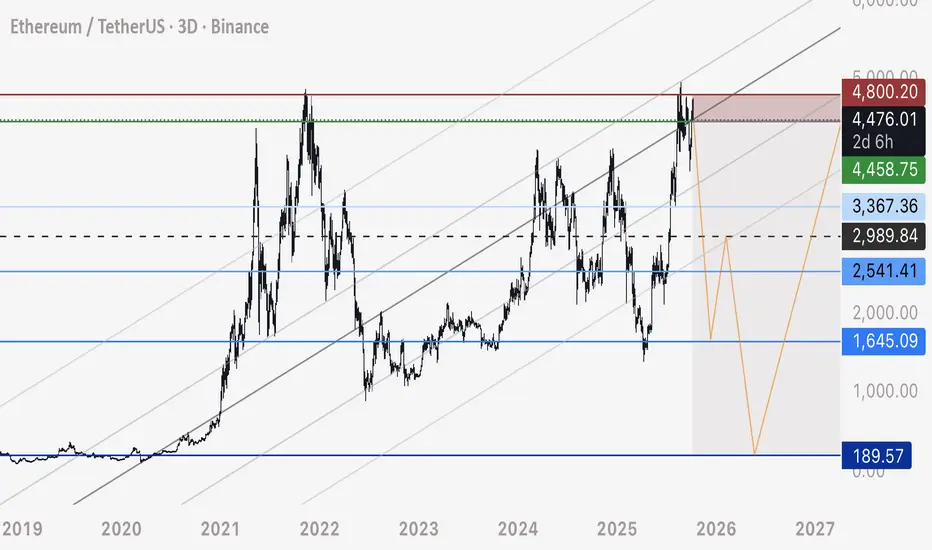
ETHUSDT price have strong resistenceRight now, Ethereum is at the third touch on the descending (resistance) trendline.
Usually, when we reach the third touch, the price tends to fall.
We’re currently below the major resistance level at 4877, and in my opinion, on the monthly and three-month timeframes, the price doesn’t have enough strength to break through this level yet.
A correction is needed before we can break it.
That’s why at the moment, I’m more inclined toward short positions.
If you like the idea, please put a ‘like’. It's the best ‘Thank you!’ 😊 P.S. Always do your own analysis before a trade. Set a stop loss. Capture profits in instalments. Withdraw profits in fiat and make yourself and your friends happy.