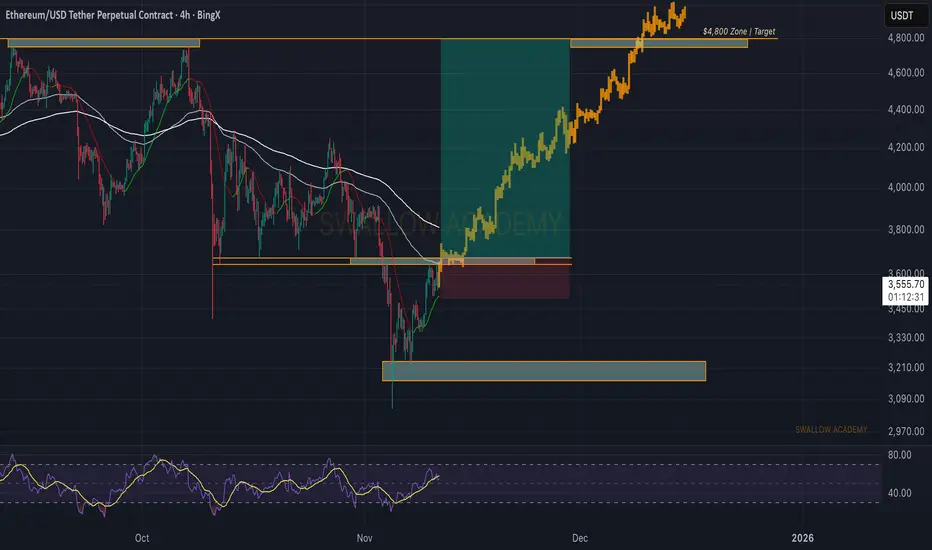
Ethereum (ETH): Looks Promising | Expecting Bullish BreakoutETH looks good here at the start of the week, where during the weekends we had a decent BOS and now the price is sitting slightly below the 100EMA, where we are expecting a similar move like on BTC, a breakout!
Once we see the proper breakout from current zones, we will be looking for an upside movement, which might mark a start for bigger movement towards the current target of $4,800 (and then $5,555)
Swallow Academy
Trade ideas
ETH + BULLISH CROSSEvery time Ethereum has a bullish cross on the Stochastic RSI in the oversold area, we see a rally for a few weeks.

ETH-USDTBetween the two green boxes, it has experienced some range.
As long as it can stay above 3480
and can break the resistance above it at 3715 📊,
it can start a new leg toward its next resistance 🔼🔼

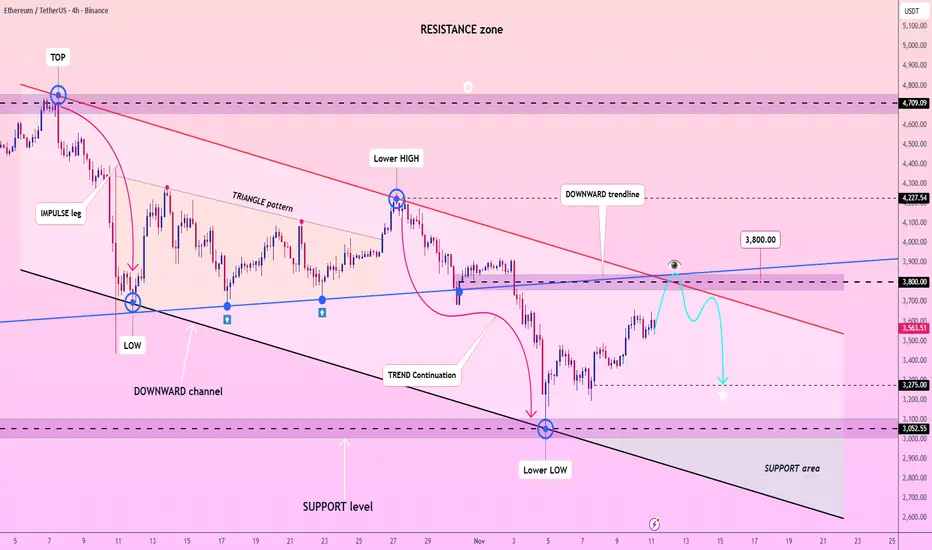
Lingrid | ETHUSDT Pullback Sell Downside ExtensionBINANCE:ETHUSDT is approaching the $3,800 resistance after testing the lower boundary of the downward channel. The market structure forms a clear lower-high sequence beneath a descending trendline, confirming the persistence of bearish pressure. As long as the price remains below $3,800 and inside the channel, bearish movement toward the $3,275–$3,100 support area remains likely. This corrective phase reflects a broader continuation of the bearish trend that began near the $4,700 resistance zone.
⚠️ Risks:
A break above $3,800 could invalidate the bearish setup.
Softer U.S. inflation data could weaken the dollar and lift crypto sentiment.
Unexpected strength in Ethereum network activity may trigger a rebound rally.
If this idea resonates with you or you have your own opinion, traders, hit the comments. I’m excited to read your thoughts!
Examples of Using the StochRSI Indicator
Hello, fellow traders!
Follow us to get the latest information quickly.
Have a great day!
-------------------------------------
The StochRSI indicator combines the Stochastic indicator with the RSI indicator.
You can find more detailed explanations of this indicator online.
I'd like to explain how to utilize the StochRSI indicator to aid trading.
The standard way to interpret the StochRSI indicator is to interpret chart movements by touching and breaking out of overbought or oversold zones.
The method I use, utilizing this principle, is to draw a trend line.
That is, when the K value of the StochRSI indicator forms a peak in the overbought or oversold zone, I connect those points to create a trend line.
This creates a trend line like the one drawn in the example chart above.
However, when drawing a trend line, the candlestick that forms the peak in the overbought zone must be the open value of a bearish candlestick.
If not, the open value of the first bearish candlestick encountered to the right is used.
In the oversold zone, the peak is the low value.
-
I've also included a second method for interpreting the StochRSI indicator.
When the indicator is activated, the chart above will appear.
This can be intuitively seen by the StochRSI indicator appearing on the price candlestick.
To sustain an uptrend, the price must remain above the StochRSI 80 level.
Therefore, the StochRSI 80 level acts as resistance.
A decline below the StochRSI 20 level likely indicates a downtrend.
Therefore, the StochRSI 20 level acts as support.
This interpretation can be helpful when entering a trade.
However, the most important points are the support and resistance levels drawn on the 1M, 1W, and 1D charts.
Therefore, observing the movement of the StochRSI indicator near the support and resistance levels drawn on the 1M, 1W, and 1D charts can help you determine the trend.
-------------------------------
The StochRSI and RSI indicators are also indicators that utilize averages.
When interpreting indicators that utilize averages, it's important to consider the location of the average and how to interpret it accordingly.
Therefore, the StochRSI 50 indicator point can be used as an average.
Therefore, you can initiate a trade based on whether there is support at the StochRSI 50 indicator point.
As mentioned earlier, the most important points are the support and resistance levels drawn on the 1M, 1W, and 1D charts. Therefore, you should check the movement of the StochRSI indicator around these support and resistance points.
-
Thank you for reading to the end.
I wish you successful trading.
--------------------------------------------------

$ETH Support Hold or Deeper Dip Ahead?KUCOIN:ETHUSDT CRYPTOCAP:ETH Support Hold or Deeper Dip Ahead?
ETH's 1H chart shows short-term bearish pressure, bouncing off key support at ~3.30k after rejection at 3.66k resistance—holding here eyes rebound to 3.50k, but breach risks drop to 3.20k.
Overall bullish bias intact.
Key watches: RSI nearing oversold (35), flat 50MA, increasing volume on downside. Eyes on BTC correlation! 📉🔄
#ETH #Ethereum #AltcoinPioneers

#ETH/USDT Update. Important level to break!CRYPTOCAP:ETH needs to break above the 200 EMA, a key psychological level, to confirm continuation of the uptrend. Other altcoins are likely to follow if that happens.
Keep a close eye on this level; it could set the tone for the market.
Stay tuned for more charts.
Ethereum (ETH): Momentum is Building | Bullish SignsETH has that recent dip below the EMAs just like we had on the 22nd of June. Similarities can be seen clearly and now if we get that breakout momentum and the price manages to regain the EMAs again, we might be onto a really good entry for a long here so eyes wide open!
Swallow Academy

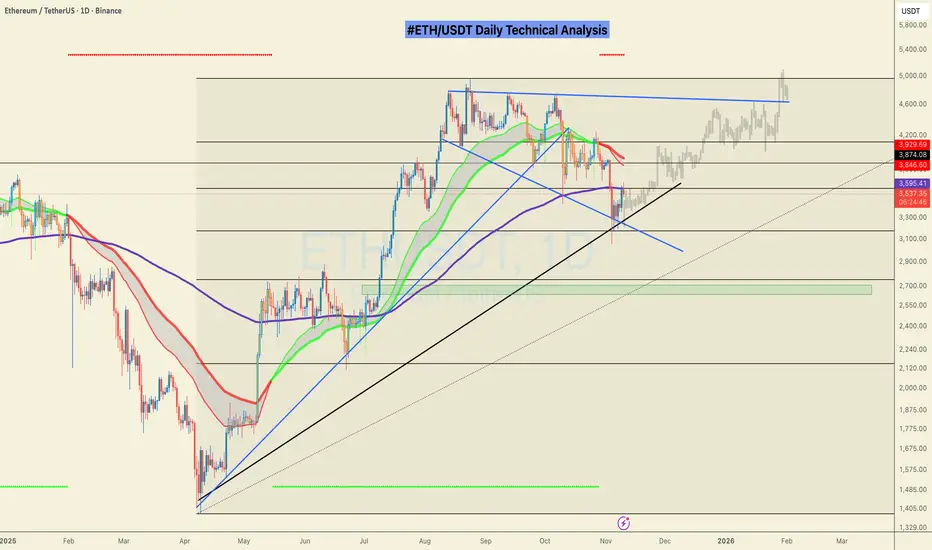
ETHEREUM ETHUSDTTHE structure is giving a weekly rejection on the descending trendline ,if we break and close above 4007.4 look for buy position and target 5000 or more
key demand floor 2573.37-24490 zone
key demand floor 2145-21440
key demand floor 930-10000.
fundamentals of Ethereum
Ethereum is a leading blockchain platform known for its smart contract functionality, enabling developers to build decentralized applications (dApps) across various sectors such as finance, gaming, and digital identity.
Key Features:
Smart Contracts: Self-executing contracts with the terms directly written into code.
Ethereum Virtual Machine (EVM): The runtime environment for executing smart contracts.
Decentralized Finance (DeFi): Ethereum hosts the majority of DeFi applications like lending, borrowing, and stablecoins.
Non-Fungible Tokens (NFTs): Ethereum is the primary platform for NFTs, enabling unique digital assets like art and collectibles.
Layer 2 Solutions: These enhance scalability by processing transactions off-chain before settling on Ethereum’s mainnet.
Proof of Stake (PoS): Ethereum transitioned from Proof of Work to PoS with Ethereum 2.0 (The Merge), improving energy efficiency.
Fundamental Outlook:
Strong institutional adoption with ETFs and large-scale integrations.
Continuous upgrades and scaling solutions aim to reduce gas fees and improve throughput.
Growing ecosystem with thousands of dApps, developers, and users.
Current Price and Market Position
Ethereum (ETH) remains the second-largest cryptocurrency by market capitalization after Bitcoin.
Price movements are influenced by technological upgrades, market sentiment, regulatory developments, and macroeconomic conditions.
Ethereum continues to be a foundational platform for blockchain innovation, powering a broad ecosystem of applications and services
#ethereum

ETH - BearishETHUSDT is in a bearish trend and currently retraced to 0.618 Fib level. Shorting at current levels.

Ethereum (ETH): There is Still Hope | Still BullishIdk about you guys but ETH still looks bullish despite the recent dip we had. The shakeout was huge, that's true, but price still remains near the bullish trend, which means buyers are still holding somewhat the control over that area.
Will be monitoring the ETH for the next days and weeks; as soon as we see bigger signs of recovery (for example, if buyers manage to overtake the zone near the middle line of BB). Meanwhile, we monitor; ETH still has potential!
Swallow Academy

ETH / USDT (4H Timeframe)Pattern: Break & Retest + Ascending Trendline (Bullish Continuation Setup)
The chart shows ETH breaking out of a key resistance zone, retesting it as support, and continuing to move inside a rising trendline channel. This structure signals strong bullish momentum with potential continuation toward the next major supply zone.
Key Observations
🔹 Support Flip Zone: $3,500 – $3,540 — previous resistance now acting as clean support after a successful retest.
🔹 Ascending Trendline: ETH is riding a strong upward channel, forming higher lows and maintaining momentum.
🔹 EMA (50): Price has reclaimed the EMA and is now trading above it, adding bullish confirmation.
🔹 Targets Marked: Chart highlights $3,700 as the first resistance/target and $3,800 as the secondary upside level.
🔹 Structure: As long as ETH holds above the green support zone + trendline, buyers remain in control.
Potential Move
If ETH continues to respect the support zone and trendline:
🎯 Target 1: $3,700
🎯 Target 2: $3,800
A clean break above $3,800 opens a path toward the major resistance zone at $3,820–$3,900.
A breakdown below the trendline or $3,500 zone would weaken the bullish structure and delay the move.
Summary:
ETH is showing a strong bullish continuation pattern after a successful break and retest of key resistance.
Holding above the $3,500–$3,540 support keeps momentum intact, with upside targets at $3,700 and $3,800.
Structure remains bullish unless price loses the rising trendline and dips back into the previous range.
#coinpediamarkets #ETH #ETHUSDT #CryptoAnalysis #TechnicalAnalysis #Altcoins #SupportZone #ResistanceZone #BullishTrend

Ethereum analysisI thing These two levels are the best for eth to give a possible strong reversal towards all time high.
Both levels coincide with fib levels.

ETH Daily: Tracking S&D Reaction and the Deeper QML SetupHi!
Price is currently pulling back toward a key Supply & Demand zone, where a short-term bullish reaction is still possible. This level acted as resistance previously and now lines up as a logical retest area after the recent drop.
However, the broader structure suggests that even if we do see a bounce here, it may only form a temporary correction before the price reaches deeper liquidity. The QML zone below remains the major point of interest.
A sweep into that QML area would fill remaining inefficiencies and tap into the stronger demand needed for a more convincing reversal. From there, the chart opens the possibility for a larger bullish leg heading into 2026.
In short:
Watching for a short-term reaction at S&D
Still expecting a deeper move into QML
That zone holds the higher-probability long setup
This scenario remains valid as long as the structure continues to unwind toward the lower liquidity pool.

ETH$9k target for CRYPTOCAP:ETH is becoming more realistic than ever as price structure continues to strengthen. Momentum is building fast, and both targets are aligning perfectly on the chart. I believe these setups will play out in the very near future, with potential for even higher levels ahead.

seems ETH likely to drop further the support zones on the chart are enough to tell the story price is likely gonna hit the trendline, and in that zone, we can long from there

DeGRAM | ETHUSD held the $3000 level📊 Technical Analysis
● ETH/USD broke out of a consolidation range and is now testing the dynamic resistance line, indicating a potential retest of the $3,500 resistance level. The market recently rebounded from $3,000 support, showing signs of upward momentum.
● The price action respects a rising channel, which could suggest further bullish continuation if the dynamic support holds.
💡 Fundamental Analysis
● The broader crypto market sentiment remains positive, with growing institutional adoption and decreasing selling pressure.
✨ Summary
● Watch for resistance around $3,500 and support at $3,000. A breakout above $3,500 could target $3,800.
-------------------
Share your opinion in the comments and support the idea with a like. Thanks for your support!


ETH/USDT — Golden Zone: Major Reversal or Deeper Correction!The 1W chart of Ethereum (ETH/USDT) displays a clear Elliott Wave impulsive structure, with the price currently moving within Wave (4) — a corrective phase that often determines whether the main trend will continue or reverse.
The 3,630–3,200 USDT yellow zone acts as a critical battleground where long-term buyers and short-term sellers collide. This zone will define whether Ethereum is preparing for its next major rally or entering a prolonged correction.
---
Structure and Key Pattern
Elliott Wave Count: Waves (1), (2), and (3) are complete; price is now in Wave (4), which typically precedes the final impulsive move (5) if the structure remains valid.
Golden Pocket Zone (0.5–0.618 Fib): The range between 3,630–3,200 is the golden retracement zone — a region where high-probability reversals often form.
Historical Flip Zone: This same area served as a major resistance during 2021–2022 and now acts as structural support, making it an extremely important pivot level.
Volume Profile: Historically, this zone attracts accumulation before a large breakout, indicating potential institutional interest.
---
Bullish Scenario — The Start of Wave (5)
If Ethereum holds above the yellow zone and prints a strong reaction, the structure supports a continuation rally toward new highs as Wave (5) develops.
Bullish Triggers
1. Strong rejection candles (e.g., long lower wick or bullish engulfing) from 3.2–3.6k zone.
2. Confirmation occurs once price reclaims 4.1k and breaks above 4.7k with weekly close.
3. First target: 4.95k (previous ATH resistance).
4. Extended targets: If momentum is strong, Fibonacci extensions point toward 6k–9k zones — marking the full completion of Wave (5).
5. Increasing weekly volume during breakout strengthens the bullish continuation signal.
> Bullish Summary:
As long as price stays above 3,200, the impulsive Elliott structure remains intact — making this zone a potential launchpad for the next major Ethereum rally.
---
Bearish Scenario — Breakdown and Deeper Correction
If price fails to hold the 3,200 support and breaks below, the impulsive structure will be invalidated, signaling a possible larger corrective phase (A–B–C).
Bearish Triggers
1. Weekly close below 3,200 confirms support breakdown.
2. Next target would be ~2,700 USDT — the next key support zone.
3. If bearish momentum continues, the price could extend lower toward 1,700–900 USDT (0.786–0.886 retracement).
4. The structure then transitions from an impulsive rally into a corrective macro phase, indicating that the larger bullish wave is temporarily over.
> Bearish Summary:
A weekly close below 3,200 signals structural failure and the start of a long-term distribution or deeper correction phase before forming a new accumulation base below 3k.
---
Visual Interpretation
5-Wave Impulsive Pattern: Indicates that the macro trend remains bullish until 3,200 breaks.
Yellow Zone = Decision Point: This “golden battlefield” determines whether Ethereum resumes its major uptrend or shifts into correction.
If strong bounce occurs, a parabolic Wave (5) could unfold — usually accompanied by extreme optimism and renewed market euphoria.
---
Trading Strategy & Risk Management
Use weekly timeframe for structural confirmation; use daily for precise entries.
Scaling strategy: Gradually build positions within 3.63–3.2k zone; add more upon bullish weekly close.
Stop-loss: Below 3.1k to protect structure integrity.
Conservative approach: Wait for breakout above 4.7k before confirming trend continuation.
Keep an eye on macro news and Ethereum ecosystem updates, which could add volatility beyond technical patterns.
---
Final Takeaway
> Ethereum stands at its Golden Crossroads — between renewal and decline.
If the 3.630–3.200 zone holds, ETH could ignite Wave (5) and push toward new all-time highs (6k–9k).
But if it breaks, the market might enter a deep corrective phase lasting months.
This zone will likely decide Ethereum’s direction for the next 6–12 months.
#Ethereum #ETHUSDT #CryptoTA #ElliottWave #CryptoAnalysis #TechnicalAnalysis #ETHPrice #Fibonacci #CryptoTrading #BullishScenario #BearishScenario #CryptoInvesting

“ETHEREUM Just Flipped Bullish — Strong Reversal Signal Ethereum just printed a strong bullish breakout from key structure on the 4-hour chart.
✅ Signal: Strong bullish engulfing candle closing above resistance
🎯 Long Entry: $3,550 zone
🛑 Stop Loss: $3,517
🎯 Target: $3,700+
This move shows clear momentum shift — bulls stepping back in with strength after multiple rejections.
I’ll be watching closely for a retest of the breakout zone before continuation.
What’s your take — do we break $3,700 next, or is this a bull trap? 👀
Drop your thoughts and analysis below!
#Ethereum #ETHUSDT #CryptoTrading #PriceAction #TradingView #CryptoAnalysis #ETH #BullishSetup #SmartMoney #CryptoCommunity #TradeWithMky

Ethereum analysisTo summarize briefly, Ethereum is now at one of its most important support levels, which might be one of the best times to enter a long position.
Looking at the chart’s history, the price has reached this area before and found excellent support.
Although I prefer the price to go lower so I can buy gradually along the way, the yellow lines indicate the prices I really like to buy at — though I don’t think Ethereum will reach those levels again.
Currently, there are two options:
* Short positions are forbidden.
* Long positions are risky but can be taken with proper risk management, hoping for a price increase.
Alternatively, we can wait for confirmation before entering a long.
In any case, the price is at a very sensitive level, and our view is fully focused on buying.
If for any reason, for example due to fundamentals, our analysis fails, it will be updated quickly and we will prepare for new triggers.

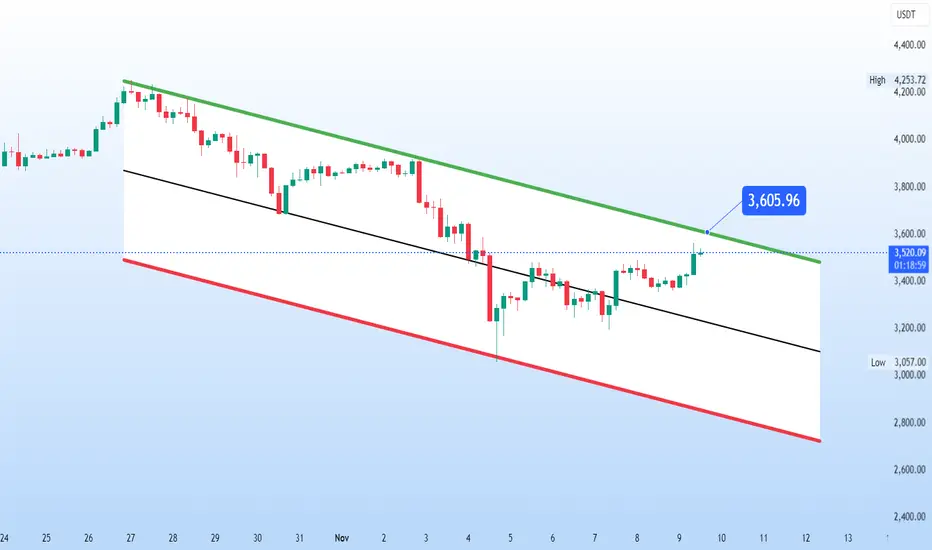
ETH is still moving inside a clean descending channel on the 4HCRYPTOCAP:ETH is still moving inside a clean descending channel on the 4H.
Price is now testing the mid-range and approaching the upper boundary near $𝟯,𝟲𝟬𝟬. Until this channel breaks to the upside, I can’t turn bullish.
For now, nothing to see here, just channel-bound movement waiting for confirmation of strength.
$ETH $3,800 is the Critical Catalyst for the Next Major Move!CRYPTOCAP:ETH $3,800 is the Critical Catalyst for the Next Major Move 🚨
The recent #Ethereum (#ETH) washout brings us to a massive decision point. The $3,800 level isn't just a number it's where the current relief rally meets the heavy overhead resistance (downtrend line + key volume zone).
Watch $3.8k Closely:
Rejection: If we get a clear rejection (a lower high), expect the bear trend to continue, targeting the recent lows.
Breakout: A sustained close above $3.8k and the downtrend line flips the script, igniting optimism and potentially giving us a free road back to the $4.4k - $5k highs. 🚀
What's your bet?
#CryptoMarket
