$ETH $3,800 is the Critical Catalyst for the Next Major Move!CRYPTOCAP:ETH $3,800 is the Critical Catalyst for the Next Major Move 🚨
The recent #Ethereum (#ETH) washout brings us to a massive decision point. The $3,800 level isn't just a number it's where the current relief rally meets the heavy overhead resistance (downtrend line + key volume zone).
Watch $3.8k Closely:
Rejection: If we get a clear rejection (a lower high), expect the bear trend to continue, targeting the recent lows.
Breakout: A sustained close above $3.8k and the downtrend line flips the script, igniting optimism and potentially giving us a free road back to the $4.4k - $5k highs. 🚀
What's your bet?
#CryptoMarket
Trade ideas

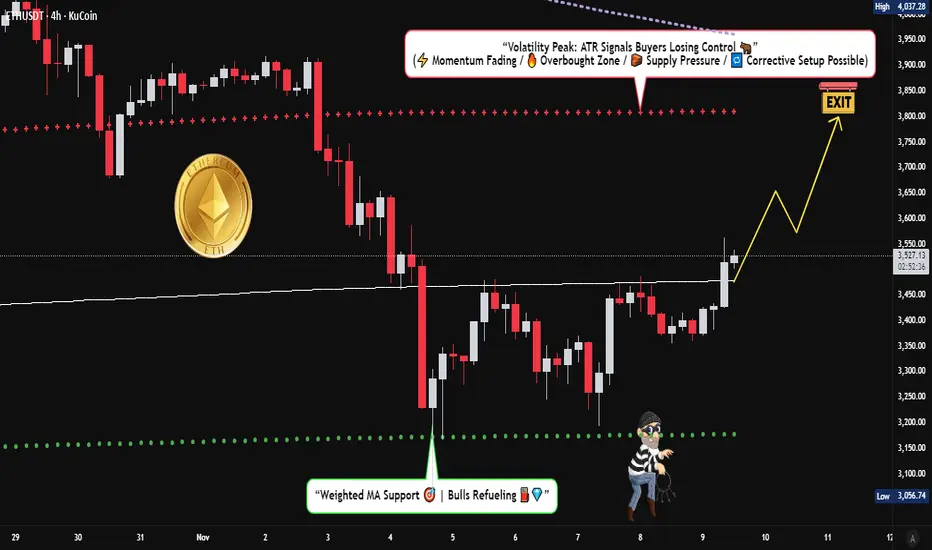
ETH/USDT Outlook – Bullish Bias Strengthens Above Key Support💎 ETHEREUM VS TETHER - Crypto Market Opportunity Blueprint (Swing Trade)
📊 CURRENT MARKET STATUS
Current Price: $3,380 - $3,427 USDT
Market Structure: Bullish consolidation at dynamic resistance
Setup Type: Weighted Moving Average Pullback + Breakout Confirmation
🎯 TRADE PLAN
📍 BIAS: BULLISH ✅
The bullish plan is CONFIRMED following:
✅ Weighted MA pullback completion
✅ Breakout at dynamic resistance line
✅ Price holding above key support zones
🔥 ENTRY STRATEGY - "THIEF LAYERING METHOD"
Entry Type: Multiple Limit Orders (Layer Strategy)
💰 THIEF ENTRY LAYERS:
Layer 1: $3,300 USDT
Layer 2: $3,400 USDT
Layer 3: $3,500 USDT
📌 Note: You can enter at ANY PRICE LEVEL or increase limit layers based on your own risk appetite and capital allocation. The layering strategy allows you to average your entry and reduce risk.
💡 Strategy Benefit: Multiple limit orders help capture price fluctuations and build position gradually instead of all-in at one price.
🛡️ STOP LOSS MANAGEMENT
Thief SL: $3,200 USDT
⚠️ IMPORTANT - Dear Ladies & Gentlemen (Thief OG's):
DO NOT blindly follow my SL level
PLACE YOUR SL AFTER BREAKOUT CONFIRMATION ONLY
Adjust your SL based on YOUR OWN strategy and risk tolerance
This is YOUR money, YOUR risk - trade responsibly
🎯 TAKE PROFIT TARGET
Target Zone: $3,800 USDT
⚠️ Exit Strategy Factors:
📉 Moving Average acting as strong resistance
⚠️ Overbought conditions expected
Potential bull trap zone
💰 Escape with profits at target levels
🔔 CRITICAL - Dear Ladies & Gentlemen (Thief OG's):
This is NOT financial advice
I'm NOT recommending you set ONLY my TP
Take profits at YOUR OWN price targets
Make money, THEN take money at your own risk level
No one knows your financial situation better than YOU
📊 CORRELATED PAIRS TO WATCH
Monitor these pairs for confirmation and correlation analysis:
Major Crypto Pairs 💹:
BINANCE:BTCUSDT - Bitcoin dominance and market leader direction
BINANCE:ETHBTC - Ethereum's strength vs Bitcoin (alt season indicator)
BINANCE:SOLUSDT - Layer-1 competitor correlation
BINANCE:BNBUSDT - Exchange token & ecosystem correlation
DeFi Ecosystem 🔗:
BINANCE:LINKUSDT - Oracle network (DeFi infrastructure)
BINANCE:UNIUSDT - DEX token (Ethereum ecosystem strength)
BINANCE:AAVEUSDT - Lending protocol (DeFi sentiment)
Layer-2s ⚡:
BITTREX:MATICUSDT (Polygon) - L2 scaling solution
BINANCE:ARBUSDT (Arbitrum) - L2 rollup correlation
BINANCE:OPUSDT (Optimism) - L2 ecosystem health
🔍 KEY CORRELATION POINTS
1️⃣ BTC Dominance: If BTC pumps independently, ETH might lag initially
2️⃣ ETH/BTC Ratio: Rising = Alt season favorable / Falling = BTC dominance
3️⃣ L2 Tokens: Strong performance = Ethereum ecosystem bullish
4️⃣ DeFi Tokens: Strength indicates institutional rotation into ETH ecosystem
5️⃣ Gas Prices: Rising on-chain activity supports bullish ETH narrative
⚡ TECHNICAL SETUP SUMMARY
✅ Weighted MA pullback completed
✅ Dynamic resistance breakout confirmed
✅ Support holding at lower levels
✅ Volume confirmation on breakout
⚠️ Watch for overbought RSI at target zone
⚠️ Be cautious of bull traps near MA resistance
🎓 RISK MANAGEMENT REMINDER
💼 Never risk more than 1-3% of portfolio per trade
📊 Position size according to YOUR stop loss distance
🎯 Have clear exit strategy BEFORE entering
💰 Take partial profits at psychological levels
🔄 Trail your stop loss as trade moves in profit
🔔 Like this idea? Drop a 👍 and follow for more setups!
💬 Comment your thoughts and TP levels below!
📊 Share with fellow traders who need to see this!
#ETHUSDT #Ethereum #CryptoTrading #SwingTrade #TechnicalAnalysis #TradingView #CryptoAnalysis #AltSeason #DeFi #Layer1

Ethereum Testing Major Resistance ZoneEthereum continues to respect the long-term ascending trendline, maintaining a healthy market structure.
However, the price has once again approached the critical resistance zone between $3,500–$3,800, where sellers historically dominated.
This area remains a key decision point for ETH:
🔹 A confirmed breakout above $3,800 could open the way to $4,500–$4,800, continuing the macro uptrend.
🔹 A rejection here, however, might trigger a deeper pullback toward $2,550–$1,950, aligning with the ascending trendline and liquidity zones below.
The weekly trend still favors buyers, but momentum shows signs of exhaustion.
In my view, ETH needs a period of consolidation before any sustainable breakout.
Long-term structure intact but short-term patience is key.

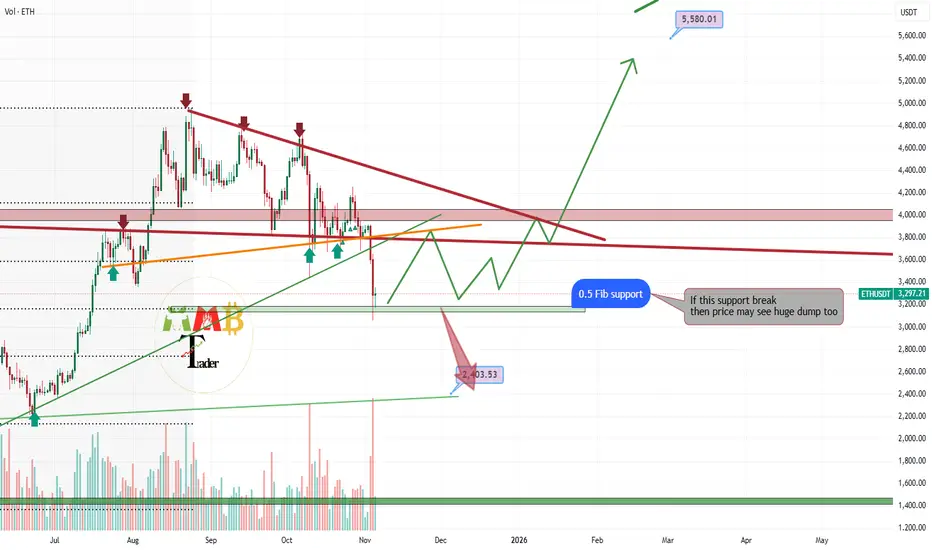
ETHUSDT is testing major Fibonacci support level now As the chart illustrates, ETHUSDT has completed a significant correction and is now testing a crucial technical level: the 50% retracement level of the Fibonacci sequence. This level often acts as a dynamic support zone in a strong trend.
A confirmed bullish rejection at this 0.5 Fibonacci support, evidenced by a strong reversal candlestick pattern, would signal that the correction may be complete. This would establish a high-probability setup for a resumption of the primary bullish trend.
In such a scenario, we would anticipate a strong bullish impulse, with an initial technical target projected toward the $5,500 level. This target is derived from the magnitude of the prior uptrend and represents a key resistance zone on the higher timeframes.
DISCLAIMER: ((trade based on your own decision))
<<press like👍 if you enjoy💚
Ether Breakout ImminentWith the Bitcoin testing the key trend, Trump's team start to talk about crypto, a lot. I think the ones who needed to buy the dip has finished their jobs. After that a sudden momentum to end shutdown begins but first attempts failed thus far. But the change of dynamics are clear and it could be positive for crypto and metals.
I will bet on upward breakout for Ether, and please check the BTC idea as well:

Simple short on EthMy thought process is quite basic, price broke through a support zone and i'm taking the sell from the closest resistance considering the bulls are not acting from a clear zone

ETHUSDT.P - November 9, 2025ETHUSDT.P is showing potential for a short-term bearish reversal after testing resistance near the $3,400 zone. A sell short limit is placed at $3,348, targeting a move down toward the $3,307 partial profit zone and the $3,214 profit level. A sustained move above the $3,416–$3,432 stop level would invalidate this short setup and signal renewed bullish momentum.
Risk Assessment: Moderate to High — Structure leans bearish, but confirmation requires a breakdown below $3,348 and continued weakness toward $3,300.
Note: Do not trade if the price touches the invalidation level first before the sell short limit order.

ETH Monthly Masterplan – From Frogs to the Moon 🐸 1. Miracle’s Take – The Legendary Leap Begins!
“Yo yo yo! Miracle here – and ETH just jumped outta the swamps straight into the order block jungle! 🐸💥”
We kissed the Order Block Buy zone like it’s the holy ground of memes 📿
3 Buy Levels hit – frogs were loading while normies were panicking 🤡
Price now chilling near the FOMO Zone – and trust me, most are buying now that it's too late
First target: 4,100 💸
Second target: 5,700+ – That’s where meme dreams start getting real!
Ultimate dream: 6,100+ – That’s a 250% leap... Frogs do fly 😤
💣 But yo, don’t ignore that massive Sell Order Block between 4.1K and 5K.
"Miracle Rule: You don't chase green candles – you trap 'em in green nets." 🎣
🟥 If we fall? Warning zone at 1.9K and hell no below 1.3K – STOP LOSS city 🚨
🐸 “ETH isn’t just a coin. It’s the ticket to meme kingdom.”
🔍 2. Clean Technical Breakdown – Analyst Mode
ETHUSD Monthly shows a textbook rebound from a long-term demand zone (“Order Block Buy”)
Three strong entry levels respected:
$2,142
$2,269
$2,394
Current price is retesting FOMO zone, last seen as local resistance
First Take Profit: $4,100
Second Take Profit: $5,718
Final fib extension target: $6,116 (254% from lows)
“Price must break and close above $2,750 with volume for confirmation.”
A monthly close below $1,942 is a strong warning
Final invalidation at $1,331, where structure is broken
“Respect the order blocks. Trade the levels.”
🎭 Which side are YOU on this time?
📈 Logical Analysis OR 🐸 Meme Mastery?
💬 Type #TeamMiracle or #TeamAnalyst and let the ETH prophecy unfold!
🎬 @TradeWithMky – where altcoins speak louder than Bitcoin!
#ETHtoMoon #EthereumMonthly #TradeWithMky #AltcoinSeason #MemeAnalysis

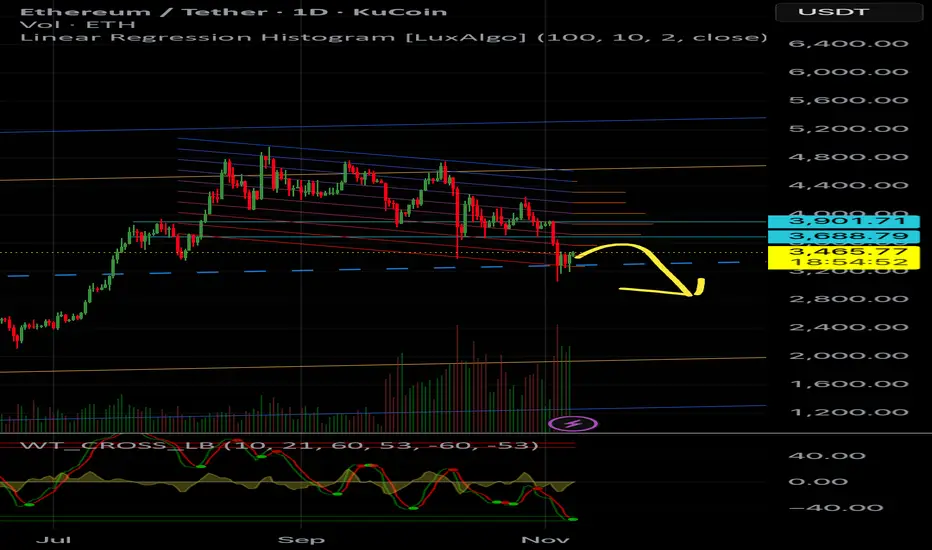
ETH/USDT 1D Chart📊 Current situation
• Price: approx. USDT 3,402
• Main trend: downwards - there is a clear downtrend line (black line) which acts as strong resistance.
• Key zones:
• Resistance: 3490-3990 USDT (green zones)
• Support: 3185 and 2700 USDT (red zones)
⸻
🧠 Market structure
• ETH moves below the trendline, confirming the dominance of sellers.
• After the recent decline, there was a rebound from the support at USDT 3185, but buyers' power is limited - daily candles have long upper wicks → supply pressure.
• If the price does not break through USDT 3,490–3,500, there is a risk of a retest of the USDT 3,185 support, and if it is broken, a possible decline to around USDT 2,700.
⸻
⚙️ Stochastic RSI (bottom of chart)
• Stochastic RSI is in the oversold zone (approx. 30), but the lines have not moved significantly upwards yet - i.e. there is no confirmed buy signal.
• If the indicator starts to curve upwards and crosses above 20, it could indicate a short-term rebound (upside potential to USDT 3,490).
⸻
🧭 Scenarios
🔺 Growth scenario (less likely)
• Breaking the trendline and staying above 3490 USDT will open the way to 3990 USDT.
• Requires increased buying volume (volume looks rather neutral for now).
🔻 Downside scenario (more likely)
• Rejection from 3490 USDT or from the trendline → drop to 3185 USDT.
• Breakout of 3185 = move to 2700 USDT (strong support from previous consolidations).
⸻
📈 Summary
• Trend: downward
• Short term: possible rebound to 3490, but the risk of further decline remains high.
• Key level to watch: 3,490 USDT (if it does not break, it is better to avoid longs).
• Potential long signal: only after breaking the trendline and retesting with confirmation of RSI > 50.

Ethereum | Long | 3 hrs | Target: 4220This technical analysis is for informational and educational purposes only. It does not constitute financial advice. Remember to always research and consult with a professional before making investment decisions. Good luck! 📈💼🚀

ETH .what we need and what we want) After October 11th dump, the marked zone acted as a strong support area, from which the market bounced several times.
Now this zone has turned into a resistance level.
For further growth, we need:
1) A breakout of this zone.
2)A confirmation and consolidation above it on higher timeframes.
It’s also important to keep an eye on Bitcoin dominance and the TOTAL2 chart, as they can provide additional signals about the possible direction of the altcoin market.

ETHEREUM Roadmap (3D)This is a broader outlook on Ethereum in the higher timeframe.
From the point marked as "Start" on the chart, it seems that Ethereum's correction has begun, forming an ABC pattern. Wave B appears to have completed as a symmetrical structure, and we are likely in wave X of B or wave C.
We expect a price rebound from the green zone.
So, keep a close eye on the chart and monitor it carefully.
For risk management, please don't forget stop loss and capital management
When we reach the first target, save some profit and then change the stop to entry
Comment if you have any questions
Thank You

ETH/USDT chart analiysis !!ETHUSDT Daily Chart.
Downtrend Channel and Key Breakout
ETH traded lower in a descending channel for several months between January and April, marked by parallel lines.
A breakout above this channel in late April signaled a trend reversal, leading to a sharp uptrend.
Following the breakout, ETH reached the gray supply/resistance zone ($3,800–$3,900), which has been acting as a support and pivot area ever since.
When the price recently fell below this zone, it immediately found buyers and is attempting to reclaim it.
ETH is now forming a small descending channel from its highs, with the price at support.
The chart projection indicates a bullish reversal as long as ETH remains above gray support and breaks above the channel resistance. If this reversal mirrors previous moves, the next major upside target is $4,830.
Following the previous breakout and trend reversal, ETH is consolidating near key support. Confirmation above resistance could trigger another strong rally, so keep an eye on key areas for signals.
DYOR | NFA

Ethereum Analysis It's Just a bullback to broken resistance line.
Don't rush for buying.
The crypto market has entered a correction phase for now.
It will probably move up to around 3700–3900 before dropping again.
Stay alert and look for selling opportunities.
See if it finds support near 3321.30 and can rise
Hello, fellow traders!
Follow us for quick updates.
Have a great day.
-------------------------------------
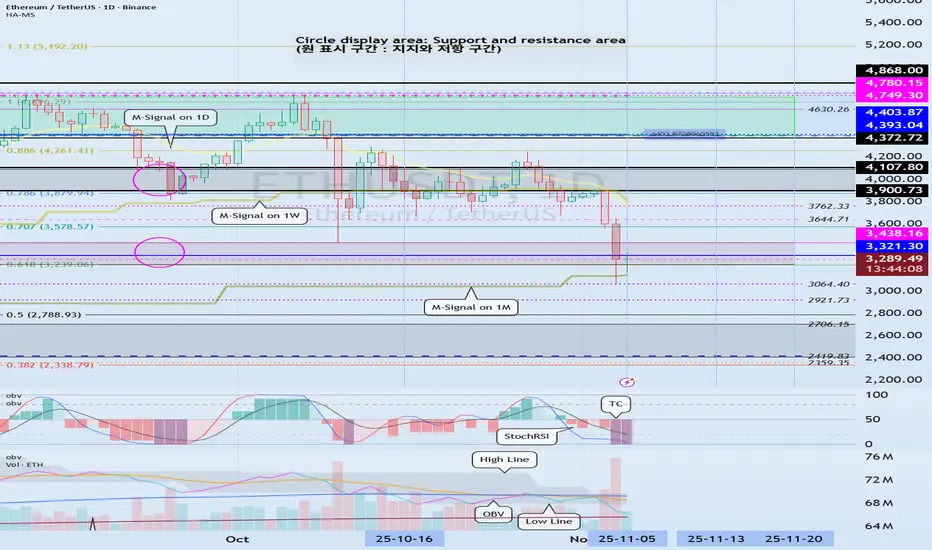
(ETHUSDT 1D chart)
There's no change from what I mentioned in my previous idea.
The M-Signal indicator on the 1M chart has been touched, so the trend will be re-determined.
At this point, it's crucial to check for support near the Fibonacci 0.618 (3239.06) - 3438.16 range.
If support fails and the price falls below the M-Signal indicator on the 1M chart, support should be checked around the 2419.83-2706.15 range.
-
Since the TC (Trend Check) indicator has touched its lowest point, a rebound is highly likely.
Therefore, determining support near the critical Fibonacci 0.618 (3239.06) - 3438.16 range is more important than ever.
Currently, ETH is in a period of volatility.
Therefore, we need to monitor the movement until November 6th.
The next period of volatility is around November 13th.
-
Thank you for reading.
We wish you successful trading.
--------------------------------------------------
Order Block 3Overall Market Context
The market appears to be in a downtrend or a significant correction within a larger range. This is evidenced by:
The current price ( ~3,456.77 ) is trading well below the listed resistance levels, which start at 3,650.00.
The short-term performance shows a decline of -10.48 (-0.30%).
1. Order Block (Powerful) Analysis
An Order Block is a key area on the chart where a significant amount of market orders was placed, causing a strong and decisive price move (a "power move"). This area often becomes a future support or resistance zone.
Interpretation:
The label "Order Block (powerful)" is present, but its exact price level is not specified in the text. However, we can infer its likely location based on the FTR (Fair Value Gap) and price levels.
Likely Location: The most probable location for this powerful order block is just above the current price, likely in the zone between ~3,475 and ~3,500. This area may have been the origin of a strong bearish move that drove the price down to its current level.
Role: Since the price is below it, this Order Block now acts as a strong resistance zone. For the bearish trend to continue, the price should react down from this zone. A break and close above it could signal a potential reversal or a deeper retracement upwards.
2. Hidden Base Analysis
A "Hidden Base" typically refers to a consolidation or accumulation zone that is not immediately obvious on lower timeframes. It's an area where institutional or large-volume traders are building positions without causing significant price waves, often before a strong continuation move.
Interpretation:
Again, the exact location is not specified, but we can deduce its purpose.
Likely Location & Scenario: Given the downtrend context, the Hidden Base is likely forming near the current price or slightly below it (e.g., between 3,450 and 3,400).
Purpose: In a downtrend, a Hidden Base near the lows suggests potential accumulation by sellers or a pause before the next leg down. It's a "reload" zone. The market is consolidating, building up energy (liquidity) to make its next significant move. A break below this Hidden Base would likely trigger the next wave of selling.
3. FTR (Fibonacci Trend Resonance) & Sup/Res/Div Analysis
FTR uses Fibonacci retracement and extension levels in conjunction with market structure to identify high-probability reversal zones. "Sup & Res & Div" refers to Support, Resistance, and Divergence.
Interpretation:
The text lists numerous price levels. We can group these into key Support and Resistance clusters for the FTR analysis.
Key Resistance Levels (FTR Sell Zones):
Primary Cluster: 3,650 - 3,600. This is the strongest resistance area.
Secondary Cluster: 3,550 - 3,525. This would be the first major test if the price were to bounce.
Immediate Resistance: The Order Block (~3,475-3,500) and the level at 3,456.77 (if the price retraces) are the nearest supply zones.
Key Support Levels (FTR Buy Zones):
Immediate Support: 3,456.77 (Current Price) and 3,450.00.
Major Support Cluster: 3,400 - 3,375. A break below this area would be very bearish.
Lower Supports: 3,300, 3,250, 3,200 are significant psychological and technical levels if the downtrend accelerates.

ETH/USD Technical OutlookETH/USD Technical Outlook: Price remains within a long-term ascending channel. Current correction could form an ABC pattern, with key Fibonacci retracement levels at $3,832 (38.2%) and $2,715 (61.8%). If bullish momentum resumes, extension targets point to $4,570 and $5,300

ETHUSDT.P - November 7, 2025ETHUSDT.P is showing continued signs of short-term bearish momentum after rejecting from the $3,370 resistance zone. A short position is positioned around $3,280, targeting a move toward the $3,179 profit level for a quick scalp.

ETHUSDTHi friends.
in eth charts, we can see the price succesfully fixed upside of 3900. when you check entire candles, you will see the price is in good situation for a good long position.
i think nowadays this is very low risk that we enter a long position from here.
good luck

ETHUSDTFollow the previous TA, i drawed order blocks in our way to reach the Final target...
please check both TAs

ETH-USDTEthereum is still stuck below the level that was previously support and has now turned into resistance.
So it can start rising towards the trend line 💎📊
only when it overcomes the resistance above it.
The short-term support for Ethereum is $3,200 and $3,000.

Bearish on ETHETH is likely to see a short-term rebound before declining below $3,000 to test the Monthly Demand zone.
I anticipate strong performance in January and February, with the potential for ETH to reach the $6,000 level.
We may have roughly one more month of bearish movement before the next upward phase begins.
