ETHUSDT.P - November 6, 2025ETHUSDT has broken below its ascending trendline, signaling potential bearish momentum. The setup suggests a short bias with a profit target near $3,275 and a stop level around $3,485, aligning with a risk-reward structure favoring downside continuation.
Trade ideas

ETH - Ranges overviewLet's have a look at ETH and its current trading range.
Similarly to BTC, ETH is currently trading towards its quarterly (3 months) sellside liquidity.
Pretty simple plan on ETH.
IF we fail to hold the current sellside liquidity expect us to trade lower towards the 2.8K-2.5K range.
IF we reclaim the current lows expect us to trade back towards 4K.
No need to frontrun the market. Let it come to you and trade with it.
Stay safe and never risk more than 1-5% of your capital per trade. The following analysis is merely a price action based analysis and does not constitute financial advice in any form.

Ethereum Technical Analysis – November 6, 2025Ethereum Technical Analysis – November 6, 2025
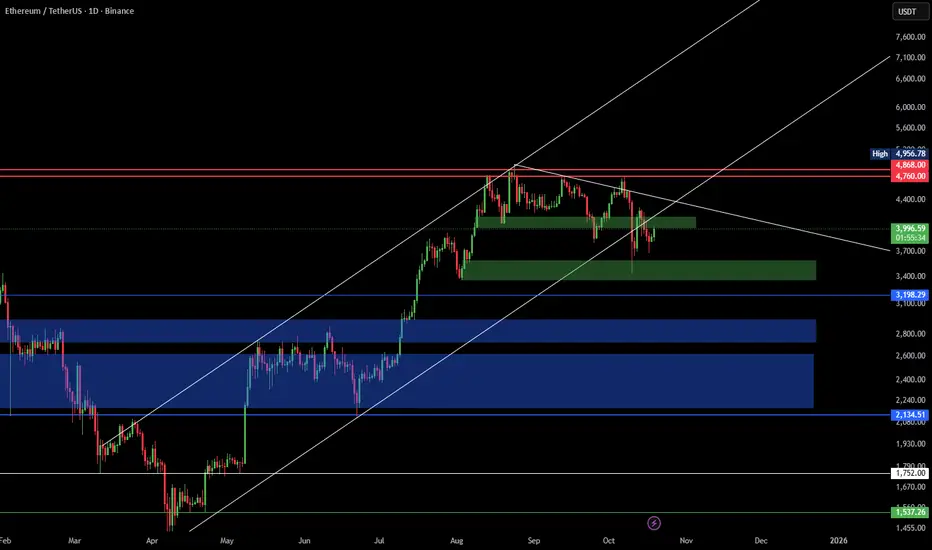
Ethereum (ETH) is currently trading below the descending trendline and sitting right on the key support zone at $3,340.
As long as this trendline remains intact, the bearish scenario is still in play.
The first resistance levels are found between $3,379 and $3,391.
If Ethereum fails to break above this zone and drops below $3,340, the next support targets are around $3,291 and $3,211.
However, if strong bullish candles appear above the trendline, we may see a short-term recovery move toward higher resistance zones.

ETH/USDT | ETH Under Pressure – Watching Major Demand at $2,500!By analyzing the Ethereum chart on the weekly timeframe, we can see that Ethereum, similar to Bitcoin, has started a correction — dropping as low as $3,050 earlier today and now trading around $3,300.
Key demand zones to watch are at $2,900, $2,700, and especially $2,500, which is a major support area. If price dips into this zone, I expect a strong bullish reaction from buyers. This analysis will be updated once confirmation appears on the chart.
Please support me with your likes and comments to motivate me to share more analysis with you and share your opinion about the possible trend of this chart with me !
Best Regards , Arman Shaban

ETH-USDTIt is still stuck at the same level as yesterday that I mentioned. If the resistance level at 3400 is broken, it could start its upward leg.

ETH-----Sell around 3475, target 3408 areaETH Contract Technical Analysis (November 6th):
On the daily chart, yesterday's close was a small positive candle, with a pattern of consecutive negative candles followed by a single positive candle. The price is below the moving average, and the accompanying indicators are in a death cross, indicating a clear downtrend. Yesterday's rebound was a correction after a significant drop, with the price correcting back to the moving average and facing secondary downward pressure – a common and predictable pattern. On the hourly chart, the rebound after the decline lacks strength and continuity, making it unlikely to establish a short-term trend. Therefore, intraday trading is expected to be range-bound, with the European session likely to see further downward pressure.
Today's ETH Short-Term Contract Trading Strategy:
Sell at 3475, stop-loss at 3510, target 3408.

ETHUSDT → Breakdown of the global trend. Distribution to 3360BINANCE:ETHUSDT is entering a distribution phase after breakdown of a consolidation formed against the backdrop of a bearish trend (correction). Sentiment, like the fundamental background, is changing...
Bitcoin is falling, which is putting pressure on the market. The reasons are weak fundamentals, index correction, and the rise of the dollar (outflow of funds from the market). On the daily ETH timeframe, we see a break in the uptrend. Monday's candle closed below the trend line, and since the opening of the session, the price has rallied (panic???)
Ethereum is coming out of consolidation (breakthrough of 3671). A distribution phase is forming, directed towards 3366 (liquidity pool). Technically, a false breakdown of support could trigger a pullback to 3600 (retest of the previously broken upward support line).
Support levels: 3366, 3150, 3000
Resistance levels: 3600, 3670, 3916
Despite the breakdown of the trend structure, we have strong support ahead. If the bulls hold 3366, the market may form a wider trading range. But if the overall background does not change, the decline may continue after the correction...
Best regards, R. Linda!

ETHUSDT – Short-Term Bounce Before Another DropEthereum is currently showing signs of a mild recovery after the sharp selloff seen earlier this week. Despite the ongoing bearish sentiment in the crypto market, a short-term rebound is forming as price finds support around the $3,300 zone.
Recent news highlights large outflows from Ethereum ETFs, signaling cautious investor sentiment. However, on-chain data also points to short-term accumulation, suggesting that some traders are taking advantage of lower prices to re-enter the market. This has helped ETH recover slightly toward the $3,700 region — a key resistance area aligned with the descending trendline and previous supply zone.
Still, the $3,700 area remains a potential turning point. If buyers fail to sustain momentum here, sellers may regain control, pushing ETH back down to $3,300 or lower in the next sessions.

ETHUSDT | Short Setup | VWAP Mean-Reversion | Nov 5, 2025ETHUSDT | Short Setup | Distribution → VWAP Mean-Reversion | Nov 5, 2025
🔹 Thesis Summary
ETH is bouncing inside a corrective leg after clear distribution. A retest of ~3,756 into prior value and VWAP resistance offers asymmetric short exposure toward 3.3k → 3.0k, with deeper paths to 2.5k–2.0k if risk-off accelerates.
🔹 Trade Setup
Bias: Short
Entry Zone: 3,720–3,780 (primary), optional add on overshoot into 3,860–3,900
Stop Loss (hard invalidation): 4,150 (daily close back above prior distribution high)
Take-Profits:
TP1: 3,300 (first VWAP/mid-range reaction)
TP2: 3,000 (range low / liquidity shelf)
TP3: 2,500 (capitulation pocket)
Max Target: 2,000 (cycle mean-reversion)
Indicative R:R (from 3,750 vs 4,150): TP1 ≈ 1.1R, TP2 ≈ 1.9R, TP3 ≈ 3.1R, Max ≈ 4.4R
🔹 Narrative & Context
Structure: Left-side distribution is clear; subsequent liquidation aligned with the classic cycle (distribution → correction → accumulation). Current rally is corrective into a prior value area/high-volume node around 3,750–3,900, where supply previously dominated.
VWAP & Means: Price is orbiting multi-week VWAP bands; first touch/retest of the upper band into that A-setup line near 3,765 is where sellers have edge with defined risk.
Sector & Rotations: SPX remains semiconductor-heavy; the Aug 25–Sep 20 window showed distribution/exit flows, consistent with a broad risk-off tone spilling into crypto. Alt breadth is weakening first (early panic tells).
Leverage & Flow (pro watch-items): Into the short zone, watch for positive perp funding + rising OI (late longs), ETH/BTC underperformance, and basis cooling—all consistent with a re-short after a squeeze.
🔹 Valuation & Context (Pro Metrics, Framed Simply)
Perp Funding Rate: Positive/expanding into resistance → indicates long-side crowding → increases squeeze-then-fade probability at 3.75–3.90k → supports short timing.
Open Interest vs. Price: OI rising on up-ticks → leverage adding into supply → raises liquidation risk on pullback → improves short R:R.
ETH/BTC Ratio: Weak/flat vs BTC → capital prefers base-layer beta over ETH beta → less support on bounces → aligns with lower targets on rejection.
🔹 Contrarian Angle (Your Edge)
Consensus is leaning toward “buy-the-dip into year-end flows.” Our read: acceptance back into prior value is failing, VWAP is capping, and leverage is rebuilding into supply. That combination often precedes a second-leg lower toward 3.0k with room to 2.5k if macro tightens.
🔹 Risks
Sudden risk-on impulse (index squeeze, dovish macro headline) pushing ETH through 4,150.
Catalyst risk (unexpected ETH-specific positive news/flows) that invalidates distribution.
Liquidity pockets: thin books amplify wicks; poor fills if size isn’t laddered.
🔹 Macro Considerations
DXY firming and VIX pressing higher favor risk-off follow-through; a DXY fade or vol crush would reduce downside velocity.
Gold stretched and due to cool → typically aligns with a broader cross-asset balance; a hard gold bid with rising VIX would strengthen risk-off.
Track NQ/semis: continued weakness supports the ETH short; a decisive semiconductor rebound would argue for patience or reduced size.
🔹 Bottom Line
Defined-risk short into 3,720–3,780 with invalidation 4,150. First objective 3,300, core target 3,000; extended bear paths 2,500–2,000 if macro stays risk-off. Trade the structure, hedge, and keep sizing disciplined.
🔹 Forward Path
If this post gains traction (10+ likes), I’ll publish:
A weekly-frame update on the distribution range and VWAP bands
Breakout/invalidations above 3.90k–4.15k and how that flips bias
Comments thread Q&A on execution (laddering, partials, hedge overlays)
Like & Follow for structured ideas, not signals. I post high-conviction setups here before broader narratives play out.
⚠️ Disclaimer: This is not financial advice. Do your own research. Charts may include AI-assisted enhancements.
🔹 Footnote
Forward P/E: Price divided by expected earnings over the next 12 months. Lower = cheaper relative to profits.
P/FCF (Price-to-Free-Cash-Flow): Price vs. the cash left after investments. A measure of efficiency.
FCF Yield: Free cash flow per share ÷ price per share. Higher = more cash returned for each dollar invested.
ROE (Return on Equity): Net income ÷ shareholder equity. Shows management efficiency with investor capital.
ROIC (Return on Invested Capital): Net income ÷ all invested capital (equity + debt). A purer profitability gauge.
Debt/Equity: Debt divided by equity. <1 usually means balance sheet is conservative.
R:R (Risk-to-Reward): Ratio of expected upside vs. downside. 3:1 = you risk $1 to make $3.

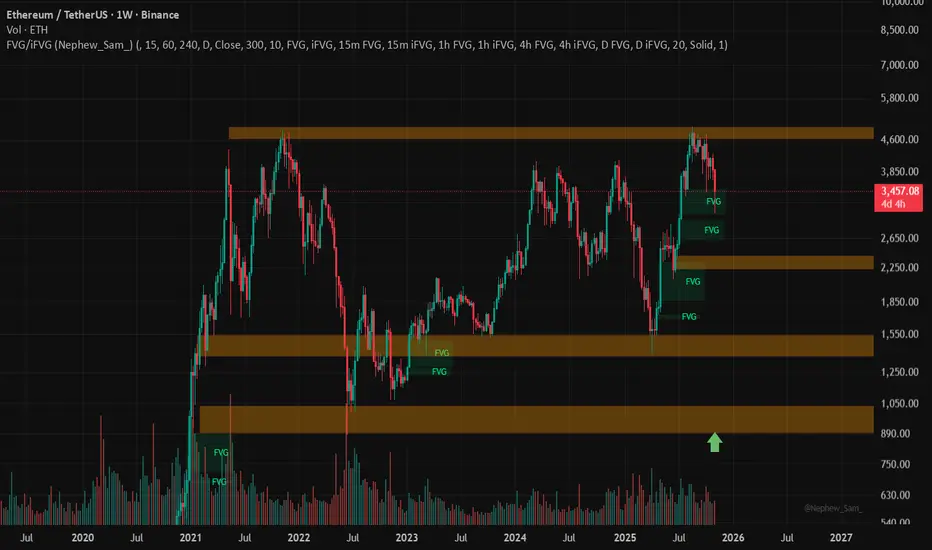
Ethereum Outlook (Weekly Analysis)Ethereum (ETH/USDT) is currently trading around $3,450 , facing a strong correction of nearly –11.5% after failing to hold above the $4,600 resistance zone. The weekly chart highlights several key Fair Value Gaps (FVGs) and major demand zones, which could play a crucial role in the coming months.
Key Observations:
Resistance Zone: The $4,500–$4,800 range remains a strong supply area, previously rejecting price twice (in 2021 and 2025).
Support Levels: Multiple FVGs are visible between $2,200 – $2,800, indicating potential short-term support.
Major Demand Zone: A significant long-term demand block lies around $1,300 – $1,500, which historically acted as a strong accumulation area.
Momentum: Weekly candles show declining volume during the recent rally, suggesting buyer exhaustion and possible retracement before continuation.
Outlook:
If Ethereum maintains support above $2,800, the broader bullish structure remains valid, potentially aiming again toward $4,600 in early 2026. However, a break below $2,500 could open the path toward deeper retracement near $1,500 — aligning with the lower FVGs and historical demand zone. 900$?
Ethereum (ETH/USDT) — Bears in Control | Next Target $3,200Ethereum remains under strong selling pressure.
After losing its ascending channel and failing to reclaim $4,000, momentum has clearly shifted in favor of the bears.
The market is now forming lower highs and showing no signs of strength recovery.
📉 Market Outlook
Price action remains heavy below $4,000–$4,200 resistance.
Current supports: $3,800, $3,400, and $3,200 — all potential short-term reaction zones, not reversal points.
Breaking below $3,800 would likely trigger continuation toward $3,200–$2,800.
Volume structure confirms distribution — no demand yet visible from buyers.
🚫 No Long Positions Recommended
The market is still in a corrective phase; long setups carry high risk.
Until ETH reclaims strong structure, short-term rallies are expected to be sold into.
⚖️ Summary
Bearish momentum dominates while below $4,000.
Patience and discipline are key — avoid counter-trend trades in this environment.
❗ Not financial advice — just my personal market view.
AB=CD (5 WAVES)Hello traders — hope you’re all gathering some pips!
Quick ETH update on the 1D chart: we’ve just completed a clean AB=CD (1:1) after a five-wave drop into the PCZ, and price rejected the zone with a bounce from D ≈ 3,057. Bias turns bullish while we hold above the PCZ.
Symbol: ETHUSDT (1D)
Key Levels
A–B–C–D: A ≈ 4,756 → B ≈ 3,392 → C ≈ 4,254 → D ≈ 3,057
PCZ: 3,182 – 2,889 (D printed inside, strong reaction)
TP1: 3,735 – 3,919
TP2: 4,154 – 4,452
TP3: 5,016 – 5,314
Invalidation: daily close < 2,889
Plan
Long on a retest/hold of 3,18x–3,05x or on continuation above last bounce high.
Scale out 30% / 40% / 30% at TP1/TP2/TP3; trail under rising swing lows.
Risk
Risk ≤1%. Initial SL just below 2,889 (beyond PCZ). Move to BE after ~1R.
Notes
Structure respects Equal Length (AB=CD) and fib confluence; staying above the PCZ keeps the path open toward TP1 → TP2 → TP3.

ETHUSDT.P - November 6, 2025ETHUSDT.P is attempting a short-term bullish reversal following a rebound from the $3,274.06–$3,244.47 support zone. A buy limit is positioned near $3,339.11, targeting a move toward the $3,493.78 partial profit zone and the $3,548.75 profit level.
A sustained break above $3,493.78 would confirm bullish continuation, while a drop below $3,274.06 invalidates the setup.
Risk Assessment: Moderate — price structure favors buyers, but confirmation above resistance is required before momentum can strengthen.

ETH....hanging by a threadIf ETH closes below the support box, we can expect to go down to the below rectangle.
It also has a tight (close) resistance above...

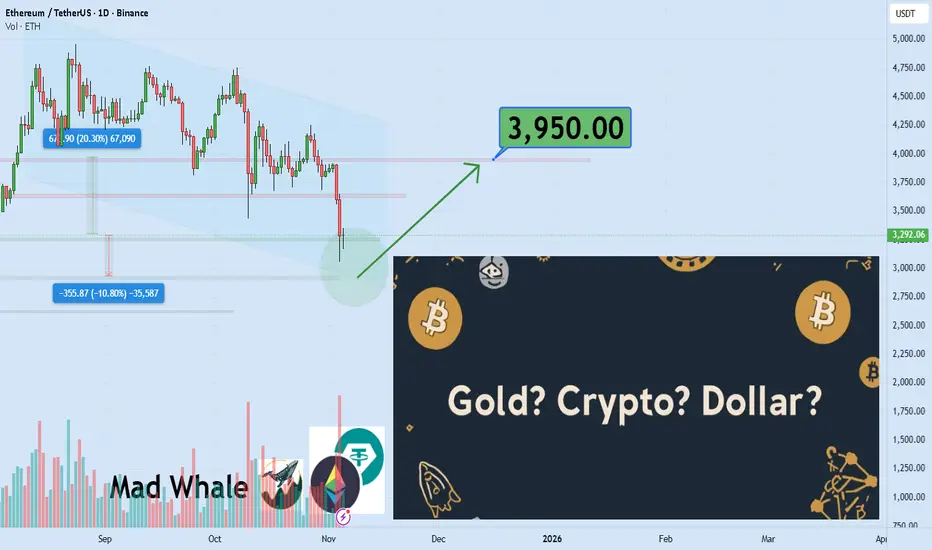
Gold, Dollar, or Bitcoin? The Great Wealth BattleWhen markets are turbulent, where does your capital stay? Do the old assets still shine, or is the new digital generation taking over? The answer lies not in prediction, but in intelligent asset management
Hello✌️
Spend 2 minutes ⏰ reading this educational material.
🎯 Analytical Insight on Ethereum:
Ethereum is testing the lower boundary of it descending channel and key daily support 📉.
If this level holds, a potential 20% upside could target $3950🚀.
Now , let's dive into the educational section,
🌍 Global Asset Map
Understanding the relationship between these three giants is the first step. Usually, a strong dollar puts pressure on the prices of gold and Bitcoin. But during periods of high inflation, all three can move in the same direction.
🧘 Track Market Psychology
Professional traders master their emotions. When greed becomes widespread, they intelligently exit the market, and when fear dominates, they gradually buy in.
⚖️ Capital Allocation Strategy
Never concentrate all your capital in one asset. A simple model suggests allocating part of your portfolio to gold as a safe haven, part to Bitcoin for growth, and part to cash for future opportunities.
🛡️ Smart Risk Management
Setting a stop loss for each asset is essential. This is like fastening your seatbelt while driving. Use the platform's tools to set automatic take-profit and stop-loss orders so emotions don't influence your decisions.
📊 Golden Tools on TradingView
Compare Feature
This feature allows you to bring different symbols onto one chart. You can view Bitcoin, gold, and the dollar index side by side and understand their correlation.
Power of Advanced Indicators
Indicators like Supertrend help you identify the trend direction. Additionally, using the ADX shows you the strength of the trend.
Identifying Divergence with RSI
When the price reaches a new high but the RSI forms a lower high, this is a serious warning. This signal can indicate a significant turning point.
💡Final Tips to Navigate the Chaos
First, focus on preserving your capital above chasing large profits. Second, always trust the data and charts, not rumors or emotional news. Third, never go against a strong trend use analytical tools to gauge the trend's strength.
💎 Final Word
Success in the market doesn't depend on choosing one champion, but on having a balanced strategy and managing your emotions. Use tools to make better decisions and stick to your trading plan.
✨ Need a little love!
We pour love into every post your support keeps us inspired! 💛 Don’t be shy, we’d love to hear from you on comments. Big thanks, Mad Whale 🐋
📜Please make sure to do your own research before investing, and review the disclaimer provided at the end of each post.
Eth bearish breakdownEthereum decisively broke through a major support line on high volume.
Unfortunately, it will be headed lower this year and next.
Target1: 2790 (highly likely)
Target2: 2160 (still possible)
Target3: 1430 (not likely)

ETHUSDT SPOT BUY CYCLE ETHUSDT
Spot
Buy cycle midterm
TP 4654
% bubble ratio
Currently in a negative bubble with fair value at 4654
Spot trading plan:
Entry from (-30% bubble ratio level) and below…
Exit at TP 4654…

4th time the charm ? After visiting the demand zone 4 times, ETH finally got some traction. I got in a long after the 4th time hitting the demand zone, now waiting for a break out confirmation to visit the next run up. Watch the 3 key levels in yellow for TP target / break out for continuations.
Happy Trading!
Don't over leverage and make sure you have stop loss to prevent down side risk from market spike.
Not financial advise, this is pure speculation.

Short trade
Day TF overview
📘 Trade Journal Entry
Pair: ETHUSDT.P
Direction: Sell-Side Trade
Date: Tue 4 Nov 25
Time: 12:40 pm
Session: NY Session PM
Timeframe: 1 Day
🔹 Trade Details
Metric Value
Entry 3,983.39
Profit Level (TP) 3,000.44 (+11.71 %)
Stop Level (SL) 4,141.42 (–4.7 %)
Risk–Reward (RR) 1:8.68
Projected Target
(Extended) 2,577.25 (–34.14 %)
🔸 Technical Context
Market Structure:
ETHUSDT has completed a Preliminary Supply → Buying Climax → UTAD sequence indicative of Wyckoff Distribution Phase C–D. Price has broken below the Change of Character (CHOCH) level at 3,900, confirming a bearish bias. The Breaker Block formed near 4,050 was retested and rejected — validating institutional sell-side control.
15min ~ TF overview
Fair Value Gaps (FVGs):
Multiple downside FVGs remain unmitigated between 3,800 → 3,000, offering magnet zones for draw-on-liquidity targets.
Daily inefficiencies suggest further markdown toward the 3,000 handle.
Confluence Factors:
Adaptive KAMA turning downward (bearish momentum confirmation).
High-volume rejection wicks at the 4,100–4,150 zone (supply confirmation).
A daily displacement candle formed after the retest (institutional order flow shift).
🔹 Narrative & Bias
ETH is transitioning into a markdown leg after completing a multi-month accumulation rally.
The rejection at 4,100 aligns with the broader crypto sector rotation into BTC dominance and short-term USD strength.
Phase Alignment:
Wyckoff Distribution → Phase D to Phase E progression.
Characterised by lower highs and successive liquidity sweeps.
Macro Sentiment:
BTC outperforming ETH across cross-pairs (ETHBTC ratio declining).
The market is reacting to tightening liquidity and lower risk appetite post-Fed communications.
Projection:
Primary target: 3,000 zone (daily FVG mitigation + PD array).
Extended target: 2,577 (institutional discount zone aligning with prior accumulation base).
Continuation bias is valid while below 4,050 resistance and until FVGs below 3,200 are filled.

DRAGONFLY DOJI - ETHA Dragonfly Doji is a candlestick pattern that looks like a “T”.
It means the price dropped during the candle but then came back up to close near the opening price.
This shows that buyers pushed the price back up, and it can be a bullish reversal signal, especially after a downtrend like we saw right now on ETH.
Fingers crossed, bulls!

ETH - LETS GOOOO BEARISH ..;;;... CRYPTOCAP:ETH - No Nudes, But This Chart’s Got Me Looking Twice 🍑
This is why you voted for me – now a winner of the #Binance #TheBlockchain100 event. 🔥
See you in Dubai this December! ✈️

ethusdtThe price is moving towards the opposite level of the daily trend after breaking the daily trend.

ETHA bad time to invest in Ethereum. The target at 2100 won’t be the final one. In the coming months, the only direction is down.
