ETHA bad time to invest in Ethereum. The target at 2100 won’t be the final one. In the coming months, the only direction is down.
Trade ideas

ethI have a strategy with 80% win rate.
The essence of it is that by the end of October, we will not see ETH above 4100.
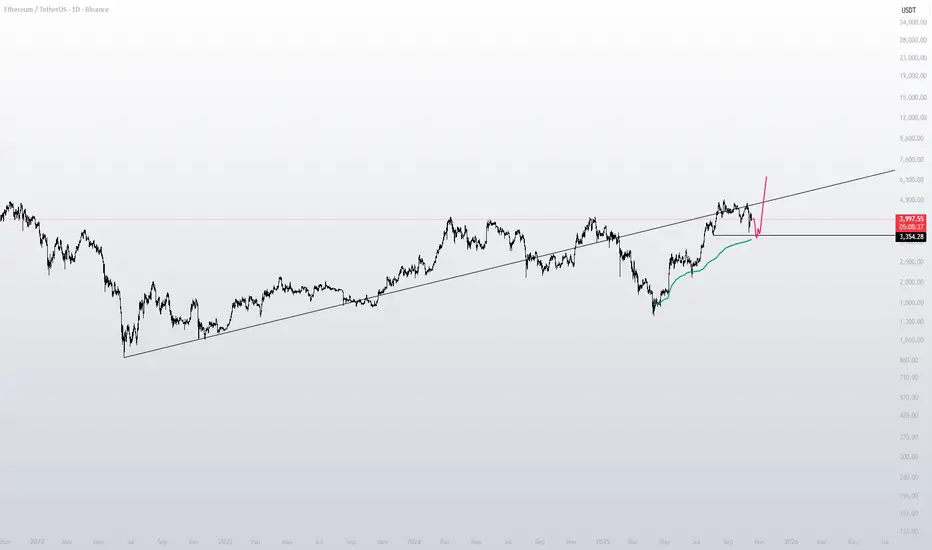
On the other hand, we are still within the body of the 12-month candle from 2021. In 2024, we failed to hold above 3700, which indicates weakness and increases the likelihood of a move toward the 2021 low, around 700.
Right now, this sounds pessimistic and I don't like this scenario, but that’s how I see the chart.

Hey Bulls, are you mentally ready for this if it happens?What if, in the coming days or weeks, the price slowly bleeds down, takes out the equal lows around 3350, and reaches our VERY, VERY IMPORTANT aVWAP anchored from the start of the major trend — while everyone’s busy talking about how the price has been reclaiming the weekly level around 3900 after the latest nuke? I honestly think you should keep this scenario in the back of your mind.
ETHUSDT.P - November 4, 2025ETHUSDT.P is maintaining a clear bearish structure, with price accelerating lower toward the $3,400.00–$3,381.34 zone. The setup indicates a potential continuation of the downtrend toward this target area, unless invalidated by a recovery above the $3,681.23 resistance level. A decisive breakdown below $3,381.34 would open further downside extension, while a rebound from this zone could signal short-term relief before further weakness.
Risk Assessment: Moderate risk — momentum remains bearish, but proximity to a key support zone may trigger temporary corrective bounces before continuation.

Eth breakout & retest in progress Htf eth has been bullish once the retest is done.
It will break $5K.
It's a matter of time 😁

ETHUSDT.P - November 4, 2025ETHUSDT.P is currently attempting a short-term bullish reversal within a broader corrective structure. After forming a local low near the $3,460.00–$3,446.72 support zone, price has rebounded and is now targeting a potential buy setup around the $3,538.13 level. This suggests buyers are seeking confirmation for continuation toward the $3,625.51 partial profit area and ultimately the $3,647.77 profit target.
A break and sustained move above $3,625.51 would reinforce the bullish momentum, while failure to hold above the $3,538.13 entry zone could expose ETH to renewed downside pressure, revisiting the stop level.
Risk Assessment: Moderate risk — price is showing early signs of recovery, but confirmation is needed above near-term resistance. The trade setup offers a favorable risk-to-reward ratio if the $3,460.00 support holds, though volatility may persist before directional clarity emerges.

ETH WEAKLY STRONGAs seen on the chart, there’s still nothing to worry about in the ETH/USDT pair on the weekly timeframe. The trend that started in 2022 continues to act like a magnet, keeping the price around it. I expect the support zone at 2990–2770 to hold strong. MACD is likely to break its downtrend resistance within this month, and RSI is slowly cooling off. Upcoming ETH staking news and other positive developments could trigger the next bullish trend.

ETH Extends Red Scenario — Key Support at 3,435Last week, Ethereum also followed our red scenario and is currently continuing its decline. The price is now very close to the previous low, and there’s a high chance of breaking it at 3,435 , which could lead to a further drop toward 3,128 .
A return of bullish sentiment is only possible above 3,945 — until then, we remain in a downtrend.

$ETH at Crucial SupportThe market took a hit - total cap fell from $4.28T to $3.5T, and CRYPTOCAP:BTC is testing support near $103,800. We’ve seen this setup before: panic, whales moving coins, fear everywhere. Yet November often flips sentiment fast - historically, Bitcoin averages +40% this month.
Ethereum is under heavier pressure, possibly heading toward $2,700-2,500 zone. $3,300 remains the key level to watch staying above it keeps the momentum alive, but a break below could open the door to downside pressure.
But these shakeouts often reset the market before the next trend begins - and when liquidity returns, Ethereum usually leads the rebound.
The crypto market is bleeding, major assets like CRYPTOCAP:BTC , CRYPTOCAP:ETH and others have been slipping while liquidity pulls back and sentiment cools.
The total market cap has dipped; multiple large‑cap coins are down over the last 24 hours. We’re possibly entering a phase where panic gives way to opportunity, but timing and tone matter. What’s your move: sit tight, buy the dip, or wait for a clearer signal?

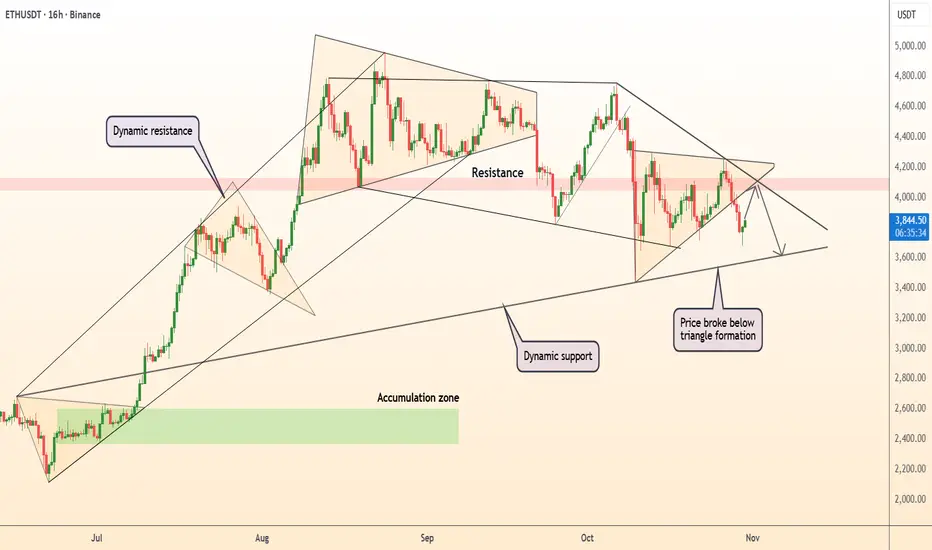
DeGRAM | ETHUSD formed a triangle📊 Technical Analysis
● ETH/USD broke below a triangle formation, confirming a bearish continuation from the dynamic resistance area near $4,200.
● Price action suggests a potential move toward the $3,600–$3,500 zone, aligning with the next dynamic support and continuation of the corrective structure from September highs.
💡 Fundamental Analysis
● Ethereum faces downside pressure as on-chain activity slows and ETF speculation cools amid risk-off sentiment in broader markets.
✨ Summary
● Short bias below $4,200; targets $3,600–$3,500. Breakout and weakening fundamentals support medium-term bearish momentum.
-------------------
Share your opinion in the comments and support the idea with a like. Thanks for your support!
ETH-USDTEthereum has created a positive divergence on the RSI✔️
It has made good returns whenever it reaches the 30-25 range on the RSI. 3300-3400 is an important range for Ethereum in the medium term that should not be broken.

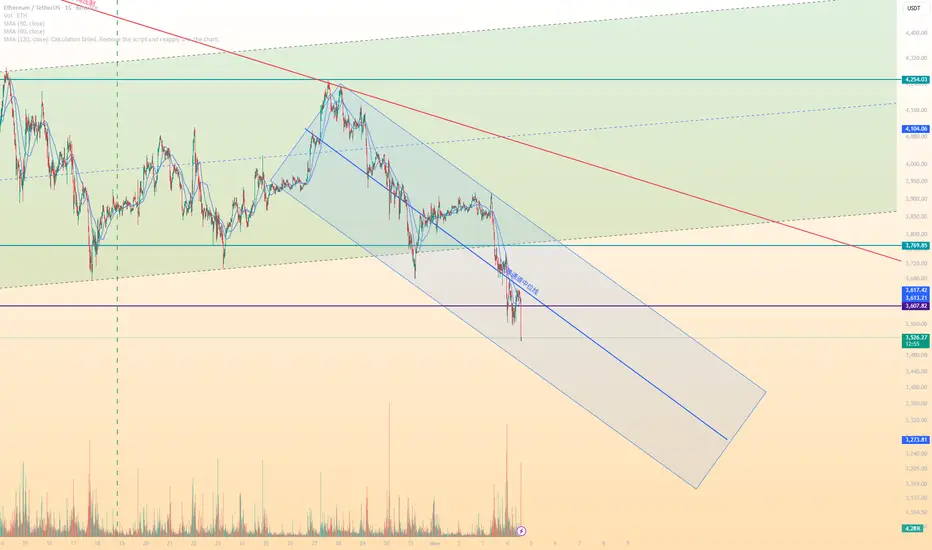
Short ETH in Miidle Line of TunnelETH Down, Short ETH in Miidle Line of Tunnel.
First price target: 3500
Second price target: 3000
Perhaps 3000 is the current bottom.
ETHUSDT 4-Hour Chart Analysis. ETHUSDT 4-Hour Chart Analysis.
ETH is forming a falling wedge, a typically bullish reversal pattern, with price just above strong support ($3,389, orange line).
RSI: The indicator is showing bullish divergence—price is making lower lows, but RSI lows are rising, hinting at possible reversal.
Expect further consolidation or small dips toward wedge support, followed by a breakout attempt.
On breakout, resistance is at $3,900–$4,100, then $4,830 as the next major target.
ETH is holding above support and showing bullish RSI divergence. Watch closely for wedge breakout—this could trigger a strong rally if confirmed.
DYOR | NFA

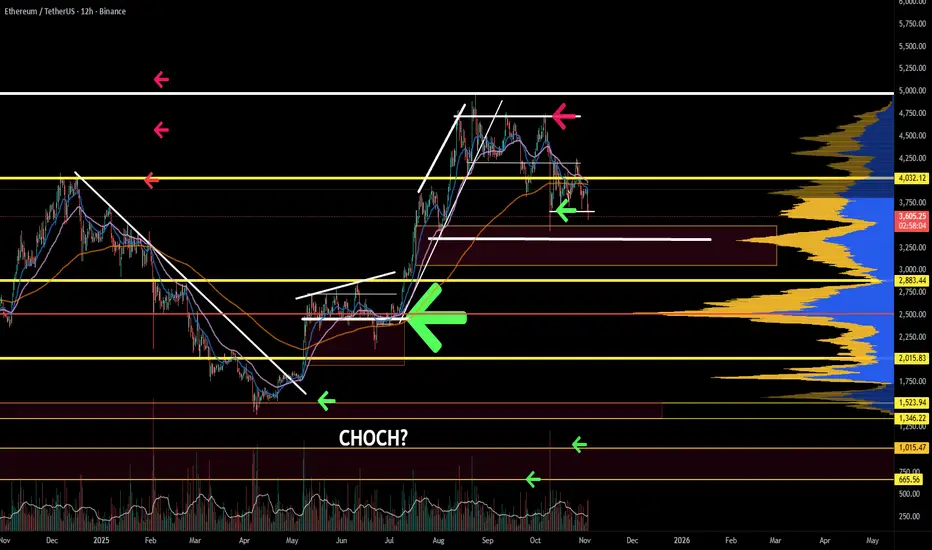
ETH/USDT 1W Chart📊 Market Structure:
Main Trend: Still up (higher lows and highs pattern persists).
Current Phase: Correction in an uptrend.
Local Trend: Down for several weeks (series of red weekly candles).
⚙️ Key Support and Resistance Levels:
Resistance (green lines):
4,753 USDT – recent local high, very strong resistance.
4,373 USDT – previous consolidation level, currently a supply zone.
3,979 USDT – current key local resistance, which previously served as support.
Support (red lines):
3,600 USDT – currently tested support level (coincides with the uptrend line).
3,165 USDT – next strong support level (previous local lows).
2,740 USDT – strong long-term support, potential target for further correction.
📈 Trendline:
The black uptrend line connects successive higher lows since April 2024.
The current weekly candlestick is testing this line (confluence with support at 3,600 USDT).
Maintaining this line = still a bullish medium-term scenario.
A breakout and weekly close below ~3,580–3,600 USDT → a signal of a possible trend reversal.
📉 Volume:
Downward volume is increasing, indicating supply pressure.
A lack of strong demand candlesticks = buyers are cautious in this zone.
🔄 Stoch RSI Oscillator (bottom of the chart):
Located in the oversold zone (below 20).
The %K (blue) and %D (orange) lines are starting to converge → a possible rebound signal in the coming weeks if a crossover occurs upwards.
🧭 Scenarios:
🟢 Bullish
Holding support at 3,600 USDT + trendline.
Confirmation with a bullish candle with higher volume.
Target: Return to 3,980 → 4,370 USDT.
🔴 Bearish:
Closing the week below 3,580 USDT (trendline + support).
Potential decline to 3,165 USDT, and even 2,740 USDT beyond.
RSI and volume suggest that downward pressure remains significant.
📌 Summary:
Key level: 3,600 USDT → decisive point for the market's further direction.
Short-term: Still downward pressure, but a technical rebound is possible (Stoch RSI).
Medium-term: The uptrend has not reversed until ETH closes below the trend line and 3,550 USDT.

ETHEREUM getting a spanking but its not over yetETH is in a downtrend; however, the structure looks retracive, which means that a corrective move would be almost over. If it is not, this means the price will break structure and fall further down. If the objective is to hunt liquidity, expect further downside.
Ethereum Analysis – November 03, 2025Welcome to DIBA PRISM Daily Analysis 💫
Ethereum is currently in a bullish phase 📈 — compared to its previous market cycles and Bitcoin’s recent performance, ETH still shows room for further upside 🚀
Right now, Ethereum is in a corrective phase, and if it forms a higher low relative to the previous one, we can start looking for potential entry points 🎯
At the moment, price has reached a key zone, so it’s best to wait and observe Ethereum’s reaction before making any move 👀
Patience and timing will be the keys to catching the next big move ⚡
Disclaimer:
This content is for informational purposes only and does not constitute financial or investment advice. © DIBAPRISM
Larry D.Kohn

[SeoVereign] ETHEREUM BEARISH Outlook – November 03, 2025I would like to share my Ethereum idea as of November 3.
This idea is an extension of the one from October 27. The short positions entered on the 27th will be closed in profit in connection with this idea, and I plan to add some additional positions at the same time.
Basis — Harmonic 1.414 Butterfly Pattern
Currently, Ethereum is approaching the completion zone of the 1.414 Harmonic Butterfly pattern that I personally designed.
This zone is structurally an overextension area,
where a strong technical reversal possibility exists.
Accordingly, I set the average target price around 3,400 USDT.
Further position management and updates will be provided depending on market conditions.
Thank you for reading.

Ethereum Fails to Reclaim $3,900 — Bearish Target $3,300Ethereum continues to exhibit persistent weakness, with price failing to close convincingly above the $3,900 level. This rejection has reinforced the existing bearish market structure, leading to the establishment of yet another lower low, confirming the continuation of the corrective trend.
As long as price action remains suppressed beneath $3,900, the bearish bias stays intact. This sustained weakness opens the probability of a deeper corrective move toward the $3,300 region, which aligns with a key high-time-frame support zone and potential liquidity pocket.
Key Points:
Failed Reclaim: Inability to close above $3,900 confirms ongoing weakness.
Bearish Structure: Another lower low has formed, extending the downtrend.
Downside Target: Price likely to rotate toward $3,300 support.
From a technical standpoint, Ethereum remains under pressure with sellers maintaining control until a clear reclaim of resistance occurs.
What to Expect:
If $3,900 continues to hold as resistance, expect further downside toward $3,300. A strong daily close above $3,900, however, would invalidate the bearish scenario and hint at a short-term structural recovery.

ETH analysis
Ethereum has begun a new downtrend within a channel, targeting the $2,900 level, where a bullish reversal is expected.

eTH-USDTIt has reached the support I mentioned again at $3700 📉📉
If this support holds, the price could return to the two targets I set for you
Keep an eye on it

ETH-----Sell around 3890, target 3830 areaETH Contract Technical Analysis (November 3rd):
On the daily chart, yesterday's close was a small positive candle. While the candlestick pattern shows consecutive positive days, the momentum and continuation are weak, and the price is below the moving averages. The accompanying indicators are showing a death cross, indicating a clear downward trend. Therefore, the trading strategy remains sell. On the hourly chart, the resistance level is around 3920. The current price has rebounded to near the 4-hour moving average resistance level. Given the clear downward trend, further upward movement is unlikely. Therefore, the focus for today and the European session should be on a break below support levels.
Today's ETH Short-Term Contract Trading Strategy:
Sell at 3890, stop loss at 3930, target 3830.

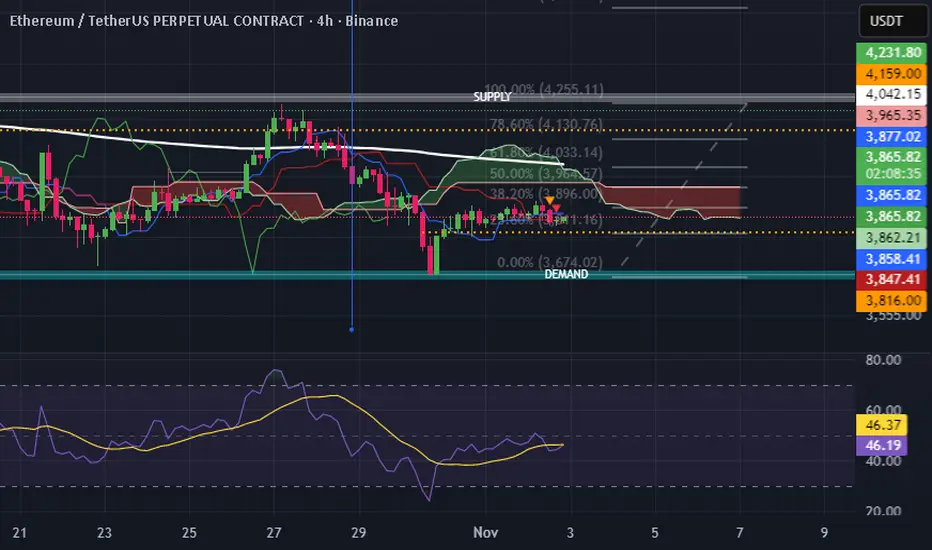
ETHUSD — Ichimoku & Fibonacci Time Analysis (4H)Ichimoku + RSI + Fibonacci used to identify key confluence.
Support zone: 3965–3896 (50–61.8% fib).
Bull confirmation above 4253. Next targets: 4409, 4491.
Strategy focus: time/price balance (Ichimoku-based).
ETH Weakening Near Support, Big Move Loading?CRYPTOCAP:ETH is currently trading near a key support zone, which has held strong multiple times in the past. The price has been consolidating between this support and the mid S/R zone, showing that both bulls and bears are battling for control.
If ETH manages to break and sustain above the mid S/R zone, we could see a potential upside continuation toward higher levels. However, if the price fails to hold this key support and closes below it, a deeper correction toward the lower support zone could be on the table.
For now, ETH looks weaker day by day, so it’s important to keep a close eye on how the price reacts around this zone, a decisive move could set the tone for the next big trend.
DYOR, NFA
