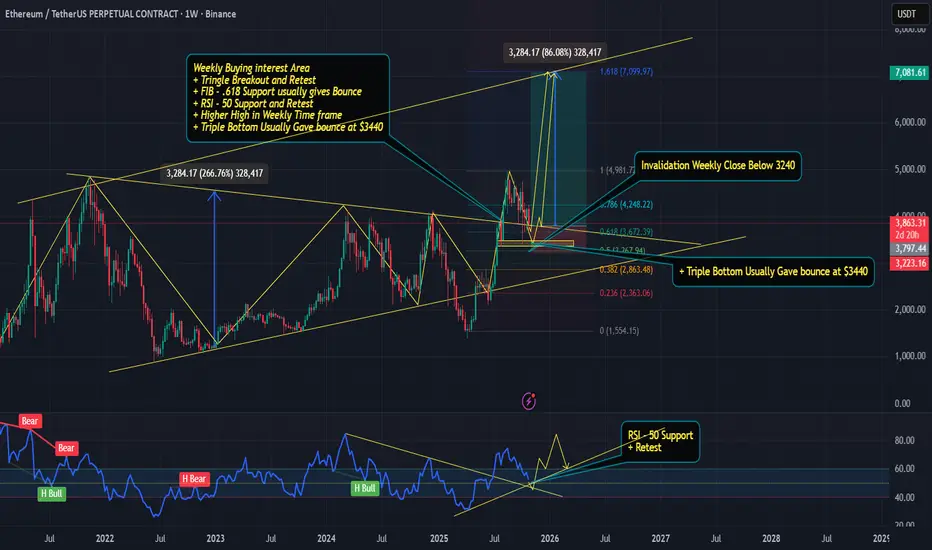
ETH Weekly Setup: Confluent Support Zone - $3440–Bounce Incoming📈 ETH/USDT – Weekly Timeframe Bullish Confluence
Multiple technical factors aligning for a potential bounce in Ethereum:
✅ Triangle Breakout + Retest – Price retesting the upper trendline of a multi-month
symmetrical triangle after a clean breakout. Classic continuation setup.
✅ Fibonacci .618 Support – The golden ratio level (~$3400–$3500 zone) has historically acted as strong dynamic support. Bounces from .618 are high-probability in trending markets.
✅ RSI at 50 Support & Retest – Weekly RSI holding the midline (50) as support. This level often marks the transition from correction to resumption of uptrend.
✅ Higher High Structure Intact – Weekly timeframe still printing higher highs. As long as $3240 holds on close, macro uptrend remains valid.
✅ Triple Bottom Formation – Price has tested ~$3440 three times in recent weeks. Triple bottoms at key levels often precede strong reversals.
🎯 Expected Move: Bounce toward prior swing high (~$4000–$4200) if support holds.
⚠️ Invalidation: Weekly close below $3240 – would break triple bottom neckline and shift bias to bearish.
Not financial advice. Trade at your own risk.
#ETH #Ethereum #Crypto #TechnicalAnalysis #TradingView
Trade ideas
ETHUSDT incoming BULLSThe market has maintained a strong sideways trend after a crash crisis and now has the potential for bulls after the SELLE'S exit.
1.Maintained support while the resistance marked had been crossed 2 times
2.Buying pressure is greater expressing strong bulls.
3.Exit is required to go for a bullish trend.

ETH/USDT: Price Decline Warning, Caution for Buy Opportunities!The ETH/USDT pair is currently facing clear downward pressure after failing to break through the strong resistance at 4,150.00. The 4-hour chart shows that Ethereum is moving in a short-term downtrend, with prices heading towards the important support level of 3,780.00. The strong rejection from this area indicates that the current market sentiment is leaning towards selling.
The market's cash flow also reflects short-term distribution, and the RSI indicator shows that ETH has previously entered overbought territory, and may continue to correct downward. These factors suggest that Ethereum could continue to face selling pressure, especially if the support levels are not strong enough to hold the price.
Impact of Recent News:
1. Australia's Core Inflation Data Rises Sharply: Australia's core inflation index increased by 1.0% in Q3, exceeding the forecast of 0.8%. This reduces expectations of a near-term rate cut and could affect ETH/USDT if the USD strengthens.
2. Expectations on U.S. Federal Reserve's Monetary Policy: The market expects the Fed to maintain high interest rates, which could strengthen the USD and put downward pressure on ETH/USDT.
Conclusion: Given the current downtrend and pressure from technical indicators, ETH/USDT is likely to continue decreasing over the next 48 hours. However, traders need to be cautious and closely monitor the support level at 3,780.00. If the price shows strong signs of recovery from here, it could present a good opportunity to enter the market.

ETHUSDT: Price Aims For $4,200 ?- Here Is Why...Hi Teams,
Lets take a view on ETHUSDT. it have been scaling on a momentum range of support and resistance for this couple of days. presently the price is at the support zone, retracing slowly as seen in the chart formation.
Key points;
More clear confirmation above the support level would set off a bullish rise toward $4,200 as next partial target.
However a breakout below the support level would be triggering the price to downward movement.
Thanks for reading.

ETH/USDTETH bounced from monthly value area low so it has potentially go upwards to 4000$ mark. Once we reach there then next line of action will be evaluated.
I am bullish on ETH

Ethereum (ETHUSDT) – Elliott Wave & Fibonacci Technical OutlookETH has completed a clear 5-wave impulsive structure followed by an ongoing ABC corrective pattern on the daily timeframe.
Currently, price is testing the 78.6–100% Fibonacci retracement zone ($3,400–$3,700) — a key area that often marks the end of wave C and the start of a potential new impulsive wave.
Bullish Scenario:
If ETH confirms support above $3,400 with a strong bullish reversal candle and increasing volume, it may trigger a recovery toward $3,800 → $4,200 → $4,700.
Breaking above $4,200 would further validate the bullish continuation setup.
Bearish Scenario:
A daily close below $3,400 would invalidate the bullish wave count and could extend the correction toward lower structural supports.
Key Levels
Support: $3,400 – $3,700
Resistance: $3,800 / $4,200 / $4,700
Stop-loss (for long setups): Below $3,350
Overall, ETH is approaching a critical decision zone — watch for confirmation signals before positioning for the next leg.
#ETH #Ethereum #Crypto #TechnicalAnalysis #ElliottWave #Fibonacci #TradingView #CryptoTrading #BTC #ETHUSDT

Ethereum Game Plan - TDLRKZ MODELEthereum Game Plan - TDLRKZ MODEL
📊 Market Sentiment
On 29/10, the FED lowered rates by 25BPS, as expected. However, Powell’s comments introduced uncertainty regarding another cut in December, stating that further policy moves depend on incoming data.
Interestingly, one FED member dissented, preferring no cut this cycle — a shift from September when all members supported easing.
Following the statement, rate-cut expectations dropped from 95% to 68%, prompting traders to take profits and hedge, creating a short-term bearish sentiment across markets.
Despite this, the mid-to-long term outlook remains bullish, given the broader liquidity cycle and easing policy bias.
📈 Technical Analysis
Ethereum is currently accumulating inside a well-defined range.
Price failed to sustain above the $4950 range high and has started retracing toward the HTF bullish trendline, a potential reaction zone aligning with prior liquidity pools and confluences.
If price holds around this zone, ETH could seek the range high again once momentum returns.
📘 Model in Use – Trendline Deviation with HTF LR into Key Zone (TDLRKZ Model)
This model identifies setups where price deviates from HTF trendlines while interacting with liquidity zones and key structural levels.
The goal is to align HTF context with LTF confirmation for high-probability trend continuation setups.
Model Steps:
1️⃣ Identify the HTF trend direction and only trade in that direction.
2️⃣ Mark the HTF bullish trendline supporting price.
3️⃣ Spot HTF Key Zones likely to act as reaction areas.
4️⃣ Locate nearby liquidity pools or order concentrations.
5️⃣ Wait for confluence: when all align, confirm with a 4H market structure break for entry.
📌 Game Plan
Looking for ETH to retrace into $3350 and reject from that level.
If a 4H break of structure occurs and daily candle closes above $3350, this will trigger a long-biased setup.
🎯 Setup Trigger
→ 4H structure break after tagging $3350
→ Daily close above $3350
📋 Trade Management
→ Entry: After confirmation above $3350
→ Stop Loss: Below swing low that caused 4H break of structure
→ Targets:
TP1: $4150 (EQ)
TP2: $4550
TP3: $4950 (Range high)
→ Move SL to breakeven after TP1 is reached.
💬 Check my Substack for deeper macro and sentimental breakdowns — free subscriptions are open.
⚠️ Disclaimer: This content is for educational purposes only and does not constitute financial advice. Always DYOR before trading.

eTH-USDTAdades is set to start its ascent by breaking the trend line. Crypto channel users, watch out for it.

ETH-----Sell around 3930, target 3850 areaOctober 30th Ethereum (ETH) Contract Technical Analysis:
On the daily chart, yesterday's close was a small bearish candle, indicating a continuous decline. The price is below the moving average, and the accompanying indicators show a golden cross with decreasing volume. While the overall trend is clearly downward, attention should be paid to the possibility of a breakout and continuation of the downward movement. In the short term, focus on range-bound trading, with resistance around the 3950 area. The hourly chart shows a generally downward trend with some volatility. Although the decline hasn't been particularly strong, experience suggests a high probability of a sharp drop, so this opportunity should be seized.
Today's ETH Short-Term Contract Trading Strategy:
Sell at the 3930 area, stop loss at the 3960 area, target 3850 area;

ETHUSDT 4-Hour Chart Analysis !!ETHUSDT 4-Hour Chart Analysis
Trend: ETH has found support at the intersection of a long-term downtrend line and a horizontal demand zone ($3,850–$3,900 area). This area has held steady several times and is acting as a base for the price.
Structure: The price has recently pulled back after rallying to $4,220, but continues to make higher lows on this timeframe, indicating that the bullish structure remains intact as long as $3,900 remains stable.
Key Levels:
Support: $3,850–$3,900 (trend line and horizontal zone)
Resistance: $4,220 (recent swing high), $4,830 (key target—see green arrow projection)
Perspective: If ETH remains stable above $3,900 and bounces back from this support, the next targets will be $4,220 and then $4,830. A breakdown below $3,850 would weaken this bullish outlook.
ETH remains bullish above support, and an upward move towards $3,900 is highly likely. Watch for a break above and sustain above the $4,220 level for further momentum.
DYOR | NFA

ETH/USDT 1W🔹 Overall Trend
We are still in an uptrend (trend line maintained from the March low).
However, momentum is weakening—a series of lower highs is forming, suggesting a local correction within the main trend.
🔹 Key Technical Levels
🟢 Resistance:
4,179 USDT – the current level that the price is testing as resistance.
4,407 USDT – the next strong resistance, where previous rejections occurred.
4,877 USDT – the main resistance resulting from the August highs.
🔴 Support:
3,916 USDT – almost identical to the above (demand zone).
3,561 USDT – key structural support; loss of this level = possible trend change.
🔹 Formation and Structure
The current pattern could form a potential ascending triangle, with the trendline (black) connecting the lows and the horizontal resistance lines marking the upper boundary of the consolidation.
If a breakout occurs above 4,180–4,400, a move to 4,800+ is possible.
However, if we break the trendline and 3,900, a move to 3,560–3,400 could occur, or even a test of 3,000 with significant selling pressure.
🔹 Volume
Volume is decreasing during consolidation → typical of an accumulation or distribution phase.
No clear breakout signal – the market is waiting for a trigger (e.g., macroeconomic data, ETFs, news about ETH 2.0).
🔹 Stochastic RSI (Bottom of the chart)
Located in the oversold zone (<20).
The %K line (blue) is attempting to cross the %D line (orange) from below – a signal of an early rebound.
If confirmed next week, a local rebound from the 3,900–4,000 zone could occur.
🔹 Scenarios:
✅ Bullish:
Breakout from the trendline + breakout above 4,180 → target 4,400, then 4,880.
Confirmation by increasing volume and the Stoch RSI emerging from oversold territory.
❌ Bearish:
Breakout of the trendline and 3,900 → target 3,560, then 3,200.
Increasing downward volume + no bullish reaction at the support levels.

ETH: Range-Bound, But Breakdown Could Get UglyOn the CRYPTOCAP:ETH daily chart, the mid-zone is acting as a clear barrier. The price is currently consolidating within a range, caught between the key support zone and this mid S/R zone.
A breakout above could trigger a strong move higher, while a breakdown here would be a scary scenario for the overall market.
DYOR, NFA
Thanks for reading! Appreciate your support and engagement 🙏

Growth ahead of the Trump-Xi Jinping meeting in South Korea.CRYPTOCAP:ETH / #Ethereum 🔹 Donald Trump and Xi Jinping (October 19, 2025)
A positive outlook is shaping up for Ethereum, and it sure looks like a classic W reversal is in the works.
There's a ton of negativity swirling right now, with a lot of folks expecting prices to dip even lower (I was bracing for that final flush-out myself, but it looks like they scooped up the dip and are busy forming this reversal setup).
During that Ethereum drop on October 10-11, BitMine Immersion Technologies beefed up its reserves with 104,336 ETH worth $417 million.
As of this writing, the company's sitting on 3.03 million ETH valued at $12.18 billion, making it the biggest corporate whale holding Ethereum.
Whales and public companies are aggressively snapping up Ethereum and stacking their bags.
All that's left is to speculate where Ethereum's gonna top out and where they'll start dumping all this volume 8k? 10k?
I've pulled together some screenshots that back up the bullish signal:
1️⃣ Liquidations on the Hyperliquid exchange: As you can see on the chart above, once we break $5,000, a massive wave of short traders are gonna get wrecked that could spark another leg up in price momentum.
2️⃣ Coinbase order book: Check it out—above $5,000, there are limit orders lined up for profit-taking, so Ethereum might follow a similar path straight up to $8,000.
3️⃣ Current big orders on Binance and Coinbase exchanges.
4️⃣ OKX ETH/USDC liquidation heatmap.
Wrapping it up: On the daily chart, we're seeing a reversal pattern forming as a W (I call it the "pirate reversal" myself), and keep in mind that after the chaos on October 10-11, more than 1.6 million traders got absolutely rekt.
I doubt everyone's gonna pile back in buying or flipping to long positions anytime soon that plays right into the hands of the big market puppeteers and market makers.
They'll pump the price higher, whip up the hype, and offload their Ethereum stacks at the top.
Snapshot:

Ethereum Faces Bearish Pressure After 0.618 Fibonacci RejectionEthereum price action is displaying clear local weakness, with signs pointing toward a potential rotation back to high-timeframe support at $3,385. The recent rally failed to break above the prior swing high, instead forming a lower high — a signal of fading bullish momentum.
The rejection at the 0.618 Fibonacci retracement was accompanied by increased bearish volume, confirming that sellers have regained control in the short term. Price is now testing local support around $3,900, a crucial level that must hold to avoid triggering a deeper corrective phase.
Key Points:
- Rejection Zone: Ethereum was rejected at the 0.618 Fibonacci, confirming local weakness.
- Lower High Formation: Indicates loss of bullish structure and potential trend reversal.
- Critical Supports: $3,900 (local) and $3,385 (high timeframe) are the key downside levels to
watch.
From a structural perspective, Ethereum’s inability to sustain momentum signals growing bearish pressure across lower timeframes.
What to Expect:
If $3,900 fails to hold, expect ETH to rotate toward $3,385 support. However, reclaiming and closing above the 0.618 Fibonacci could invalidate the short-term bearish setup and reintroduce upside potential.

ETH Short Setup🚨 ETH Short Setup
Ethereum just confirmed a Break of Structure (BOS) after failing to hold above both EMAs. This rejection — together with a liquidity sweep near 4230 — signals potential continuation to the downside.
🎯 Trade Plan Overview:
Entry: 4020–4050
Stop: 4100–4120
Targets: 3960 → 3840
Risk/Reward: 1:3
📊 Key zones:
EMA short attention zone ✅
Support: 3920–3960 equilibrium
Watch for bullish divergence before reversal
🔔 Subscribe for daily ETH and BTC market updates, crypto trading strategies, and AI-powered technical analysis!

eTH-USDTEthereum has a similar chart to Solana.
Ethereum has lost its support at $4060 🔥
And this level acts as a resistance
So this resistance must be broken to rise again ✅
Ethereum's new support is at $3900

Ethereum $ETH still has weekly demand in control. Will it rally?Ethereum CRYPTOCAP:ETH still has weekly demand in control. Will it rally higher? Waiting for some more bullish price action or a pullback to the weekly demand lower at $2,600.

ETH-----Sell around 4035, target 3960 areaETH Contract Technical Analysis (October 29th):
On the daily chart, yesterday's close was a small bearish candle, indicating a consecutive decline. The price is still within a range, and the accompanying indicators show a golden cross with decreasing volume. The overall trend remains bullish, but the price is currently in a range-bound movement. However, attention should be paid to data releases and news-driven stimuli. On the hourly chart, the price faced downward pressure during the US session, but rebounded from early support this morning. The current candlestick pattern shows a consecutive bullish reversal, while the accompanying indicators show a bearish cross with decreasing volume. However, the four-hour chart shows significant price suppression, with resistance around the 4035 area.
Today's ETH Short-Term Contract Trading Strategy:
Sell at the 4035 area, stop loss at the 4070 area, target 3960 area;

ETHUSDT-LONG IDEAETHUSDT has broken its trendline toward upside and formed the first internal higher high the retracement to 0.5 fib is done. The overall market structure is bullish So mark your buy stop order here at the given point. do your own research before taking any trade.

ETHUSDT.P - October 28, 2025Price has broken the short-term descending trendline, showing early bullish momentum towards the profit level 4228.35, with the stop level at 4061.07 and breakeven adjustment at 4148.53. Given the wide stop distance relative to recent volatility, this is a medium-risk setup.

ETH movement according to planOn October 26, Ethereum showed a clear upward movement on the 4-hour chart from the 4043.78 level. I entered on the next candle after confirmation and gradually closed positions at three profit-taking levels. I distributed the deposit across these zones and collected around 5 percent profit with 1.5x leverage.
The key is not greed but structure. Thanks to a secret proprietary strategy, it was possible to clearly see the levels and avoid emotional reactions. Many traders at that moment tried to chase the market, entering too late, but precise calculations and visualized levels allowed me to act calmly and without haste.
I often notice that even experienced traders make mistakes by ignoring their plan and technical references. But discipline is what separates chaotic trading from a system. Each level was predetermined, and the price moved exactly according to the calculations.

ETH heavy pump ahead after major daily breakoutEthereum (ETH) is approaching a critical technical juncture as it tests a key descending trendline. A decisive breakout above this trendline, confirmed by a sustained close and supported by high trading volume, would signal a potential reversal of the recent bearish momentum.
Such a confirmed breakout is often followed by a significant bullish impulse. The initial phase of this move would likely be characterized by strong, high-volume bullish candles, indicating robust buyer conviction.
Based on classical technical analysis principles, and specifically using measured move projections from the prior consolidation range, the initial upside target following a successful breakout is projected toward the $5,500 level. This represents a significant resistance zone and a logical first objective for a new bullish phase.
DISCLAIMER: ((trade based on your own decision))
<<press like👍 if you enjoy💚

It looks like the market is about to move in a continuation trenIt seems the economy may not undergo a “bubble reset” anytime soon. If that’s the case, the value of money will continue to depreciate, making investment channels such as stocks and cryptocurrencies increasingly attractive to investors. Although the core purpose of crypto is to promote balance and decentralization, when ownership becomes concentrated in the hands of a small group or a single entity, it exposes a structural weakness in the digital asset market — particularly for BTC and ETH.
