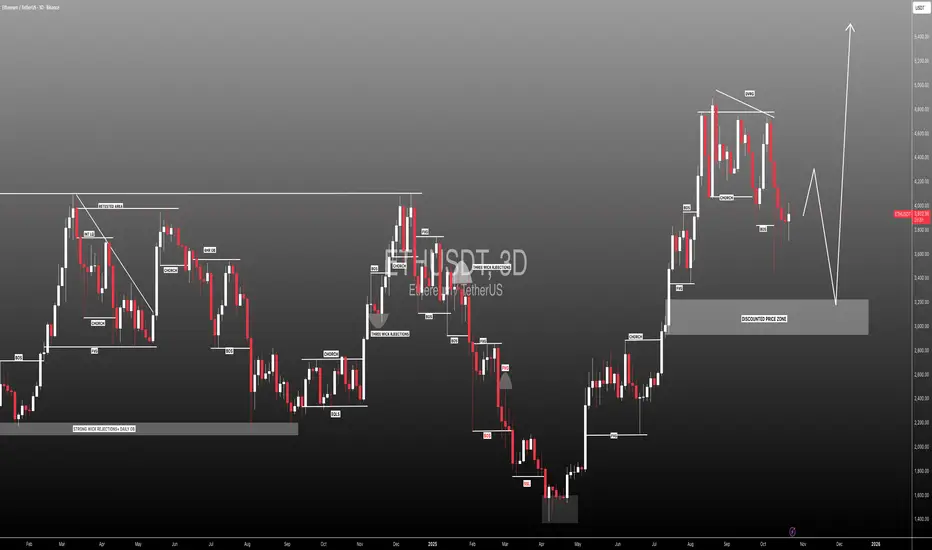
[SeoVereign] ETHEREUM BEARISH Outlook – October 27, 2025Hello everyone,
Currently, Ethereum has re-entered a major resistance zone,
and there is a high probability of a short-term corrective movement emerging.
First Basis — FIBONACCI 1.13~1.272
Ethereum is positioned within the 1.13–1.272 range relative to the upper structure.
This zone is generally recognized as an overheated area of an upward wave,
where selling pressure tends to emerge following the formation of a short-term high.
Second Basis — WAVE.M = WAVE.N × 1.618
The ongoing M-wave shows an extension ratio of approximately 1.618 relative to the previous N-wave.
This represents an overextended structure in wave theory,
which is typically interpreted as a sign of trend exhaustion and potential reversal.
Accordingly, the average target price is set around 3,864 USDT.
This perspective is based on data as of October 26,
and further updates will be provided to refine this outlook as the market develops.
Thank you for reading.
Trade ideas

ETHEREUM ETHUSDTTHE 3HR STRUCTURE CONFIRMS THAT THERE IS NOTHING LIKE MANIPULATION IN TRADING.WHAT WE HAVE IS DEMAND AND SUPPLY.
TRADERS SAND OVERSIGHT ARE NORMAL AND WILL TAG IT AS MANIPULATION.
AM LOOKING FOR SUPPLY AROUND 4378.69 IN THE DIRECTION OF TAKE PROFIT AGAIN.
Ethereum remains the second-largest cryptocurrency by market capitalization and continues to be a foundational platform for decentralized finance (DeFi), smart contracts, and tokenized assets.
Ethereum Overview and Outlook
Ecosystem Growth: Ethereum’s ecosystem is expanding with over 127 million active wallets and total value locked (TVL) in DeFi protocols reaching about $96.86 billion, a 50% increase since mid-2025.
Technology Upgrades: Recent upgrades like Pectra and Fusaka, along with Layer 2 solutions such as Arbitrum, improve scalability, reduce fees, and enhance user experience.
Macro and Regulatory: Institutional inflows via Ethereum ETFs total nearly $24.7 billion, supported by gradual regulatory clarity.
Price Forecast: Despite short-term volatility, Ethereum shows strong fundamental on structure and rally.
Summary
Ethereum remains a dominant blockchain platform with robust adoption and technical advancements, supporting a positive price outlook .currently, with potential to rally toward $5000-6000k if they break and close weekly resistance
the ecosystem growth, institutional participation, and network upgrades will be its bullish catalyst
#ETHUSD #ETHEREUM

ETH soon will get the ticket of moonThe market structure for Ethereum has turned decidedly bullish following its decisive breakout above the key $4,400 level, which coincided with a major descending trendline resistance. A confirmed and sustained move above this level typically validates the strength of the breakout. This technical development suggests a high probability of a significant upward impulse, with initial projected targets residing in the $5,000 to $7,000 range.
DISCLAIMER: ((trade based on your own decision))
<<press like👍 if you enjoy💚

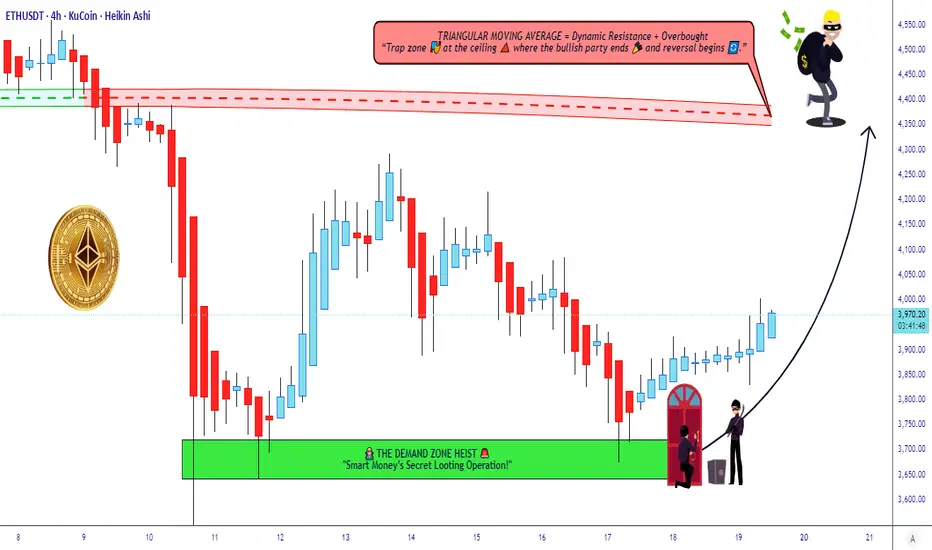
Ethereum Technical Map – Bulls Leading the Charge!🎯 ETH/USDT: The Gentleman Thief's Swing Play | 3600→4350 Target 🚀
📊 MARKET OVERVIEW
Asset: ETHEREUM/TETHER (ETH/USDT)
Timeframe: Swing/Day Trade
Bias: 🐂 BULLISH
Strategy Type: Wealth Accumulation Map
🎭 THE SETUP (A.K.A. "THE HEIST PLAN")
🟢 ENTRY ZONE
Flexible Entry: Any current price level accepted
Translation: We're not picky—grab your ticket to the moon wherever you are!
🛑 STOP LOSS (THE "THIEF'S INSURANCE")
SL: $3,600
⚠️ Important Note for OG Thieves:
Listen up, Ladies & Gentlemen! This is MY stop loss level, not a divine commandment. You've got your own vault to protect—set YOUR stop loss based on YOUR risk appetite. Your money, your rules, your responsibility. Don't blame me if you ignore risk management! 💼
🎯 TAKE PROFIT TARGET
TP: $4,350
📍 Technical Confluence:
Triangular Moving Average acting as strong resistance
Overbought conditions developing
Potential bull trap zone forming
⚠️ Another Friendly Reminder:
Dear OG Thieves, this is MY target—not financial advice carved in stone! Scale out, take profits along the way, or let it ride. YOU decide when to count your loot. Exit strategy is YOUR masterpiece! 🎨
🔍 KEY TECHNICAL LEVELS
Resistance Zones:
Primary: $4,350 (TMA + Overbought)
Watch for rejection wicks at this level
Support Foundation:
$3,600 (Our safety net)
Strategy:
Classic "buy the dip, sell the rip" with proper risk management. We're riding the wave, not fighting the tide! 🌊
👀 RELATED PAIRS TO WATCH
Correlated Assets:
BTC/USDT ( CRYPTOCAP:BTC ) - King leads, ETH follows (usually)
SOL/USDT ( CRYPTOCAP:SOL ) - Alt season companion
MATIC/USDT ( SEED_DONKEYDAN_MARKET_CAP:MATIC ) - Ethereum ecosystem play
BNB/USDT ( CRYPTOCAP:BNB ) - Exchange token correlation
AVAX/USDT ( CRYPTOCAP:AVAX ) - Smart contract platform peer
💡 Correlation Notes:
When BTC pumps, ETH typically follows with stronger percentage moves. Watch Bitcoin dominance—if it drops while BTC rises, expect explosive alt season momentum. SOL and AVAX often move in tandem with ETH as the "Layer 1 trio."
⚙️ RISK MANAGEMENT (THE GENTLEMAN'S CODE)
✅ Never risk more than 1-2% of portfolio per trade
✅ Consider partial profit-taking at resistance levels
✅ Trail your stop loss as price advances
✅ Don't marry your position—take the money and run when it's time! 💰
🎩 FINAL WORDS FROM YOUR FRIENDLY NEIGHBORHOOD CHART THIEF
This analysis combines technical indicators, market structure, and a healthy dose of swagger. Remember: The market doesn't care about your feelings, your bills, or your dreams. Protect your capital like it's the Crown Jewels! 👑
Trade smart, stay humble, and may the pips be ever in your favor! 🎲
✨ If you find value in my analysis, a 👍 and 🚀 boost is much appreciated — it helps me share more setups with the community!
#ETHUSDT #Ethereum #CryptoTrading #SwingTrading #DayTrading #TechnicalAnalysis #CryptoTA #ETHUSD #AltcoinTrading #CryptoStrategy #TradingIdeas #CryptoSignals #BullishSetup #RiskManagement #TradingView #ETH #Cryptocurrency #DigitalAssets #CryptoMarket #TradingCommunity
📈 Chart Analysis | 🎯 Swing Trading | 💎 Crypto Markets | 🚀 To The Moon
ETH Outlook – Mid & Short TermHello Traders 🐺
In this idea, I want to talk about the next target for ETH and explore its potential mid- and short-term movements, so make sure to stay with me until the very end.
Let’s start with the weekly chart, then move down to the daily for a more detailed analysis:
As you can see on the weekly, with the current close above the blue resistance line, we can still have some hopium for ETH — meaning we’re still bullish for now, and everything looks fine so far.
But what am I expecting from ETH right now?
Let me be honest with you guys — if the price can recover from the current dip and break above the orange resistance line (which is also the daily supply zone), I expect at least another leg up toward $5,900, where price will face the 0.5 Fibonacci retracement level.
But what about the immediate short term?
As you can see on the daily chart, as long as ETH can hold above the purple support trendline, we can expect higher price targets ahead.
I think this is a crucial level for ETH to watch closely — we need to stay above it to keep the bullish structure alive.
I hope you enjoyed this idea, and as always remember:
🐺 Discipline is rarely enjoyable, but almost always profitable. 🐺
🐺 KIU_COIN 🐺

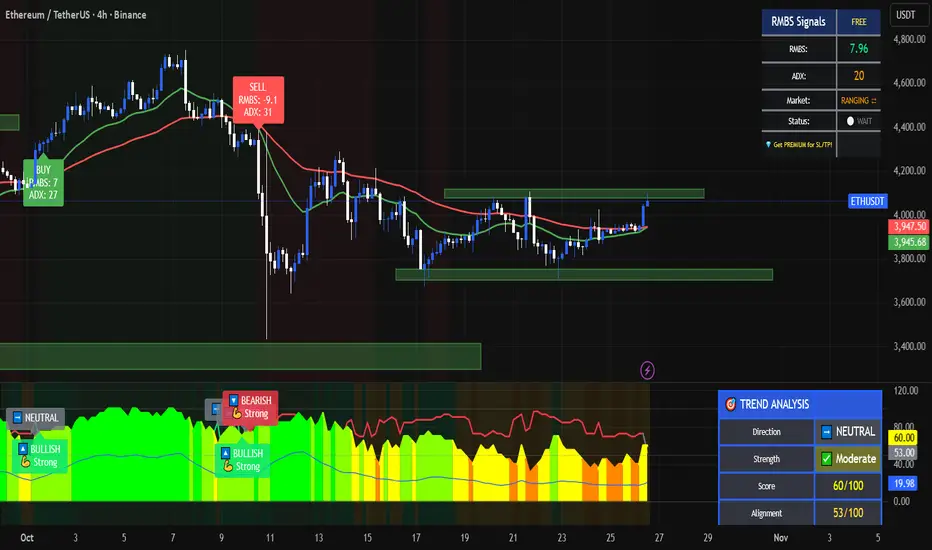
RMBS Shows Ethereum in Range Mode — Correction Still on the Tabl🔸 Ethereum is ranging between $4,100 and $3,700.
The RMBS indicator also confirms this sideways phase.
Everyone knows I’ve been expecting a deep crypto correction — though in markets, we deal with expectations , not prophecies .
#Ethereum #Crypto #Trading #BTC #ETH #TechnicalAnalysis #RMBS #CryptoMarket
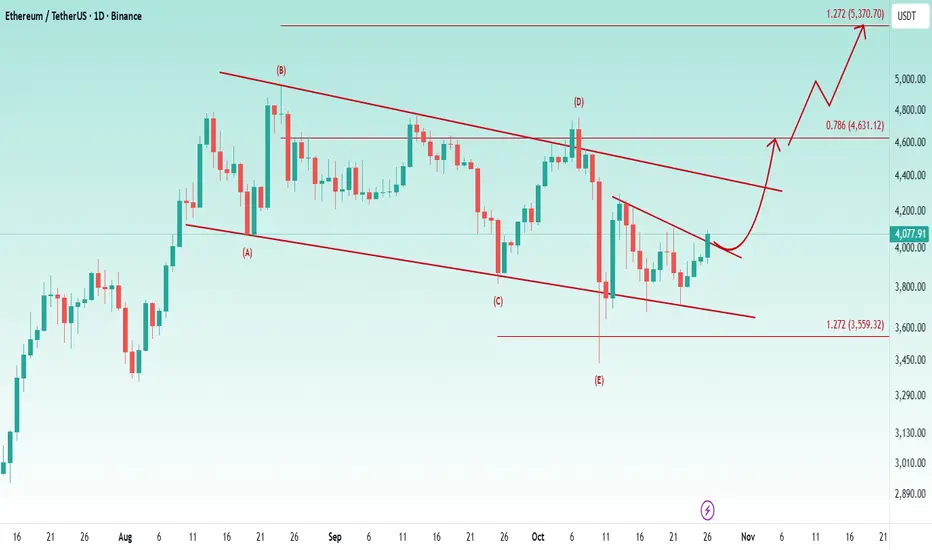
Ethereum is on its way to a new ATH🔘 There’s no change from my previous update
📥 price of Ethereum has tested the bottom of the bullish flag several times and has managed to hold its position well.
👉 Currently, in the lower timeframes, it is breaking the descending trendline.
📈 I expect a bullish move to start from this area toward 4600$, followed by a breakout of the bullish flag and a continuation of the move toward 5370$ as a new ATH.
🔰 Overall, the structure of Ethereum looks strongly bullish to me, and I anticipate a powerful upward trend in the near future.The price remains in a strong demand area and still looks attractive for buying
ETH Support Holding, But Cracks ShowingAs long as CRYPTOCAP:ETH holds the key support zone, the overall structure remains bullish and there’s nothing to worry about.
However, the technical setup is starting to weaken, a break below this support could turn things ugly, especially for altcoins.
DYOR, NFA
#PEACE
Thanks for reading! Appreciate your support and engagement 🙏

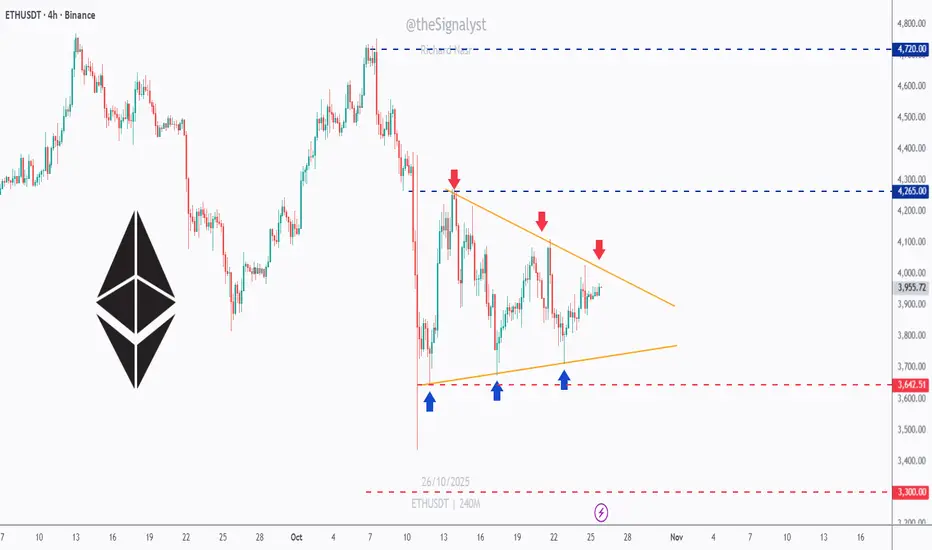
ETH - The Symmetrical Triangle of the Month!Ethereum has spent most of October coiling inside what can only be called the symmetrical triangle of the month => a textbook compression of volatility where both bulls and bears are building pressure for the next decisive move.
📦Price is trapped between the $4,265 resistance and $3,640 support, with multiple clear reactions from both boundaries. Each time ETH bounces off the lower orange trendline, buyers step in aggressively… but every push higher has been capped by lower highs, a perfect battle of strength versus patience.
The breakout from this formation will likely dictate ETH’s next major swing.
- A break above $4,265 could ignite a rally toward $4,720 and beyond.
- A break below $3,640, however, would expose $3,300, a strong historical demand zone.
⚔️ Until one side wins , it’s all about staying patient, waiting for confirmation, and letting the structure do the talking. The tighter this triangle gets — the bigger the breakout tends to be.
⚠️ Disclaimer: This is not financial advice. Always do your own research and manage risk properly.
📚All Strategies Are Good; If Managed Properly!
~Richard Nasr
Etherium to 7500Right now BINANCE:ETHUSDT is just barely holding above 3500 area which is a good sign and showing it's potential to break ATH. But remember 3500 is not that major support, so it may break this support area and look for major support zone which is around 2100-2600 area. That would be a perfect opportunity enter long position on BINANCE:ETHUSDT , or maybe buy on spot. It can also fakeout 3500 area and go up. And also there is a obvious triangle pattern appeared in 1W timeframe which is a very good sign to go up in my opinion. Our first target will be 7500 and then 10k, 12k, 15k. So time will tell.

ETH-USDT Technical Analysis Report- 25/10/2025 ETH-USDT Technical Analysis Report
## Current Situation Summary
**Current Price:** 3928.43 USDT
**24-Hour Change:** +54.47 USDT (+1.41%)
**Price Range:** 3864.9 - 3957.25 USDT
**Volume:** 72,052,749 Contracts
---
## Price Trend Analysis
### **Overall Trend**
Ethereum is currently in a **mild uptrend**. The price has gained 1.41% in the past 24 hours and has managed to break through the support level of $3864.9.
### **Key Points**
- **Main Resistance:** 3957.25 USDT (24-hour high)
- **Strong Support:** 3864.9 USDT (24-hour low)
- **Current Price:** Near the middle of the price channel
---
## Volume and Volatility Analysis
### **Trading Volume**
The 24-hour trading volume of 72 million contracts indicates **moderate** market activity. This volume is suitable for a price move of 1.41% and indicates a relative balance between buyers and sellers.
### **Volatility Analysis**
- **Volatility Range:** 92.35 USDT (2.35% of current price)
- **Volatility:** Medium to Low
- **Price Stability:** Fairly Favorable
---
## Candlestick Pattern Analysis
Based on hourly data from the past 24 hours:
### **Strengths**
1. **Sustained Uptrend:** Price has risen from 3886.76 to 3928.44
2. **Resistance Break:** Successfully crossed the $3920 level
3. **Strong Support:** Positive reaction at $3864.9
### **Weaknesses**
1. **Resistance at 3957:** Unable to fully break this level
2. **Bearing Volume:** Volume has decreased in recent hours
3. **Hesitation at Highs:** Retracement from daily highs
---
## Forecast and Scenarios
### **Bullish scenario (60% probability)**
- **Short-term target:** 3980-4000 USDT
- **Condition:** Support 3900 held and break 3957
- **Volume requirement:** Increase in trading volume
### **Neutral scenario (25% probability)**
- **Range:** 3880-3950 USDT
- **Duration:** 2-3 days
- **Characteristics:** Fluctuation in the current channel
### **Bearish scenario (15% probability)**
- **Target:** 3820-3850 USDT
- **Trigger:** Break of support 3864.9
- **Warning:** Sharp decrease in volume
---
## Trading recommendations
### **For day traders**
- **Entry:** On retracement to 3900-3910
- **Exit:** Near 3950-3960
- **Stop Loss:** Below 3880
### **For Medium-Term Investors**
- **Expect:** Until a clear break of 3957
- **Target:** 4050-4100 USDT
- **Risk:** Medium
### **Risk Management**
- Maximum 2-3% of capital per trade
- Use a mandatory stop loss
- Monitor trading volume
---
## Conclusion
ETH-SWAP-USDT is currently in a **cautious uptrend**. Despite the 1.41% growth, the market is still waiting for a clear break of the $3957 resistance. Moderate volume and controlled volatility indicate a balanced market. Traders should wait for stronger signals to enter large positions.

#ETHUSDT: First Drop And Then Launch To $5500! ETHUSDT we believe the price will initially decline before launching from the $3000 price region. This area appears more promising and could function as a discounted price zone. Three target levels are suggested below:
* **First target:** $4000. This area presents a minor resistance level, and closing 25% of positions is ideal.
* **Second target:** $4500. This is the second major resistance level, and closing another 25% of positions is recommended.
* **Final target:** $5500. This is our swing target. If the price reaches this level, it could be a suitable area to initiate a swing sell and the commencement of a major bearish move.
Please share your thoughts.
Team Setupsfx_
$ETHUSDT: Update - Long term signal triggeredThe long term bull cycle signal I was waiting for triggered, after turning initially bullish in the mid term 2 months ago, we now have a valid reason to add further exposure to Ethereum and consider staking and participating in other ways of increasing your returns with DeFi.
(I leave this up to you, DYOR, this is beyond the scope of this forecast and involves other risks and complexity that you need to understand well yourself before participating in it).
As far as technicals go, we have a clear invalidation signal if price fails to follow through after this quarter ends, or if it breaks under the level where most of the accumulation took place near 1700-1800.
Upside targets are between 9400 and 54000, with the highest probability target range being between 9400 and 17500 by late 2025. The upper target range is more of a black swan scenario for Bitcoin and would involve some degree of flippening which seems unlikely.
Best of luck!
Cheers,
Ivan Labrie.

ETHEREUM ETHUSDT WEEKLY PERSPECTIVE ETHEREUM TECHNICAL INFORMATION.
THE WEEKLY TIME FRAME SHOWS THAT BUYERS REJECTED THE 4998-5000 ZONE AND IT BECOMES OUR NEW BUY LIMUS TEST IN THE FUTURE.THE BREAK AND COSE OF A WEEKLY CANDLE WILL CALL FOR 15MIN SCALP IN SEARCH OF POINT OF ENTRY TO AIM 6000-7000$ IN PROFIT.
THE CURRENT REALITY WITH ETHEREUM SHOWS LACK OF BIUY MOMENTUM AND ITS EVIDENT FROM THE BREAK AND RETEST OF 4200 LEVEL ON WEEKLY TIME FRAME ON THE CHART ,THIS REACTION IS DETAILED ON THE CHART FOR REFERENCE.
THE SELL CONFIRMATION WILL COME FROM THE WEEKLY BREAK AND CLOSE 3780 AND MY SELL TARGET WILL BE 3116$ DEMAND FLOOR AND ALSO 50% FIB LEVEL
TARGET 2 WILL BE 2727.8 DEMAND FLOOR
AND PRICE COULD GO LOWER BEYOUND THIS ZONE ON BEARISH SENTIMENT AND PROLONGED TAKE PROFIT,
ETHEREUM IN CONTEXT
Ethereum remains the second-largest cryptocurrency by market capitalization and continues to be a foundational platform for decentralized finance (DeFi), smart contracts, and tokenized assets.
Ethereum 2025 Overview and Outlook
Ecosystem Growth: Ethereum’s ecosystem is expanding with over 127 million active wallets and total value locked (TVL) in DeFi protocols reaching about $96.86 billion, a 50% increase since mid-2025.
Technology Upgrades: Recent upgrades like Pectra and Fusaka, along with Layer 2 solutions such as Arbitrum, improve scalability, reduce fees, and enhance user experience.
Macro and Regulatory: Institutional inflows via Ethereum ETFs total nearly $24.7 billion, supported by gradual regulatory clarity.
Price Forecast: Despite short-term volatility, Ethereum shows strong fundamental on structure and rally.
Summary
Ethereum remains a dominant blockchain platform with robust adoption and technical advancements, supporting a positive price outlook .currently, with potential to rally toward $5000-6000k if they break and close weekly resistance at 4200
the ecosystem growth, institutional participation, and network upgrades will be its bullish catalyst
.

ETHEREUM ETHUSDTETHEREUM TECHNICAL INFORMATION.
THE WEEKLY TIME FRAME SHOWS THAT BUYERS REJECTED THE 4998-5000 ZONE AND IT BECOMES OUR NEW BUY LIMUS TEST IN THE FUTURE.THE BREAK AND COSE OF A WEEKLY CANDLE WILL CALL FOR 15MIN SCALP IN SEARCH OF POINT OF ENTRY TO AIM 6000-7000$ IN PROFIT.
THE CURRENT REALITY WITH ETHEREUM SHOWS LACK OF BIUY MOMENTUM AND ITS EVIDENT FROM THE BREAK AND RETEST OF 4200 LEVEL ON WEEKLY TIME FRAME ON THE CHART ,THIS REACTION IS DETAILED ON THE CHART FOR REFERENCE.
THE SELL CONFIRMATION WILL COME FROM THE WEEKLY BREAK AND CLOSE 3780 AND MY SELL TARGET WILL BE 3116$ DEMAND FLOOR AND ALSO 50% FIB LEVEL
TARGET 2 WILL BE 2727.8 DEMAND FLOOR
AND PRICE COULD GO LOWER BEYOUND THIS ZONE ON BEARISH SENTIMENT AND PROLONGED TAKE PROFIT,
ETHEREUM IN CONTEXT
Ethereum remains the second-largest cryptocurrency by market capitalization and continues to be a foundational platform for decentralized finance (DeFi), smart contracts, and tokenized assets.
Ethereum 2025 Overview and Outlook
Ecosystem Growth: Ethereum’s ecosystem is expanding with over 127 million active wallets and total value locked (TVL) in DeFi protocols reaching about $96.86 billion, a 50% increase since mid-2025.
Technology Upgrades: Recent upgrades like Pectra and Fusaka, along with Layer 2 solutions such as Arbitrum, improve scalability, reduce fees, and enhance user experience.
Macro and Regulatory: Institutional inflows via Ethereum ETFs total nearly $24.7 billion, supported by gradual regulatory clarity.
Price Forecast: Despite short-term volatility, Ethereum shows strong fundamental on structure and rally.
Summary
Ethereum remains a dominant blockchain platform with robust adoption and technical advancements, supporting a positive price outlook .currently, with potential to rally toward $5000-6000k if they break and close weekly resistance at 4200
the ecosystem growth, institutional participation, and network upgrades will be its bullish catalyst
.
#ethusd #ethereum

Ethereum weakened or holding structure? | ETH 1H Analysis👋🏻 Hey everyone! Hope you’re doing great! Welcome to SatoshiFrame channel.
✨ Today we’re diving into the 1-Hour Ethereum analysis. Stay tuned and follow along.
👀 We observe Ethereum on the 1-hour timeframe. After breaking and stabilizing at the $3,889 zone, Ethereum formed a higher low on this area and is now moving along a trendline (dynamic support), with an important static resistance at $3,982.50. Price has reacted to this level once but has not succeeded in breaking it!!!
🧮 Using the RSI oscillator is a reasonable approach in this situation. Since Ethereum is currently in a box/trading range, a breakout requires entering overbuy territory and surpassing the 70 level. Note that there is a significant oscillation support below the average, at the 44.5 zone, which holds strong validity and represents our swing low.
🐷 Pay attention to Ethereum’s volume. To break the specified zone, Ethereum needs to show a strong reaction, fill sell orders, and liquidate futures contracts. Therefore, we need buyer market makers to support the breakout, causing volume to increase through a price jump.
✍️ The scenario forming for Ethereum may require some patience and could play out differently, because we are now facing the second touch of this level, so the win rate of this scenario may be slightly lower.
🟢 Long Position Scenario
Breaking Ethereum’s resistance at $3,982.50 along with surpassing the 70 RSI level and seeing a significant increase in buying volume and price squeeze can form a good long position scenario on Ethereum.
❤️ Disclaimer : This analysis is purely based on my personal opinion and I only trade if the stated triggers are activated .

High RR...Don't need to be right often - Q the flash dump - A braindead trade regardless of bias - fib targets plotted - if 1.618 busts assume it's a larger correction.

more optimistic cycle topbased on historic data and patterns, a potential -more optimistic- cycle top at price range of 9.5-9.8k USD.

ETHUSDTBINANCE:ETHUSDT have a amazing trend because this is second the best crypto an head of all project so is in watchlist of best traders.
Support for buy: 3750$
Resistance for targets: 4045 - 4200 - 4435 - 4755
Please your risk management.

Possible Ethereum Scenario in the Week AheadPossible Ethereum Scenario in the Week Ahead
Possible Ethereum Scenario in the Week Ahead Given the price of Bitcoin, which doesn't seem very interesting, you should monitor the movement and volatility of Bitcoin.

ETH Eyes Upside RunEthereum shows signs of regaining strength after a prolonged corrective phase. The asset is currently stabilizing, supported by gradual inflows from institutional participants and renewed investor accumulation. Market behavior indicates controlled volatility, suggesting a preparation phase before a potential expansion.
Network data reflects consistent transaction activity, while liquidity concentration hints at sustained participation from long-term holders. The recent stabilization in funding rates and improved open interest add weight to the recovery outlook.
If momentum continues to build under these conditions, Ethereum could enter a structured growth cycle in the coming sessions.

ETHEREUM to $3300 #ETH is so cooked
Descending triangle. This is a textbook classic pattern
If it closes bellow $3700, then it should drop to $3300

Ethereum Sees Major Sell-Off as Price Fails to Break $4,000Ethereum’s price sits at $3,950 at the time of writing, stuck below the critical $4,000 resistance. The altcoin has been oscillating near $3,872, showing no clear directional bias.
The current indicators suggest that this consolidation phase above $3,742 support is likely to persist. However, if market conditions worsen and ETH slips below $3,742, a further decline toward $3,489 could follow. Such a move would confirm a bearish continuation pattern.
Conversely, if buying activity strengthens and overall sentiment improves, Ethereum could breach the $4,000 resistance level. A successful breakout would open the path toward $4,221, invalidating the bearish outlook and signaling renewed investor confidence.
