ETH/USDT | Ethereum Breaks 3000 and Momentum Still Points HigherCRYPTOCAP:ETH pushed all the way to 3000 and the bullish view is still fully intact. From the 2600 rebound to here the move has delivered more than 17 percent already and the structure still supports continuation. As long as ETH holds above the 2500 to 2700 demand zone the upside targets remain 3200, 3500, and 4000 in the next major leg. On the supply side the important zones sit at 3200 to 3300 and then 3500 to 3600 where price may slow down before the next breakout. For now momentum belongs to buyers.
Please support me with your likes and comments to motivate me to share more analysis with you and share your opinion about the possible trend of this chart with me !
Best Regards , Arman Shaban
Trade ideas

Ethereum — Market Update (Zones Playing Out Exactly as Expected)ETH continues to follow the levels we mapped out weeks ago.
Every zone has reacted with precision, confirming the strength of the HTF structure and the broader bearish momentum.
🔻 Trend Outlook
ETH remains below the broken ascending channel — no bullish structure has formed since the breakdown.
The current bounce is weak and corrective, showing no sign of trend reversal.
Market is forming consistent lower highs, signaling continuation to the downside.
🎯 Next Major Target
Price is currently heading toward the blue demand zone, which we’ve been tracking:
👉 $2,134 – $2,200
This is the next high-probability reaction area, and until price reaches that zone, bearish continuation remains the most likely scenario.
⚠️ No Bullish Bias Yet
Temporary green candles do not change the structure.
Until ETH reclaims $3,277 with strength, all rallies are simply relief moves inside a downtrend.
📌 Summary
All previously marked zones have respected perfectly.
ETH remains bearish.
Next key destination: $2.13k – $2.20k
Expect volatility but structure remains clearly downward.
❗ Not financial advice — personal analysis only.

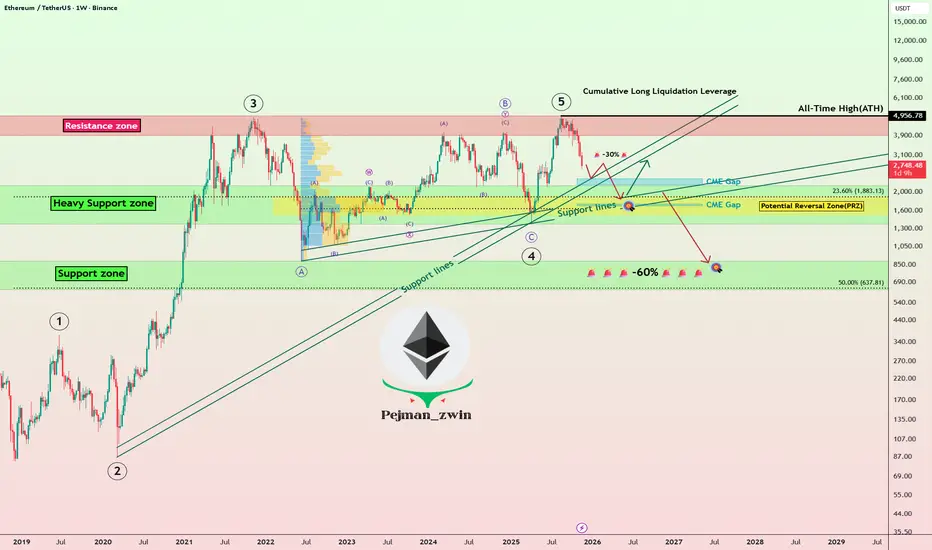
Ethereum Roadmap: Will ETH Bounce or Begin a Deeper Correction!?Today, I’d like to dive into an analysis of Ethereum ( BINANCE:ETHUSDT ). Given that over 80% of tokens in the crypto market are built on the Ethereum blockchain, Ethereum’s performance can serve as a roadmap for other tokens on the network.
So, stay tuned!
In recent times, Ethereum hasn’t been able to keep pace with Bitcoin’s growth and struggled to set a new All-Time High(ATH=$4,956). After Bitcoin’s decline, Ethereum also started to drop and is currently moving near the Heavy Support zone($2,160-$1,370), Support lines, Cumulative Long Liquidation Leverage($1,745-$1,629), and Potential Reversal Zone(PRZ) .
From an Elliott Wave perspective, it seems that Ethereum has completed its main five-wave impulsive. This suggests that we might now be entering a corrective phase. The extent of this correction will depend on multiple factors, and technical analysis alone won’t predict the exact magnitude of Ethereum’s decline in the coming days or weeks. Nonetheless, I’ll keep you updated step-by-step.
Looking at the USDT.D%( CRYPTOCAP:USDT.D ), it’s currently on an upward trend. This rising dominance can lead to further declines in Ethereum, reinforcing the bearish outlook.
Another important index is the US 10-Year Government Bond Yield ( TVC:US10 ). If the US 10-Year Government Bond Yield continues its upward movement, it can put additional pressure on risk assets like Bitcoin( BINANCE:BTCUSDT ) and Ethereum, leading to further declines.
Now, the question is: where might we see Ethereum resume its upward trajectory?
It’s likely that Ethereum will continue its downward movement(-30%), potentially filling the CME Gap($2,344-$2,186), CME Gap($1,745-$1,629) near the $2,000(Round Number). Once it stabilizes around that zone, we could look for signs of a recovery.
However, if Ethereum breaks below its Heavy Support zone($2,160-$1,370), we might face even more significant declines, potentially exceeding -60%.
Where do you think Ethereum will start to rise again? Or are more red days ahead?
💡 Please respect each other's opinions and express agreement or disagreement politely.
📌Ethereum Analyze (ETHUSDT), Weekly time frame.
🛑 Always set a Stop Loss(SL) for every position you open.
✅ This is just my idea; I’d love to see your thoughts too!
🔥 If you find it helpful, please BOOST this post and share it with your friends.
ETH - Technical Dip BuyETH down 47% and hitting a harmonious point of support and ratio confluence here.
Similar detail to TOTAL but with even more ratio balance: a double Golden Window here and on LTF it has retraced to a GW - similar to TOTAL 👍.
This is quite a clear buy here and crypto looks set to bounce.
See linked TOTAL thread for more details.
This analysis is shared for educational purposes only and does not constitute financial advice. Please conduct your own research before making any trading decisions.

#ETHUSDT: Price is yet to drop around $1780 area before bullsETHUSDT is likely to fall further to around $1900 or $1800. This area appears more promising and has strong bullish volume. We should wait for price confirmation before entering.
If you like our idea, please like and comment. Also, use accurate risk management.
Team Setupsfx_

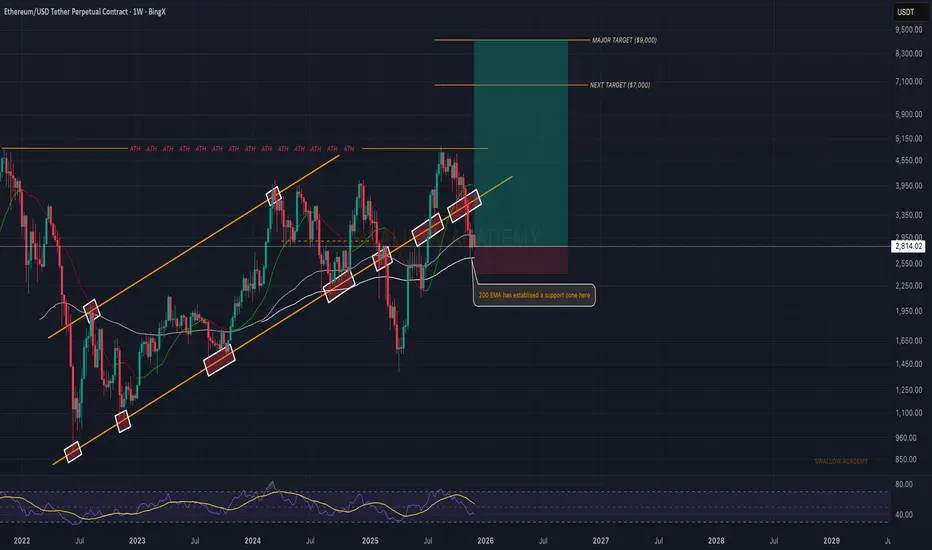
Ethereum (ETH): Decent Recovery Happened, Now Looking For BOSEthereum had a decent week of recovery (last week), and now we are looking for the BOS to form near our entry, which would confirm our bullish game plan here.
ETH seems undervalued for us so we are expecting the BOS to happen within this week, which then should lead the price to our targets.
Swallow Academy

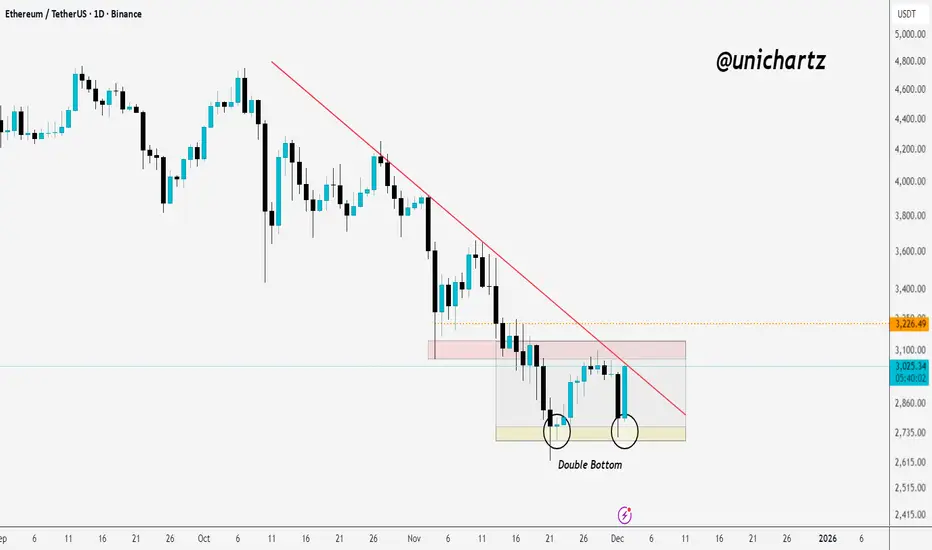
ETH Daily Structure Turning Bullish?CRYPTOCAP:ETH has formed a clear double-bottom pattern on the daily timeframe.
A breakout above the trendline and the consolidation zone would be a strong signal of a potential trend reversal.
Keep an eye on this setup, it could turn bullish quickly if confirmed.
DYOR, NFA
Please hit the like button if you like it, and share your views in the comments section.
ETHUSDTEthereum Market Analysis
Introduction
Hello dear traders! In this analysis, I have updated the status of the famous Ethereum chart. In the previous analysis, for Ethereum on a long-term basis, we identified the CHoCH (Change of Character) trend change with precision and specified the best selling zone. { Ideal selling time with confirmation will be announced in the future and a great time. }. According to the plan, there is currently a nice buying swing; this analysis is now for the 4-hour timeframe and shows us small upward steps. My analysis is very simple and straightforward, and there is no need for further explanation. I wish you success and enjoy the analysis.
Wishing you all success!
Fereydoon Bahrami
A retail trader in the Wal Street Trading Center (Forex)
Risk Disclosure (Risk Disclosure):
In the cryptocurrency market, trading is risky due to high price volatility. This analysis is solely my personal opinion and should not be considered financial advice. Please do your own research. You are responsible for any profits or losses resulting from this analysis.

ETH : SELL MARKET!!!Hello friends
Well, as you can see, we are in a very strong downtrend and the sellers have full control.
Now, any price increase can be a selling opportunity, until the buyers show strength, we cannot say that the trend has changed...
Of course, we are also at important support and we need to see whether buyers support the price or not. Until then, we will not trade on guesswork and predictions.
This analysis is purely technical and is not a buy or sell recommendation, so please exercise your risk and capital management.
*Trade safely with us*

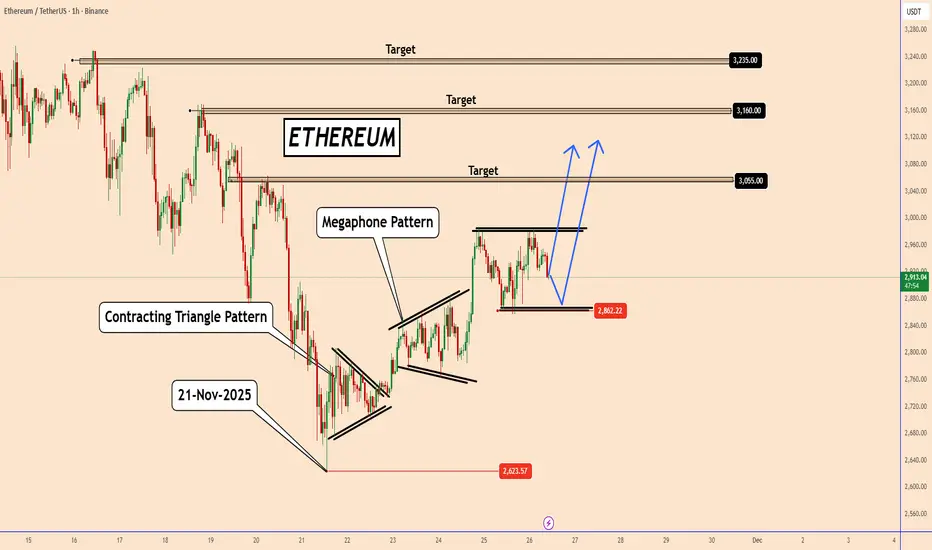
ETH: Pattern After Pattern — Bulls Preparing for ContinuationETH: Pattern After Pattern — Bulls Preparing for Continuation
On November 21, 2025, Ethereum tested a very old support area near the 2623 level, where it also had a strong upward momentum.
From the chart, we can see that over the past 5 days, Ethereum started to rally and completed 2 bullish patterns so far, but slowly progressing upwards.
Currently, ETH is rallying again after a "Contracting Triangle Pattern" and a bullish "Megaphone" pattern.
The new pattern seems to be bullish again, however, ETH should respect the new pattern.
If the price moves above the pattern again, it should start another upward move as shown in the chart.
Main targets:
3055
3160
3235
You may find more details in the chart!
Thank you and Good Luck!
❤️PS: Please support with a like or comment if you find this analysis useful for your trading day❤️
ETHCRYPTOCAP:ETH reclaiming back inside the triangle is a major bullish signal. The market refused to let it drop to the $2000 level, which shows real strength. I am expecting CRYPTOCAP:ETH to trade between $6000 and $7000 very soon as momentum shifts back to the upside.

DeGRAM | ETHUSD will rebound from the $2800 level📊 Technical Analysis
● ETH/USD has broken above the long-term descending resistance line and is now retesting it while holding the higher-low structure near the 2,600–2,700 zone. This confirms a potential reversal from the extended corrective phase.
● Price is also rebounding from the lower boundary of the falling channel, with consolidation clusters suggesting accumulation before a move toward 3,300–3,400.
💡 Fundamental Analysis
● ETH sentiment strengthens as staking inflows rise and developers finalize key upgrades for 2026, while improved risk appetite supports large-cap crypto recovery.
✨ Summary
● Bullish bias above 2,650. Targets: 3,300 → 3,400. Support: 2,600. Resistance: 3,350.
-------------------
Share your opinion in the comments and support the idea with a like. Thanks for your support!

$ETH - Ping-Pong ZoneCRYPTOCAP:ETH is sitting under this diagonal resistance. Could see a technical bounce around 2.9k (ltf support) , but if we can’t clear 3.1k, we could see it retesting 2.8k to 2.7k
Bottoms don’t form overnight, so Ethereum will probably keep ping-ponging in this 2.6k–3.1k range for a bit before the next move.

ETH/USDT 1DAY CHART ANALYSIS !!ETH/USDT on the 1D chart is in a corrective downtrend but currently bouncing toward a major resistance supply zone around 3,500–3,700 USDT.
Price broke below the rising trendline and retested lower, confirming a shift from a strong uptrend to a corrective phase; the main support below is the 2,400–2,550 demand area where the last major rally started.
Above, the grey 3,500–3,700 band is a strong supply/resistance zone formed by prior consolidation and distribution before the last drop, while the top range resistance sits near 4,800.
Bull case: If bulls can push price into the grey zone and break/close decisively above it, structure improves, and ETH can target the upper range toward 4,400–4,800 again.
Bear case: Rejection from the grey zone would likely send ETH back down toward the yellow 2,400–2,550 support, and losing that opens room for a deeper slide toward the 1,400 and 1,000 higher‑timeframe supports marked below.
DYOR | NFA

Ethereum (ETH): Setting Entry For Long Now | Bullish Above EMAs Ethereum seems doomed, but not that much. We dipped once again to EMAs, where this is our last support zone, which keeps our bullish view in play.
As long as buyers keep this zone under control (especially 200 EMA), we are looking for a reversal from here.
The target is to form a new ATH (we have time until March 2026).
Swallow Academy
ETHUSD SELL NOW!!!!!ETHUSD made a strong rejections off the supply region after sweeping liquidity at the buyside am looking forward for a sell off point from this zone till price creates a new lows......

ETHEREUM Analysis (12H)From the point where we marked the green arrow on the chart, the Ethereum triangle has begun, and at the point where we placed the red arrow, this triangle has completed and the price has entered a bearish phase.
It seems that we are currently in the late stages of wave C of this phase. Just note that this is the 12-hour timeframe, and this phase has not finished yet; its completion requires more time. We expect wave C to finish within the green zone, which is a supportive flip area.
From the green zone, wave C is expected to complete and the price should enter wave D, for which we have marked the targets on the chart.
Let’s see how it will unfold.
For risk management, please don't forget stop loss and capital management
When we reach the first target, save some profit and then change the stop to entry
Comment if you have any questions
Thank You

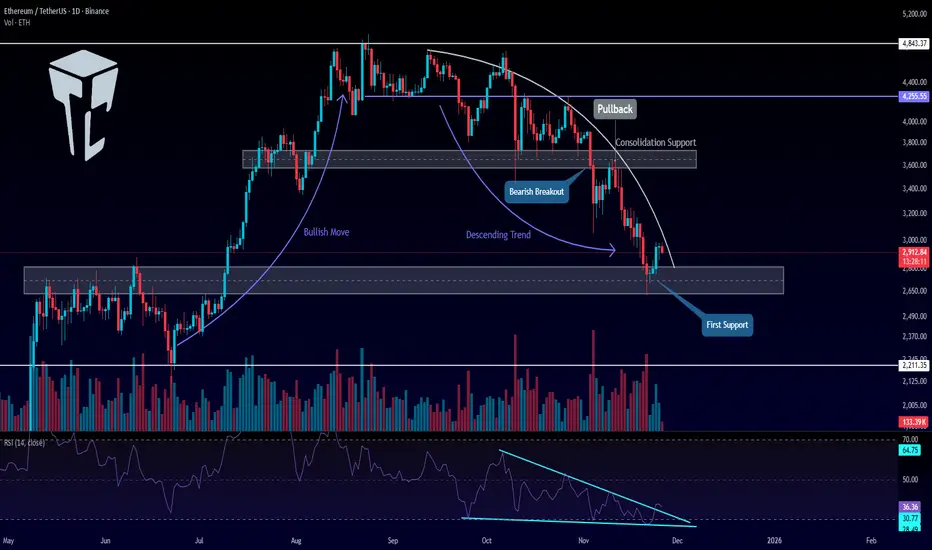
TradeCityPro | Ethereum Eyes Key Levels for Trend Reversal👋 Welcome to TradeCityPro!
Let’s dive into the Ethereum analysis, the queen of the market, ranked 2nd on CoinMarketCap with a $351 billion market cap, right after Bitcoin.
📅 Daily Timeframe
On the daily timeframe, after the upward movement Ethereum made, it reached the 4,843 resistance zone and then entered a consolidation phase.
✅ The bottom of this range was at 3,700, and the middle of the box was at 4,255, which the price reacted to.
🔔 After breaking the lower boundary of the box, the bullish trend Ethereum had came to an end, and a bearish trend with a curved trendline began.
⚖️ After a pullback to the 3,700 zone, a downward move took place, reaching the next support zone at 2,700, and now the price is reacting to the 2,700 zone.
💥 The RSI oscillator formed a descending triangle during this move, which contributed to the increasing bearish momentum in the market.
💡 Now, with the price reaching 2,700, the triangle has broken to the upside, and the bearish momentum has slowed down for now.
🎲 The confirmation of the new bullish momentum will come after breaking the curved trendline and forming a higher high and higher low above the 2,700 level.
📈 The main trigger for Ethereum's bullish trend will be stabilization above 3,700.
⚡️ If the 2,700 level breaks, the next support zone will be at 2,211.
💫 Personally, I’ll try to open a short position on Ethereum if the 2,700 level breaks.
🔼 For a long position, triggers can be found on lower timeframes, but for the main positions, we should wait for the price to form a higher high and higher low.
📝 Final Thoughts
Stay calm, trade wisely, and let's capture the market's best opportunities!
This analysis reflects our opinions and is not financial advice.
Share your thoughts in the comments, and don’t forget to share this analysis with your friends! ❤️
Ethereum (ETH) Rejected from $3K — Key Support AheadETH recently got rejected at the critical $3,000 resistance, a psychological and technical level that’s held firm amidst broader market volatility. However, bulls shouldn’t panic just yet — Ethereum is now approaching a major support zone between $2,640 and $2,770, where it has previously found strong buying interest. If macro conditions stabilize, momentum could return quickly from this level.
💡 Trade Setup
Entry Zone: $2,640 – $2,770
Take Profit Targets: $3,370 and $4,000
Stop Loss: $2,187
This setup offers a strong risk-reward profile, especially if ETH rebounds as it has done historically from this zone. Watch for volume confirmation and potential bullish divergences on lower timeframes to time entries.

ETH — Scaling Mastery Trendlines: Strat!This ETH setup combines three Scaling Mastery setups—the 1/10, 1/4, and 1/3 structures—stacked inside the same region. That alone makes this a high-value educational chart, because seeing all three appear together is rare.
1️⃣ Scaling Mastery Trendlines (1/10 • 1/4 • 1/3 Sets)
This chart uses the official Scaling Mastery Trendline System, where each trendline ratio tells you a different part of market behavior:
🟧 1/10 Trendline
Shows micro-reaction structure
Helps detect early shifts in momentum
Usually breaks first and gives the initial signal
ETH already broke this one cleanly.
🟦 1/4 Trendline
Shows medium-level structure
Confirms trend bias and filters false moves
ETH is currently retesting/reclaiming this region.
🟩 1/3 Trendline
The strongest diagonal structure
When this breaks, major HTF direction usually follows
ETH is attempting to push into this breakout zone now.
Having all three ratios interacting inside the same price zone is extremely valuable because:
➡️ It shows a stacked confluence of momentum
➡️ It forms a “ladder” of breakout confirmations
➡️ It gives a clean model for trend reversal and expansion
2️⃣ Bullish + Bearish Trendlines Forming a Hidden Channel
When you overlay:
The bearish red channel (recent downtrend)
The bullish turquoise macro expansion trendlines
…you actually get a dual-channel structure.
This means ETH is breaking both:
✔ The bearish downtrend channel
✔ Into the bullish expansion channel
At the same time.
This is a classic Scaling Mastery visual where bearish and bullish diagonals overlap and create a “channel breakout zone.” ETH is currently reacting inside that zone.
3️⃣ Expected Behavior if Breakout Holds
If ETH continues to hold above the 1/10 → 1/4 → 1/3 progression:
🎯 Target 1: $3,941
Mid-channel expansion target.
🎯 Target 2: $4,729 – $4,800
Full expansion to the upper turquoise trendline.
This aligns with standard Scaling Mastery expansion rules.
4️⃣ Structure Summary
1/10 broken ✔
1/4 reclaim attempt ✔
1/3 test incoming ✔
Bearish + Bullish diagonal confluence ✔
Dual-channel breakout structure ✔
Clear expansion targets to the upside ✔
This is a clean educational example of multi-trendline alignment, a signature technique of the Scaling Mastery system.
⚠️ Educational Disclaimer
This idea is for educational purposes only. It is not financial advice or a trade signal. Always analyze your own charts and manage your own risk.

Ethereum (ETHUSDT): Approaching a Major Turning PointHI!
Trend Structure
Since mid-October 2025, ETH has been trending inside a well-defined descending channel, forming consistent lower highs and lower lows. The break of the previous bullish trendline back in July 2025 confirmed the shift into a corrective phase.
Key Support Zone (S&D)
Price is now around $2,730 (Nov 2025) and heading toward the crucial $2,450–$2,300 S&D zone, a strong support area that held the market firmly between May and July 2025.
Expected Price Behavior
A final liquidity sweep toward $2,300–$2,200 is possible before any sustainable upside move. This aligns with the lower boundary of the descending channel.
Deeper Support (DP)
If this level fails, the next major demand sits at $1,950–$1,800, last touched in March 2025.

ETH/USDT (4H Timeframe)The chart shows Ethereum’s price action on the 4-hour timeframe with key supply–demand zones, structure levels, and an active long setup.
1. Market Structure
ETH has been in a downtrend, forming lower highs and lower lows, but recently it created a short-term bullish reversal from the demand zone near $2,880–$2,950.
Price broke a small internal structure high (marked “XX-Liquidity”), indicating potential short-term bullish strength.
2. Key Zones
Major Supply Zone (Upper Blue Box):
Around $3,360–$3,414 — a strong resistance area where price previously dropped heavily.
Major Demand Zone (Lower Blue Box):
Around $2,888–$2,949 — where price had a strong bullish reaction.
3. Order Block (OB+)
A bullish order block is marked just below the current price (~$3,000).
Price is pulling back into this OB, suggesting possible bullish continuation if it holds.
4. Current Position Setup
There is a highlighted long trade zone from the OB, targeting the $3,257–$3,257+ region.
Entry appears near $3,000, SL below the OB, and TP at the previous major structure high.
5. Price Reaction
ETH is hovering around $3,003, testing the order block for liquidity.
If OB holds, price may push toward the target zone. If broken, price may revisit the demand zone at $2,880–$2,940.

Eth Long Ok. So this might be one of the boldest trades one can take in such market conditions. Honestly, i panicked in sweat during this dip which usually means Fear in the market at its extreme.
Now imagine BTC ended oct in red, which usually means (based on history) that there is a 40% drop in BTC price incoming. This will usually nuke the crypto and altcoins matket. However, i came home and checked the monthly chart for ETH, which honsetly showing nothing but bullish vibes.
All analysis is based on the monthly timeframe (TF).
ETH shows a clear V-shape recovery (CSID structure) on the monthly chart.
Price currently sits around the 0.5 Fibonacci retracement level.
ETH is trading within a Monthly Fair Value Gap (FVG).
The structure is resting on a strong support zone (yellow box).
These combined elements indicate a bullish bias, not bearish.
From a liquidity perspective, the $4,500–$4,950 USDT zone forms a major liquidity pool likely to attract price.
On a higher zoom-out, price has already taken liquidity above the November 15 2021 high.
Therefore, from a liquidity-analysis standpoint, there remains potential for ETH to climb above $4,900 in the future.
i have set a one SL. Lets hope for the best in such market conditions.
