#ETH Double Top Structure, Beware of Pullback📊#ETH Double Top Structure, Beware of Pullback📉
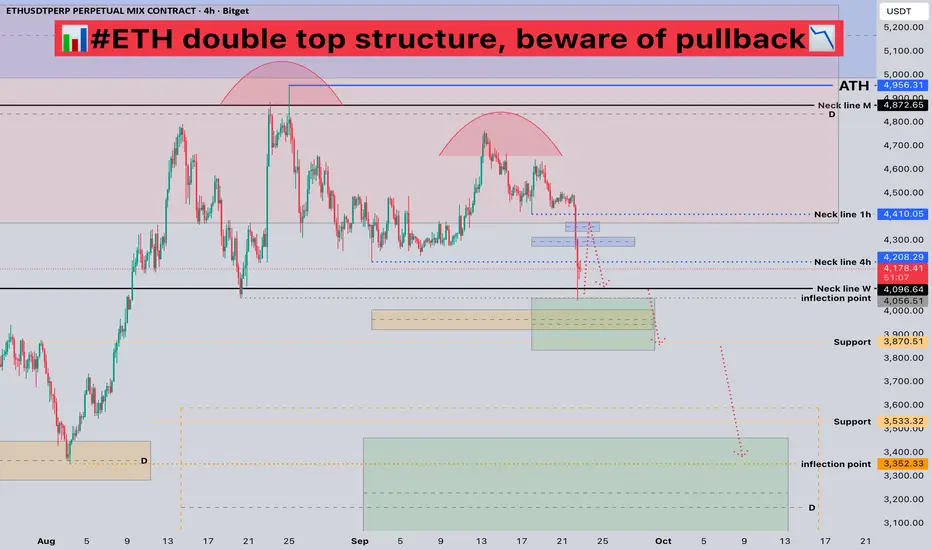
🧠From a structural perspective, we've formed a bearish double top structure within the red target zone, so be wary of a deeper pullback.
➡️After today's plunge, we retested the weekly neckline support. We're currently in a rebound phase and have encountered resistance at the 4H neckline. Don't chase the rally here! Strong resistance lies around 4300-4400. If price reaches this level, look for shorting opportunities.
🤜If you like my analysis, please like 💖 and share 💬
BITGET:ETHUSDT.P
Trade ideas
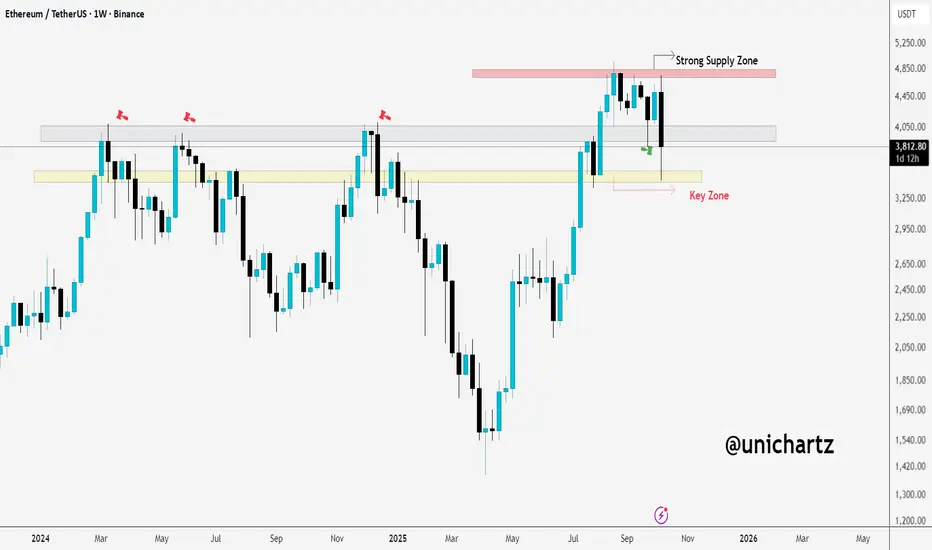
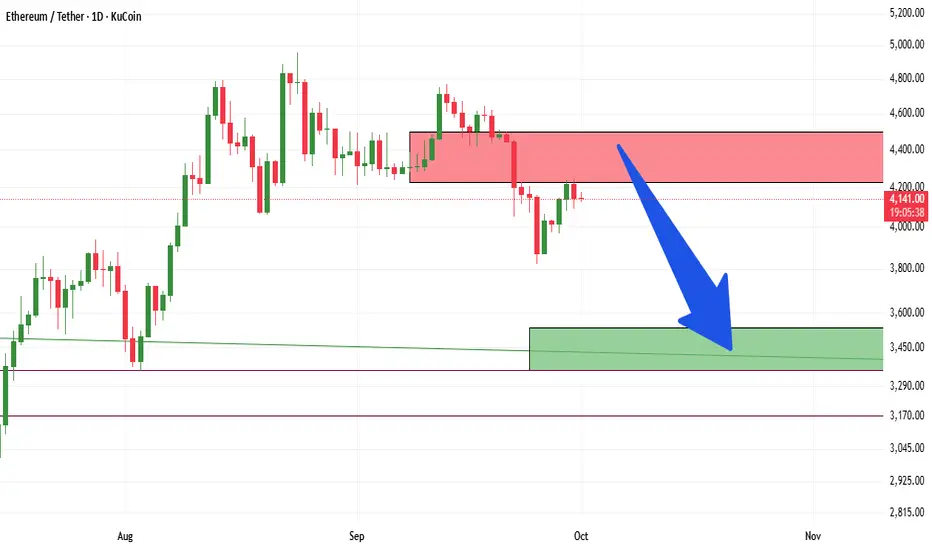
#ETH short target achieved, cautious rebound📊#ETH short target achieved, cautious rebound📈
🧠From a structural perspective, the ideal target area of the double top bearish structure formed by the red resistance zone has been achieved, so a rebound is expected. However, the price is currently near the gray support-resistance conversion zone, and since it's below this area, it should be treated as resistance.
➡️Thus, those who want to participate in long trades should remain patient and wait for a pullback to the yellow support zone before looking for long opportunities.
⚠️Note that if we break below the low near 3400, we may enter a period of pessimistic market sentiment, at which point we will need to look for lower support to participate in long trades, such as around 2680 (both spot and futures trading are very worthwhile).
🤜If you like my analysis, please like💖 and share💬
BITGET:ETHUSDT.P

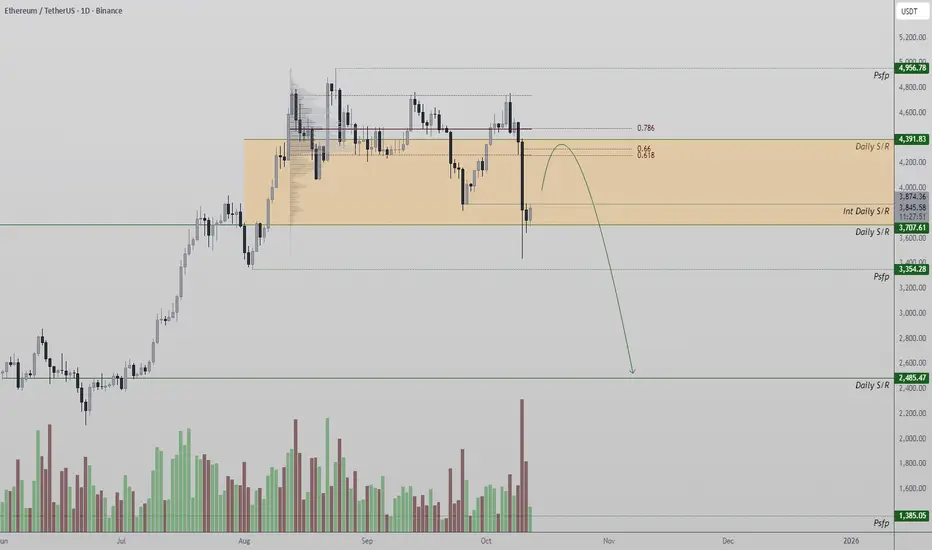
Ethereum Tests Key Daily Range — 0.618 Fibonacci Holds Ethereum price action continues to compress within a narrow daily range, currently finding firm support around $3,700 and facing internal resistance near $3,800 — a critical daily SR level. This tight consolidation phase suggests that volatility is building up, and a breakout on either side could lead to an expansionary move.
The 0.618 Fibonacci retracement aligns perfectly with the value area low of this range, reinforcing the $3,700 support as a significant technical confluence. From a structural standpoint, this zone must hold to preserve the current bullish framework, while failure to maintain it could open the path toward deeper retracement levels.
Key Points:
- Daily Support: Holding firm at $3,700, aligned with the 0.618 Fibonacci and value area low.
- Internal Resistance: The $3,800 daily SR acts as the first test for bulls to reclaim.
- Range Bias: A breakout beyond this $100 zone could initiate a strong expansion or rejection swing.
Should ETH break and close above $3,800, it could trigger momentum toward higher liquidity zones near $3,950–$4,000. Conversely, losing $3,700 may invite a retest of lower supports.
ETHUSDTOn the higher timeframes (1D and 4H) ETH is moving inside a flag pattern that means price is consolidating after a previous big move.
Even after the recent strong crash ETH is still holding inside this range showing that buyers are defending support.
There are bullish divergences forming on the 1H and 4H charts which is often a sign of potential upward reversal.
If ETH forms a strong bullish candle closing above the yellow resistance zone which is 3881.15, that would confirm a possible breakout to the upside.
In that case ETH could target around $4400 as the next resistance or potential takeprofit area.
Always use a stop-loss below the recent support or lower boundary of the flag the market is still shaky and volatile


ETHEREUM
Ethereum price surged early October reaching over $4,500 driven by anticipation of the Fusaka upgrade, institutional adoption, and general market optimism.
Sell-offs following the rally have brought the price back to lower levels, typical of profit-taking amid volatile crypto markets.
key support level is the fib 0.618 level at 2810.29
key support 985$
key resistance around 8500$

ETHUSDT Ethereum Price Action (October 2025)
As of October 12, 2025, Ethereum (ETH) is trading around $3,749.22, down about 2.25% from $3,835.63 on October 11, 2025.
ETH has experienced significant volatility recently, with highs above $4,500 observed in early October before correcting downward.
Over the past year, Ethereum has risen approximately 54%, from $2,435.71 one year ago to current levels near $3,749.
Short-term price support is around $3,700, while resistance lies between $4,100 and $4,600. The price action is characterized by retracements after strong rallies
Moving averages indicate a mixed outlook: the 50-day average is higher near $4,399 while the 200-day average sits around $3,097, suggesting medium-term bullish momentum but near-term corrections.
Recent Trends
Ethereum price surged early October reaching over $4,500 driven by anticipation of the Fusaka upgrade, institutional adoption, and general market optimism.
Sell-offs following the rally have brought the price back to lower levels, typical of profit-taking amid volatile crypto markets.

Ethereum (ETH/USDT) – Daily Chart Analysis !!!Ethereum (ETH/USDT)
Ethereum is moving at a similar pace to Bitcoin – showing heavy volatility and liquidation pressure, but there are also signs of accumulation near strong support.
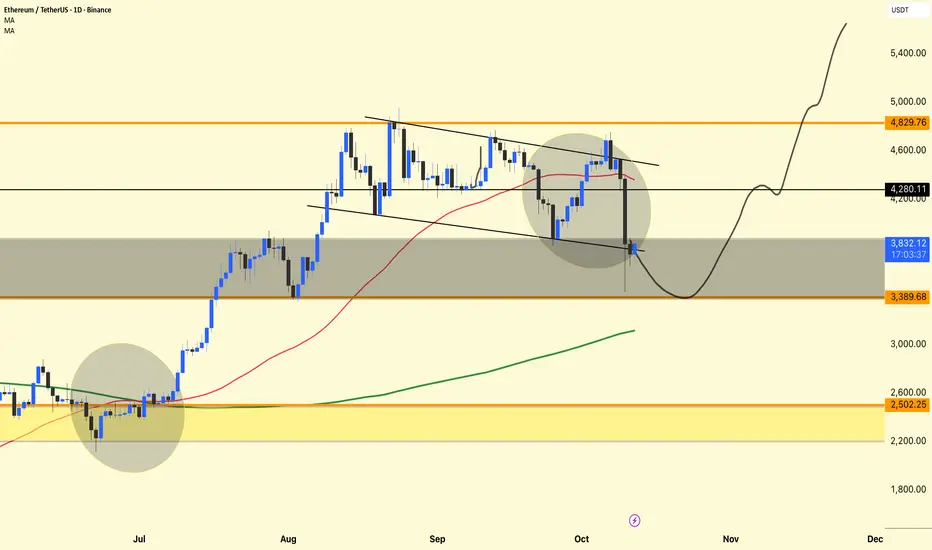
The chart shows a return to a key demand zone after a breakout failure from a descending wedge, followed by the formation of a potential reversal structure.
Descending Channel and Breakdown
ETH had been moving within a descending channel for several weeks.
Recently, it attempted a breakout, but sellers regained control, resulting in a false breakout and a retest rejection.
The candle's sharp decline through the red moving average (around $4,300) indicates that bulls were heavily liquidated.
However, the price saw buying interest around the $3,800–$3,400 area, which aligns with the chart's gray support area.
Moving Average Insights
Red MA (50-day): Currently acting as dynamic resistance; ETH needs a clear close above it to confirm a short-term bullish recovery.
Green MA (200-day): Still trending upwards, indicating that the long-term structure remains bullish despite near-term weakness.
If the price stabilizes above the 200-day MA, it will likely attract medium-term investors.
Current Price Activity
At $3,836, ETH is testing the lower boundary of the support zone.
The chart projection (curved black line) suggests:
A possible short-term retest towards $3,380,
Followed by a gradual recovery towards $4,200,
And then a potential continuation towards $4,800+ if momentum strengthens.
This pattern resembles a "spring" setup—a common accumulation behavior before a major reversal.
DYOR | NFA
Ethereum ShortAs U.S. Treasury yields and the U.S. dollar continue to strengthen, The crypto market continues its selloff. I have outlined some key areas where bulls will start to nibble on longs. Shorts are still open for at least another 2% down.

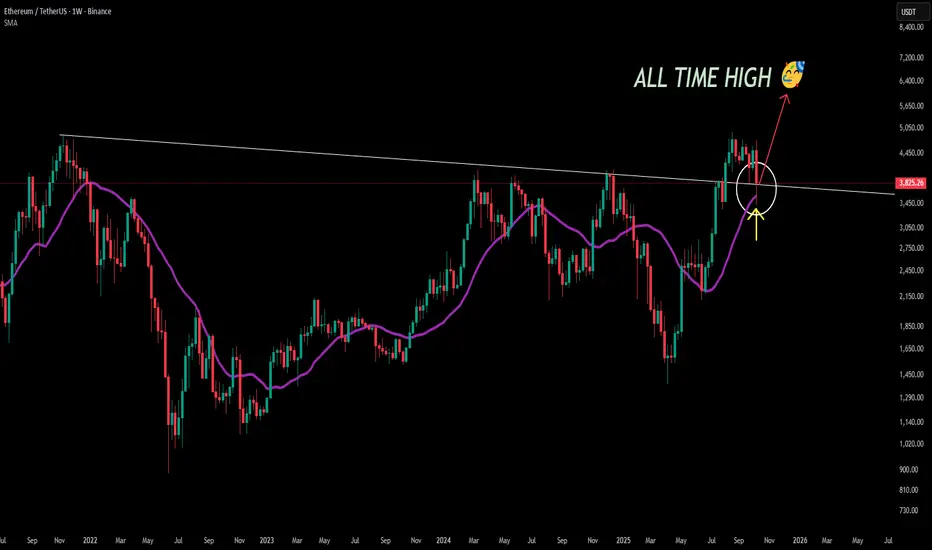
ETH might make a new all time highFrom the current weekly structure, Ethereum (ETH) appears to have completed its corrective phase. Yesterday’s move shows a clean retest of both the 20-period SMA and the long-term descending trendline, confirming this area as a strong confluence zone of support.
This reaction signals a potential reversal point where buyers may regain control. Given this setup, my bias turns bullish — I believe ETH has likely finished its downside correction and could be setting up for a major upward leg.
📈 Outlook: Over the coming months, I expect Ethereum to build momentum and potentially print a new all-time high if market conditions remain supportive.
Still, markets are inherently unpredictable — this remains my personal technical view, not financial advice.
Ethereum (ETH/USDT) — Decision Point at $4,760–$4,960Ethereum is testing the $4,760–$4,960 resistance zone inside its long-term ascending channel.
🔼 Bullish case: A daily close above $4,960 opens the path to $5,500–$6,300, targeting the upper channel.
🔽 Bearish case: Rejection here could pull ETH back to $4,000–$4,100, with deeper supports at $3,200–$2,800 and $2,130.
ETH follows BTC’s momentum — but U.S. macro risks (shutdown, Fed uncertainty) keep downside risk alive.
⚖️ Summary: ETH is at a decision point — breakout above $4,960 = bullish continuation, rejection = bearish retrace.
❗ Not financial advice — only my personal view.

We Called It! ETH Breaks Down Below $4,000 — Just as Predicted!In our previous analysis (Oct 3) we warned loud and clear:
“For ETH to stay bullish, it must close above $4,960 — otherwise, rejection could trigger a deep retrace.”
ETH only managed to reach $4,700, failed to break or close above $4,960, and then collapsed, closing below the $4,000 level — confirming a major bearish breakdown right after one of the largest crypto liquidation waves of 2025.
🔻 Technical Breakdown:
ETH has broken below the ascending channel and lost key structural support.
Price is now consolidating around $3,800–$3,600, but momentum remains weak.
If this zone breaks, next demand levels are $3,200–$2,800, and $2,130 as the final strong support.
Only a daily close back above $4,200–$4,300 can shift structure back to neutral.
📉 Market Context:
Last night’s liquidation wiped out billions in leveraged longs across the crypto market.
ETH followed BTC’s rejection perfectly — exactly as we predicted.
We said it before: no close above $4,960 = correction, and that’s precisely what played out.
⚖️ Outlook:
Short-term → Bearish
Mid-term → Testing support for possible relief bounce
Long-term → Bullish only if price reclaims the channel and $4,300
For those who followed the plan and stayed cautious — well done.
For late longs — the market just gave a painful reminder.
❗ This is not financial advice — just my personal market view.
💬 Check our previous analysis below 👇

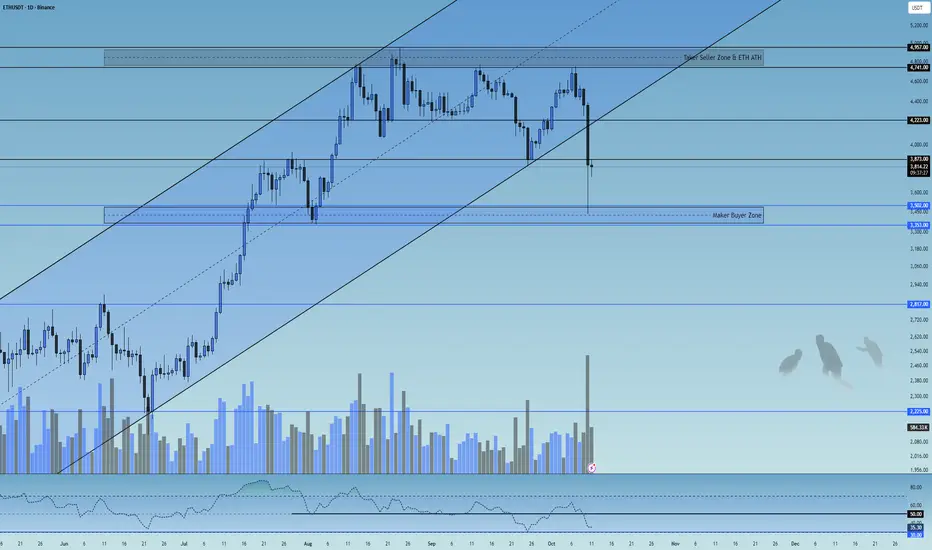
ETH 1D Analysis - Key Triggers Ahead | Day 32☃️ Welcome to the cryptos winter , I hope you’ve started your day well.
⏰ We’re analyzing ETH on the 1-Day timeframe .
👀 On the Ethereum daily timeframe, we can see that after the historic economic war between the U.S. and China, Ethereum broke its ascending channel with a high-volume whale candle and has now managed to stabilize below this channel. Currently, Ethereum is in a critical decision-making zone, with two key resistance levels at $3,873 and $4,223.
A break and confirmation above these zones, especially $4,223, could lead to a bullish continuation; otherwise, a breakdown below the channel support may trigger a deep correction and cause Ethereum to enter a risk-off phase on the higher timeframe (weekly).
🧮 Looking at the RSI oscillator, after crossing down from the 50 level, it is now heading toward the 30 and oversold region. These two zones — 50 and 30 — are our key RSI levels, and when volatility crosses these zones, it can be accompanied by a significant increase in trading volume.
🕯 The recent daily candle of Ethereum has shown a massive amount of sell volume, with an open around $4,400 and a close below $3,900 (ignoring the shadow). This indicates strong selling pressure — if buyers fail to hold Ethereum above $4,200, we could see further correction and selling pressure ahead.
🧠 Currently, there’s no specific trigger for Ethereum, but a trading range will likely form in this zone until the end of the week.
A break of either the top or bottom of this range across multiple timeframes could give us a potential long or short position.
❤️ Disclaimer : This analysis is purely based on my personal opinion and I only trade if the stated triggers are activated .
ETH in Danger: Breaking Below $3,200 Could Signal Bigger DropCRYPTOCAP:ETH is facing rejection from the strong supply zone around $4,800. The weekly candle failed to hold above that level and is now pulling back towards the key demand zone between $3,200–$3,300.
If the price fails to reclaim this support, we could see a more bearish scenario unfolding.
DYOR, NFA
Thanks for the reading
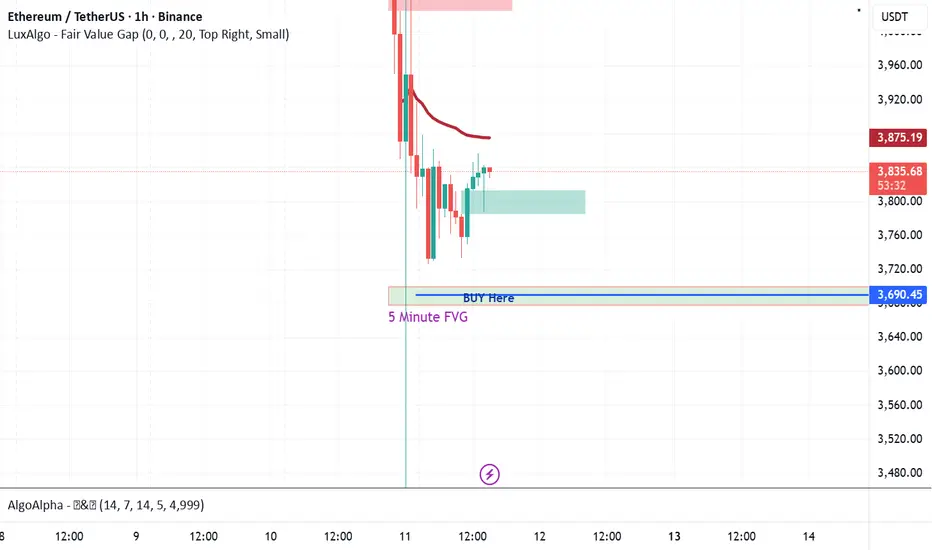
ETH long from 5min EOB/ iFVGEth might visit 3690$ to fill 5 min fair value gap. this could be great entry for long hold.
ETH/USDT Bearish Continuation from Supply Zonea bearish continuation setup on Ethereum (ETH/USDT) in the 4-hour timeframe. After a strong downward impulse, the price retraced into a highlighted supply zone, suggesting a potential rejection from this resistance area. The projection shows a likely continuation of the downtrend, targeting the 3,797.51 level, with a Stop Loss positioned above the recent swing high around 4,303.62.

New scenario ahead for Ethereum in the coming weekI think that given the uncertainty of the decisions and economic and political developments in the world, the price of Ethereum will suffer between $3,720 and $3,900, then it will have a price drop to $3,200 and will come back strongly from $32,000 with higher targets.
Note: This is not financial advice. The decision will be made by the individual.

Ethereum's Scenarios for the Week Ahead??The key points are indicated in the chart. And if the stop point is broken downwards, the next stop will be $3370 and there is a high probability of a deeper drop. However, if the price of Ethereum breaks above $4251, this scenario will be invalidated, which is unlikely but not impossible.

Will we see Ethereum rise at the end of this week?I think Ethereum, with a bad start this week, needs a strong price correction to climb back up to $5,000 and exit this multi-day range. If the $4,000 channel is lost, the price will drop to $3,370 and will start its climb from the bottom of the channel next week. Of course, this week, you can open small buy or sell trades, depending on the market risk, according to capital management.

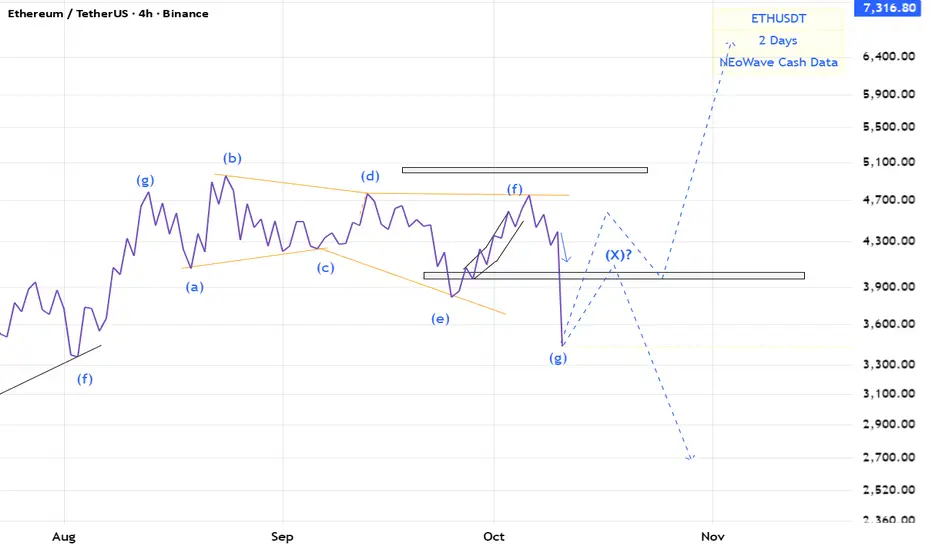
ETH(based on NEo wave)stop loss touched and now there are 2 ways for eth.
we need a post pattern confirmation for bullish wave.
or there is an x wave an correction stills go on.
we never miss bro , all we want is good for the peopledont give laundry and extractor too much power , will you stop buying their bs

ETH -- THE WOLf Hunts Below 3500ETH is chilling above $4150 right now…
but let’s be honest — a dip below $3500 is loading ⬇️📉
Here’s why:
• 🔴 The red zone = where bulls get trapped.
• 🟢 The green zone = where real support should show up.
• 📊 Bitcoin dominance is rising — classic confirmation that altcoins (yes ETH too 😅) are ready to bleed.
So yeah, don’t act surprised when ETH decides to take a little “vacation” under 3500.
Correction isn’t the end of the world… it’s just the market reminding us who’s boss 🐺😉
Support at the 4403.87-4749.30 range is key
Hello, fellow traders!
Follow us to get the latest information quickly.
Have a great day!
-------------------------------------
(ETHUSDT 1D chart)
This period of volatility is expected to last until October 5th.
Accordingly, the key question is whether support can be found around 4403.87 and whether it can rise above 4749.30.
If the price fails to rise,
1st: 3900.73-4107.80
2nd: 3239.06-3438.16
3rd: 2419.83-2706.15
We need to check whether support is found around the 1st-3rd levels above.
-
To break above a key point or range and continue the uptrend,
- The StochRSI indicator must be trending upward. If possible, it's best to avoid entering the overbought zone.
- The On-By-Sign Volume indicator must be trending upward. If possible, it should remain above the High Line.
- The TC (Trend Check) indicator must be trending upward. If possible, it should remain above the 0 level.
You should determine whether the above conditions are met at critical points or ranges and consider a response plan accordingly.
Currently, the StochRSI, OBV, and TC indicators are all showing an upward trend, so we believe the key point of 4403.87 has been broken upward.
However, to sustain this upward trend, the OBV indicator must rise above its High Line, and the StochRSI and TC indicators must maintain their current trend.
Therefore, we can see that support around 4403.87 is crucial.
-
The 4403.87-4749.30 range corresponds to the HA-High ~ DOM (60) range.
If this level is broken upward, a stepwise uptrend is likely, but it is likely to act as resistance.
Therefore, as mentioned earlier, determining whether the conditions for an upward breakout of a critical point or range are met will help you decide how to proceed with your trade.
-
Thank you for reading to the end. I wish you successful trading.
--------------------------------------------------
