ETH drop to 2400 then will up to 5900 ETH based on gib levels and elliot wave theory
Eth price will dip 2400 mid of dec and top will be Q2 2026
Trade ideas

ETHUSDT Chart Analysis 30-Nov-25 The trend in this chart is currently bearish and forming (AB=CD) Bearish Pattern.
Stop Loss: 3655
Sell Stop: 2991
TP1: 2491
TP2: 1994
After Hitting TP2 there will be a (Potential Reversal Zone).
According to my Analysis the market will be Bullish.

Ethereum (ETH) Update | is lower coming? Ethereum has rejected cleanly from a key technical zone and continues to move within an aggressive downtrend. Price is now sitting directly on the $2,800 support region, a level that has historically attracted short-term reactions.
Multiple lower-time-frame candle closes may form around this zone before ETH chooses its next move. The broader high-time-frame range remains intact, meaning Ethereum is still rotating between established highs and lows without breaking structure.
Key Points
- Strong rejection from a major resistance level
- ETH now testing the $2,800 support zone
- Downtrend still dominant with HTF range intact
What to Expect
If $2,800 holds, ETH may see a short-term relief bounce. Failure to hold this level opens the door to deeper corrective targets within the broader HTF range.

ETH 2,422.84 — price not yet reached at time of publication 🏷 Capital Sector. Price Slice.
🏷 December 1, 2025
🏷 ETH 2,422.84 — price not yet reached at time of publication
🏷 BPC 10
🏷 Screenshot:
Time has split space—and revealed a price slice where capital has already affixed its seal.
This level is not a guess. Not a probability. It is a Covenant —a binding commitment inscribed by institutional flows.
ETH 2,422.84 —a coordinate embedded in the market’s architecture long before its visual manifestation.
While the masses search for signals, the sectors remain silent… yet already in motion.
— The Architect
🏷 Interactive Reference Guide: BPC — The Bolzen Price Covenant

Ethereum (ETH) – Downtrend Intact With Key Daily Supports BelowEthereum continues to trade within a clear downtrend (red line) after repeated failures near the $4,000 region. Lower highs remain consistent, and price is currently sitting above a major daily support at $2,635, which has already been tested previously. Until ETH breaks the descending trendline or reaches deeper support, momentum remains bearish.
🔍 Technical Analysis
Current Price: ~$2,822
Recent price action shows:
ETH remains in a short-term downtrend, respecting the descending red line.
A Daily Support at $2,635 continues to act as the nearest major demand zone.
A deeper correction would bring ETH into the greediest support zone at $1,871.
For bullish momentum to return, the downtrend must be broken.
Structure:
Lower highs, clean descending trendline, and two strong daily support zones that offer distinct risk–reward profiles.
🛡️ Support Zones (if pullback continues)
🟢 $2,635.50
▫️ Stop-loss (White Line): $2,453.87
Daily Support — already tested and still the closest area of demand.
🟢 $1,871.00
▫️ Stop-loss (White Line): $1,372.70
Greediest Daily Support — offers the best high-value swing trade setup if reached.
🧭 Outlook
At this stage, the two strongest strategies in my view are:
1️⃣ Long the second support at $1,871 (the greediest level)
This zone offers the best risk–reward setup on the chart and is ideal for swing traders if price reaches it.
2️⃣ Wait for a break of the downward trendline to long
This is the safest confirmation-based approach. A breakout above the red trendline signals a momentum shift and potential trend reversal.
A trader can also long near the already tested support at $2,635, but since this level has been tapped before, it is slightly less attractive than the deeper support or a trend-break confirmation.
Bias:
Moderately bullish if $2,635 holds, more bullish if the downtrend breaks, and strongly bullish if price reaches $1,871.
🌍 Fundamental Insight
Ethereum fundamentals remain strong despite technical weakness:
Continued expansion in Layer 2 ecosystems (Arbitrum, Base, Optimism).
Increasing staking participation reduces circulating supply and supports long-term valuation.
Developer activity and smart contract deployment remain among the highest in crypto.
Near-term price action is heavily driven by overall crypto market sentiment and macro conditions.
✅ Conclusion
ETH is still trading within a defined downtrend, but both $2,635 and $1,871 represent strong support zones for potential long setups.
Traders can choose between early entries, deeper value zones, or confirmation-based breakouts depending on preferred risk tolerance.
If you found this useful, don’t forget to like & follow for more structure-based insights.

ETHEREUM Analysis (12H)A large amount of liquidity has been hunted at the top, which corresponds to the all-time high. After this liquidity was taken, the price entered a bearish structure with strong momentum.
For this bearish structure to reverse or slow down, sufficient liquidity needs to be collected from the lower areas of the chart.
There is a possibility of a temporary rebound from the current levels, but the main reversal should come from the lower zone that we have identified.
We still maintain this outlook on Ethereum in the daily and 12-hour timeframes
Do not enter the position without capital management and stop setting
Comment if you have any questions
thank you

ETH mid-term TAEthereum as well as Bitcoin has stopped the distribution on daily time frame and both may have a relief X-mas rally, but it's too early to confirm yet and it's not a reversal of a downtrend either, the indicators remain in the bearish territory which may result in a short-lived rally. Be cautious of the current high risk. Technically mid-term trend remains bearish.

DeGRAM | ETHUSD held the $2800 level📊 Technical Analysis
● ETH/USD broke out of the falling channel after defending the major $2,700–$2,800 support zone, signalling a shift from corrective structure to early bullish momentum.
● Price is forming higher lows after the breakout and is positioned to retest the upper trendline near $3,100–$3,200 as long as the support zone continues to hold.
💡 Fundamental Analysis
● Crypto sentiment is stabilizing as risk assets rebound, while ETH benefits from renewed inflows into staking platforms and improving network activity, supporting a medium-term bullish outlook.
✨ Summary
● Bullish bias above $2,780. Targets: $3,050 → $3,180. Support: $2,700.
-------------------
Share your opinion in the comments and support the idea with a like. Thanks for your support!

ETH-USDTEthereum always has strong rebounds 🔴
And it is the flagship of all altcoins.
The 3060 resistance has been broken and has turned into an important support 💰💰
Here, it might either make a pullback and then head for 3517 🔼🚨
or go above 3250 and continue the rise towards resistance from here 🚀✔️

ETH 4H – Trendline Rejecting, But Does Price Sweep $2,629?ETH tapped into the 0.5–0.786 Fib retracement zone, directly under the macro downtrend line, creating a strong cluster of resistance. Price rejected both the 50 EMA (yellow) and 100 EMA (purple) on the retest, confirming continuation of the 4H downtrend.
The key downside target is the $2,629 liquidity level, where previous wicks, volume clusters, and demand reactions formed. With Stoch RSI fully overbought and rolling over, momentum supports a move lower unless ETH can reclaim the 50/100 EMAs with a strong impulsive candle.
A break above the trendline would invalidate the short-term bearish structure and reopen targets toward $3,140 – $3,260 (0.5 and 0.618 retraces).
Until then, the path of least resistance remains toward liquidity below.

Ethereum Breakout Done! Let's Go Ethereum has been consolidating inside a curved pattern since mid-November, and despite the recent downside move, the pattern remained valid. Yesterday the market retested the bottom of this curve and finally broke out of it. Now we just need the breakout to hold for the next one or two days to confirm it's not a fake move.
If it sustains, a fresh upside impulse can start — the same move I mentioned on November 15, where I expected Ethereum to target around $6000 in the coming months. Those who lost hope should remember that the market rarely follows emotions; it follows structure. Trust the charts, not the noise.
For more free and timely updates, follow and support the ideas. Thank you.

ETH Wave Trigger: Watch the RSI LineETH is currently approaching a critical technical point, where price action and momentum are aligning for a potential shift. The chart shows price consolidating after a completed structure, while the RSI has been forming a clean descending resistance line for several months.
The most important element here is the RSI structure . Each previous RSI breakout from a similar compression zone has led to strong directional movements. The current RSI position remains near oversold territory, and the descending trendline is now being tested once again. If momentum breaks through this level, it may act as the trigger for the next impulsive wave.
Price is also hovering above the major Fibonacci supports , the 0.618 and 0.786 retracement levels , which historically act as high-probability reversal zones during corrective phases. This confluence between momentum and structural support creates a favourable environment for trend continuation if strength returns.
Key Observations:
• Price is sitting on strong higher-time-frame Fib support.
• RSI is compressing under a long-term descending trendline.
• Previous RSI breakouts have triggered impulsive legs.
• Market structure suggests a potential setup for the next wave (upon confirmation).
What to Watch:
• A clean RSI breakout above the descending line.
• Volume expansion supporting the move.
• Price reclaiming short-term resistance to confirm momentum shift.
In simple terms, ETH is preparing for its next major move, and the RSI breakout is the signal that can ignite the next wave. The setup remains valid as long as price continues to hold above the key Fib zone.

ETH-USDTIt has strong support at 2900, which has held so far 📊🚀. If it goes above the psychological resistance at 3000 dollars, I think the conditions will be set for a rise toward 3174, and the upward path will open up 💰💰🔼🔼

Ethereum (ETH): Expecting Bullish Movement Here | Very BullishETH might be going for a good turnover here if all goes as planned (which includes the breakout of our zone at $3000). For now we had a decent MSB at $2,800, which is holding the ground for now so if buyers manage to maintain the dominance near that region and form the breakout, this is the ideal buy entry.
Although not going to lie, the current zone also looks like a sweet buy area.
Swallow Academy

ETH - Short Update - Next Three MovesAs an update on my ETH Short plan, the following lists the sequence of the next expected movements.
1. SHORT
Entry - 2,895
Stop Loss - 3,000
Target - 1,300
2. LONG
Entry - Wick Bottom expected to be 1,229 - 1,250
Stop Loss - 1,150
Target - 1,750
3. SHORT
Entry - 1,800 to 1,830 (top of retrace)
Stop Loss - 2,000
Target - 250
Happy Trading.
DD

Check if the price remains above 2887.66
Hello, fellow traders.
If you "Follow" me, you'll always receive the latest information quickly.
Have a great day.
-------------------------------------
(ETHUSDT 1D Chart)
The HA-Low indicator on the 1D chart is showing signs of forming at 2887.66.
Since the HA-Low indicator previously formed at 3472.96 and is showing signs of forming again, determining whether support at 2887.66 is crucial.
Furthermore, since the indicator is located near the M-Signal indicator on the 1M chart, we need to see if the price can maintain its upward momentum above the M-Signal indicator on the 1M chart.
In this sense, a rise above the previous HA-Low indicator level of 3472.96 is expected to trigger an uptrend.
Therefore, to ensure that the uptrend continues after breaking above a key point or range, we need to monitor whether the StochRSI, TC, and OBV indicators remain in an upward trend.
Since the OBV indicator has fallen below the EMA 3, it must rise above and remain above the EMA 3 level.
We need to confirm whether the price can rise above the M-Signal indicator on the 1M chart after passing through this volatility period around November 27th (November 26th-28th).
-
Thank you for reading.
We wish you successful trading.
--------------------------------------------------

ETHUSDT Last support zones now are touching As previously outlined in our technical analysis, the price zone between $2,400 and $2,500 represents the final major support level for the current market structure. A decisive breakdown below this critical support confluence would signal a transition into a confirmed bear market, potentially triggering an additional decline of 40% or more.
Conversely, a strong defensive reaction at this level—preferably with bullish reversal patterns and increasing volume—could initiate a sustained recovery. The key confirmation for a bullish scenario would be a reclaim of the $4,000 level, which would indicate a restoration of underlying demand and potentially mark the resumption of the primary uptrend.
DISCLAIMER: ((trade based on your own decision))
<<press like👍 if you enjoy💚

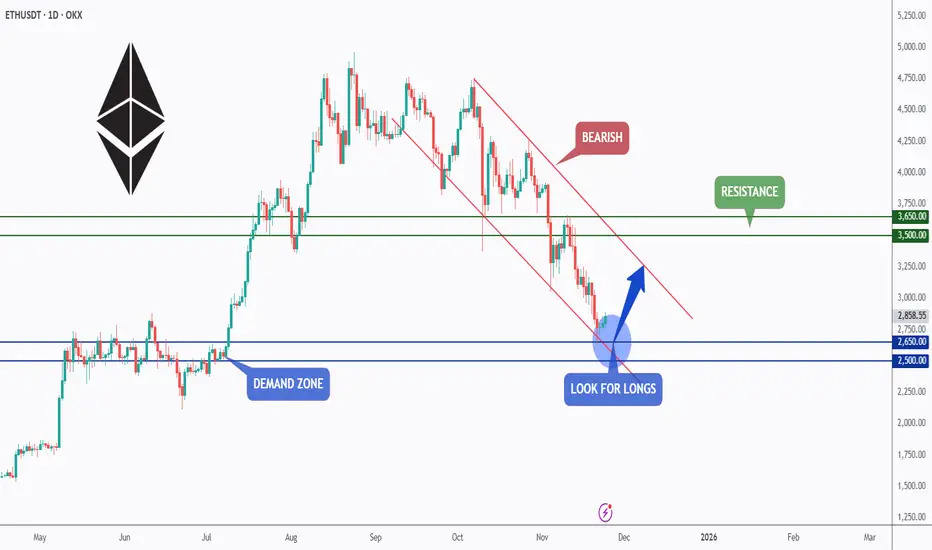
ETH - Demand Zone Meets Channel Support… Correction Loading?⚔️ETH is currently trading around a major demand zone, which lines up perfectly with the lower bound of the falling channel. This intersection forms a strong confluence area where buyers typically step in to absorb the selling pressure.
🏹As long as ETH holds above the $2,500–$2,650 zone, we will be looking for long setups, anticipating a big corrective move toward the upper bound of the falling channel. This would align with the natural rhythm of impulse → correction inside a bearish channel.
If the bulls manage to defend this area, the next targets sit around $3,500–$3,650, which represent the next key resistance levels. However, a break below the demand zone would invalidate the bullish correction setup and open the door for further downside.
ETH is now at a decisive point… will the demand zone trigger the next corrective leg upward? 🤔
⚠️ Disclaimer: This is not financial advice. Always do your own research and manage risk properly.
📚 Stick to your trading plan regarding entries, risk, and management.
Good luck! 🍀
All Strategies Are Good; If Managed Properly!
~Richard Nasr
eth short term eth might be forming wave 4 here expecting a short term bounce around 2700$ level
tp and sl are mentioned in the chart

ETHUSD - D11. Market Context
ETH recently completed a deep corrective phase, following Bitcoin’s pullback.
Price has formed a swing low, showing signs of accumulation and early bullish recovery.
Current behavior indicates:
ETH is moving in sync with BTC’s corrective upward structure.
Buyers stepping in around major support demand zones.
A potential transition from correction → bullish retracement.
2. Key Levels
Major Demand Zone (Support)
$2,800 – $3,050
Strong support where ETH previously accumulated and showed rejection wicks.
Short-term Support
$3,300 – $3,350
Minor pullback zone where price may retest before continuation.
Major Resistance Zones (Targets)
$3,800 – $3,900 → 0.5 Fib retracement of recent decline
$4,150 – $4,250 → 0.618 Fib retracement + previous supply
$4,500 → macro breakout level
These zones are where sellers previously controlled the market.
3. Structure Outlook
ETH appears to be forming a bullish corrective pattern, similar to BTC’s projected D1 structure.
Current Phase
Impulsive rebound from major support.
Next Expected Moves
✔ Move up → reject near $3,800 – $3,900 (first major resistance)
✔ A pullback → retest $3,350 area
✔ Another impulsive leg → target $4,150 – $4,250
This forms a typical A–B–C corrective recovery.
If ETH breaks the $4,250 level with strong volume →
a macro bullish continuation toward $5,000 becomes possible.
4. Mid-Term Bias
Short-term: Bullish retracement
Medium-term: Neutral → depends on reaction at $3,800–4,250
Long-term: Bullish as long as price holds above $2,800 and follows BTC’s upward cycle
5. What to Watch
Reaction at $3,800
Strength of pullback
If ETH forms a higher low on D1 → trend reversal confirmed
If it fails to reclaim $4,000 → deeper correction possible

Ethereum | 3 hrs | Long | +15%This technical analysis is for informational and educational purposes only. It does not constitute financial advice. Remember to always research and consult with a professional before making investment decisions. Good luck! 📈💼🚀

ETH READY TO REBOUNDLooks like ETH just experienced healthy bull run correction on HTF and currently sitting on strong demand liquidity zone. Use Proper Risk Management

Ethereum - new short after range or pullbackEthereum - new short after range or pullback
Price is inside of a down trned
new short better to take after bigger pullback
