eth usdt longCurrently, ETHUSDT on the 4-hour timeframe remains in a broader downtrend, although it is showing a pullback after bouncing from the strong support area around 3,850. The rebound from that level indicates that buyers are stepping in, but for a healthier reversal confirmation, the price needs to break and hold above the 4,200–4,300 zone. Until there is a significant breakout above this resistance, the upward movement can still be seen as a relief rally within the bearish trend. If ETH manages to sustain above 4,120 and successfully breaks 4,200, there is potential for a move toward 4,270–4,300, with further upside to 4,500 if momentum strengthens. However, if the price gets rejected in the 4,200–4,220 area, the risk of another decline is high, with a potential retest of 4,050 and even 3,850. Given this setup, the best approach is to prepare for two scenarios: a buy-on-breakout strategy if price clears the key resistance with strong volume, or a sell-on-rejection strategy if the price fails to break above 4,200.
Trade ideas

Ethereum in the Accumulation Phase | Valhalla is NearEthereum is following a fractal pattern with consistent sizes. According to on-chain data, withdrawals of Ethereum from exchanges to cold wallets are currently very high, which itself is a supply shock. This chart indicates that we are in the process of accumulating Ethereum, and in the medium term, Ethereum can easily reach new all-time highs. Wishing you success.

Ethereum New Update (12H)On the chart, we have a bearish CH and a resistance SWAP zone has formed. This SWAP zone has been broken downward, and now on the pullback to this area, we can look for sell/short positions. As long as the price does not reclaim and hold above this zone, the bearish outlook on Ethereum remains valid
If the price strongly breaks TP1 to the downside, a much deeper drop may occur
A daily candle closing above the invalidation level would invalidate this analysis
For risk management, please don't forget stop loss and capital management
When we reach the first target, save some profit and then change the stop to entry
Comment if you have any questions
Thank You

Never miss Eth on 4160 !I am all eyes on Eth to break my trigger line (around 4230). then the buy setup on 4160 will be activated :)
First midterm target --> 6300

ETH Trade Update📊 Current Setup
My limit long on ETH got triggered with that bullish push we saw at the start of the week. But here’s the play — I closed it out at break-even. No loss, no gain 💯. Why? Because this bullish leg ain’t showin’ me the structure I wanna see. No bearish reversal forming inside this move, so no clean setup yet.
🚦 Next Moves
👉 I’m waiting for a clearer structure to form.
👉 If we get confirmation of a bullish trend reversal, I’ll hop back in long 🌊🚀.
👉 If instead the market sets up a better short structure, I’ll load up there 😈📉.
🧭 My Take
Patience over forcing trades. Right now ETH feels like it’s in “prove it” mode — I’d rather wait for the wave to shape up than wipe out on chop 🤙.
💬 What do you think about this scenario? Only share your idea if you’ve got another opinion — otherwise just hit that button 👍

Ethereum (ETH): Reclaim of Re-Test and 100EMA | Bullish Monday ETH started the week with a bullish tone after bouncing from the 100EMA and reclaiming the breakout zone.
Yesterday’s candle showed clear buyer strength, and today’s continuation keeps the pressure on the upside. As long as this level holds, we are watching for a break of structure on the upper zones — that’s the next step, and after that only a new ATH!
Swallow Academy

Ethereum (ETH): This is Nothing, We Expect Parabolic Movement!This Bullish cycle can't continue without ETH forming new ATH, and seeing all the manipulation near current ATH we are seeing ismilarities with BTC when it had also been forming new ATH.
Anyways, gameplan remains the same, you want it or not, we are going to see a new ATH very soon.
Swallow Academy
#ETHUSDT (4H Chart)#ETHUSDT
(4H Chart)
🔹️ Ethereum Analysis 🔹️
For Ethereum, we have two important resistance levels that could lead to a significant correction:
🔴 Resistances (marked with red boxes):
🎯 First range: 4260 to 4352 USD
🎯 Second range: 4550 to 4635 USD
Supports:
🟡 Yellow box (short-term support): 3525 to 3445 USD — likely to be touched if Bitcoin reaches 100,000 USD
🟢 Green box (main support): 2800 to 2700 USD
💡 Summary:
We expect a small initial rise, then a correction down to the yellow box, and after the yellow box is touched, this analysis will be updated.
🚀 If you enjoyed this analysis, please give it a boost 💙
And to not miss any new analyses or setups, make sure to follow me 📊
🆔️ @Rasoolahmadi

Is ETH Bottomed?
Observations from ETH 4 Hour Charts – 2025-09-28
• ETH is currently in a downtrend
• Key Support is $3945, Key resistance is $4202
• Projected time for trend reversal is early November with the following two Consolidation Ranges (CR): $3945 and $4202 then break and hold above $4200 level.
Warning Sign (Further Dropping)
1). Cannot make new lower lows than $3821.02
Play Strategy
Swing Trader: Trade the ranges.
Long-term Investor: Buy in dip, 20% - 30% buy

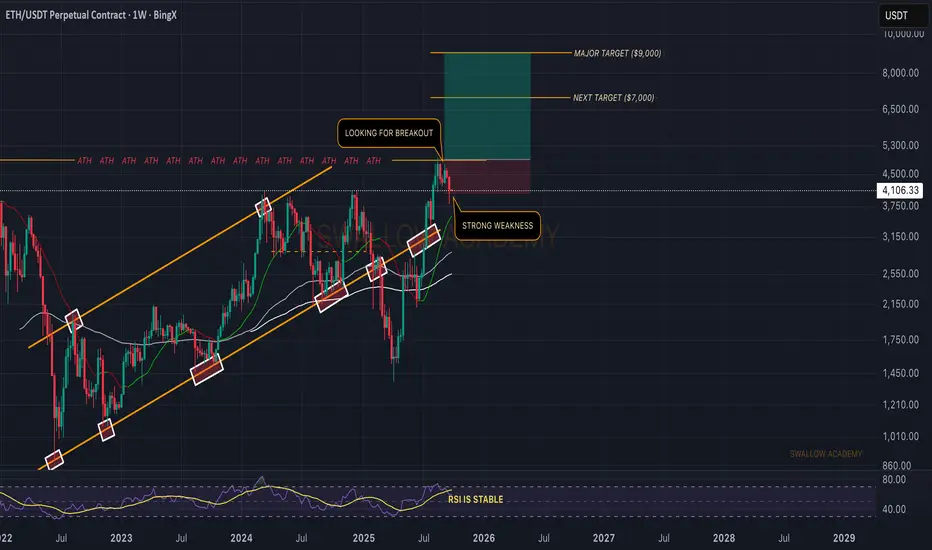
Eth All three corrective patterns in Ethereum have the same shape, with resistance at the top and support at the bottom.
It can be expected that Ethereum might move up to the $7,000 level or to the top of its channel.

$ETH Analysis🚨 CRYPTOCAP:ETH Analysis 🚨
Still waiting for the setup to fully play out 👀
✅ Long plan: sweep of the recent low before entering
❌ Short plan: looking for a bearish reaction at the 4H FVG or bearish OB 🔥
Patience here could pay off big — no need to rush 🚀

The #1 Reason This Is A Strong Support Am currently thinking of the worse case scenario..
What if I fail in business?
What if I face a family crisis? For example the death of a family bread winner
What if Bitcoin or Ethereum or Pepe coin get delisted on the exchange?
Imagine this happens to you when you have borrowed 💰 money
On the price of Bitcoin going up.
Hoping to use that money to support your business or financial independence?
Life is full of challenges and you have to burn the ⛵ boat.
Now don't get reckless and place all your eggs in one basket.Thats foolishness right?
Well that's what I did I placed all my eggs in one basket.Atleast in the beginning.
Why ?
Because diversification is fake..
It doesn't exist.
What matters are systems and strategies.
With out the right mentors you will fall hard this is what happens to the best of us.
The key is to stay cool and fall back on a system.A system you can hang on to.
Ethereum has its faults but if you can trade it with confidence you will be okay.
Especially if you have a hardware wallet to store it in.
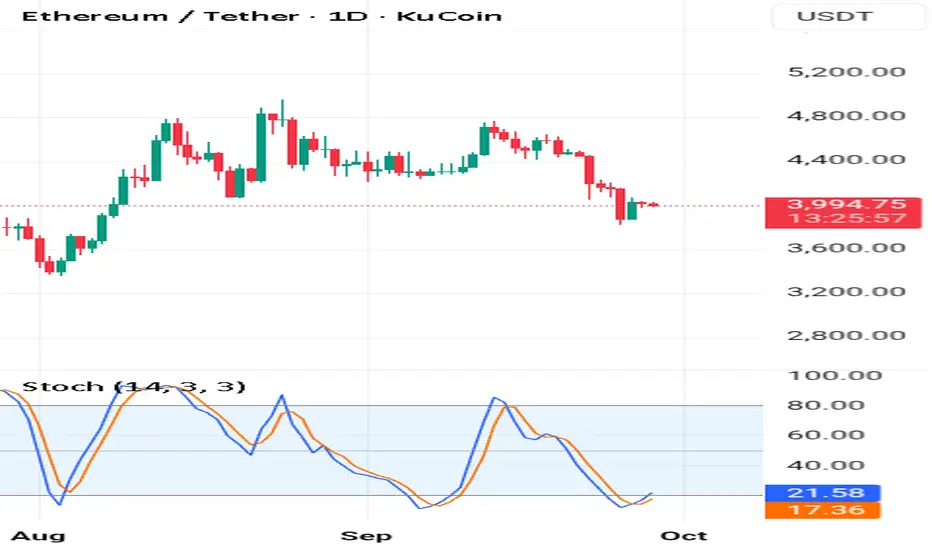
Look at the stochastic the blue line has crossed above the orange line.
Right below level 20 the oversold territory.
This has came after the bullish harami and so far the price is yet to break this support.
The bullish harami support is strong that the reason it's a good buy.
Rocket 🚀 Boost This Content To Learn More
⚠️Warning!!! Don't trade zero day options that expire in one day with high fees for forex trades.
Disclaimer ⚠️ Trading is risky please learn about risk management and profit taking strategies. Also feel free to use a simulation trading account.
ETH Price Action Looks Heavy – Danger Ahead?This chart is showing a clear pattern of accumulation followed by decline. Every time price moves sideways in a box range, instead of breaking upward with strength, it rolls over into another drop.
What this tells us is that the market is using these sideways phases as resting points for sellers to reload, not buyers to take control. Until CRYPTOCAP:ETH can break out of this cycle and hold above one of these consolidation zones, the overall trend remains heavy to the downside.
DYOR, NFA
#PEACEFUL
Follow for more updates and market insights on TradingView

ETH PRZ RANGEEthereum is in an attractive range for demand (PRZ range , fib 0.618 , HD+ , candle pattern...).

ETH Salaam
Just see and share a possible scenario.
ETH could make a bull flag on daily time frame just below the weekly key level of 4,000.
Also in weekly time frame, ETH broke the large triangle to the upside and now retesting, it should build it there is any will to contribute rise!
Look at 4h candle with high volume make it like accumulation.
For now confirmation wait for daily and weekly close above 4k.
Break the bill flag, retest and go for tp1 and 2.
Have great trade
Consider risk management

Liquidity Shift Suggests Extended Bearish CycleThe market is showing a progressive decline after losing upward strength. Recent swings indicate a decisive bearish control, with successive shifts in structure confirming the downward pressure. Attempts to recover higher levels have been shallow, reflecting exhaustion on the buy side and stronger liquidity flow toward sellers.
Market behavior suggests that rallies are being used as opportunities to exit or reposition short rather than initiate sustained bullish momentum. This is consistent with the overall weakening tone across the chart, where volatility spikes have favored downward extensions.
Looking ahead, if the current pace of distribution continues, the market is likely to maintain a bearish trajectory with potential for deeper declines as liquidity seeks out lower price ranges.

ETH Trade Plan 27/09/2025Dear Traders,
📊 Ethereum (ETH) Technical Analysis
As shown on the chart, ETH has broken out of the upper range box and is currently making a pullback.
🔻 If this breakout is not a false trap, we could see a decline toward the key levels of 3700 – 3500 – 3400.
💡 Such a heavy drop would create a strong buying opportunity at lower prices, potentially leading to a new all-time high 🚀.
🟢 Support levels: 3700 – 3500 – 3400
🔴 Resistance: Previous broken box high
Regards,
Alireza!

ETH 4H Analysis - Key Triggers Ahead | Day 28❄️ Welcome to the cryptos winter , I hope you’ve started your day well.
⏰ We’re analyzing BINANCE:ETHUSDT on the 4-Hour timeframe .
👀 On the 4-hour chart, after the recent drop, Ethereum managed to hold above $3,900 thanks to support from its maker-buyer zone. Price is currently trading below a key resistance at $4,034. A breakout and confirmation above this level could lead ETH toward its next major trend-shift resistance.
The primary resistance for initiating a new bullish leg sits at $4,133. A break and stabilization above this zone could trigger a solid upside move, potentially extending toward the $4,800 area.
🧮 The RSI oscillator shows that during the recent sell-off, ETH dipped twice into deep oversold territory, with significant time spent under selling momentum. The key RSI zone now is the 50 baseline, which acts as resistance. A momentum break above this level would support price stabilization over $4,034, and allow ETH to retest and potentially break its resistance on the way to the overbought zone.
🕯 The candle size and volume on the rebound from the maker-buyer support have been reasonably strong, suggesting that ETH has likely established a key floor around $3,837. As price approached the $4,034 resistance, red candles have become smaller — signaling weakening bearish pressure and absorption of sell orders at that zone.
Given the weekend environment, volume has cooled off, and price is moving in a range. With the start of the new week, increased volume could spark a breakout, and trader reaction on ETH may be notable.
💸 The BINANCE:ETHBTC pair is also sitting below a key resistance zone. A breakout and confirmation here could shift ETH’s trading behavior and momentum. On RSI, the pair is around the 50 level, showing reduced volatility due to weekend conditions.
The first key resistance is at 0.03687. A breakout and confirmation above this level could support a long setup on ETH. However, the critical resistance sits at 0.03853 — which aligns with the pair’s overbought potential. Breaking and stabilizing above that level would likely trigger notable bullish continuation, but only if RSI enters the overbought zone as confirmation.
🧠 Since CRYPTOCAP:USDT.D recently rejected from 4.72% and Bitcoin has shown some support, Ethereum now holds a reliable floor that can be used for long setups once the specified resistances break. Two main scenarios are in play:
1️⃣ Scenario 1: We need a higher-timeframe candle close above key resistance, starting with $4,034, which also aligns with RSI’s 50-level resistance.
After that, spotting a multi-timeframe indecision candle could allow an entry with controlled risk.
Upon a confirmed break of the major resistance at $4,133, or signs of trend reversal, additional position size can be added.
Essentially, we require a higher low above $4,034, enabling formation of a higher high and eventual breakout through $4,133.
2️⃣ Scenario 2 : A short on ETH is less favorable due to strong buying interest at current levels and weaker risk-to-reward. However, if price breaks and confirms below the key support and maker-buyer zone, a deeper correction could follow.
❤️ Disclaimer : This analysis is purely based on my personal opinion and I only trade if the stated triggers are activated .

Ethereum Update📊 Current Setup
ETH is retesting a key resistance zone after that bounce, sitting around $4,050–4,100. This pocket’s acting like a supply zone — unless bulls come in stacked with momentum, we’re likely lookin’ at rejection.
🚦 Scenarios
👉 If rejection confirms, ETH could ride down toward the $3,750–3,800 support. That zone’s critical — not just short-term demand, but a big piece of ETH’s long-term trend structure.
👉 If bulls defend hard and flip the zone, we could be lookin’ at the base for a bigger recovery move.
👉 But if that support cracks, the midterm bearish tide deepens 🐻.
🧭 My Take
Right now it’s patience mode. Resistance looks heavy, and a short-term dip from here could be in play — but only with minimum exposure. Protect the bag first, ride the wave second 🌊.
💬 What do you think about this scenario? Only share your idea if you’ve got another opinion — otherwise just hit that button 👍

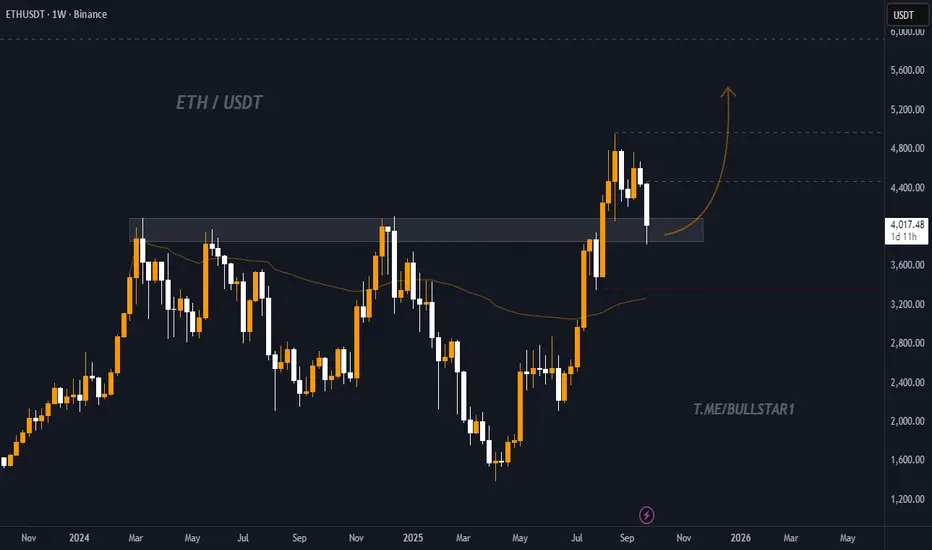
ETH/USDT – Weekly Support Retest Before ContinuationEthereum (ETH) on the 1W chart has pulled back to a key resistance-turned-support zone around 3,800 – 4,000 USDT. This level also aligns with the 50-week moving average, creating a strong liquidity and demand area.
After a sharp rally towards 4,800 USDT, the price is currently correcting and consolidating above support. As long as this zone holds, a bullish continuation towards higher targets is expected.
🔑 Key Idea
As long as ETH holds above the 3,800 – 4,000 USDT zone, upside momentum remains valid.
A breakdown below this level would invalidate the mid-term bullish scenario.
📈 Targets:
Target 1: 4,400 USDT
Target 2: 4,800 USDT
Target 3: 5,200 USDT
⛔ Stop Loss:
Below 3,600 USDT to limit downside risk if support fails.
ETH - 1D Elliott Wave Analysis - 27.09.25Welcome
Our warning of downside risk in the last analysis played out fast.
Here we count the ATH that we made in the last analysis as green and blue Wave 5 and white Wave 3 instead of an overshooting B Wave. Which way you count it doesn't make a difference in the short term and in terms of next targets to the downside.
We assume we are in the white Wave 4 correction which will finish soon within the red ABC. The support area of this Wave 4 is between the 0.236 FIB at 4059 USD and the 0.5 FIB at 3370 USD. We removed the 0.236 FIB from the Wave 4 support to keep the chart clearer.
On the smaller timeframe it looks as if we can go a bit lower in the red Wave C. The next targets for it would be the 1.382 FIB at 3798 USD and the 1.618 FIB at 3653 USD. This is also in confluence if you count the ATH as overshooting B Wave as we did in our last analysis (1.618 FIB target at 3705 USD) and additionally it is close to the 0.382 FIB of the Wave 4 support area which usually is a key support for a Wave 4.
After the correction finishes in the white Wave 4 we expect a rally that should take us above 5600 USD+.
Thanks for reading.
NO FINANCIAL ADVICE.

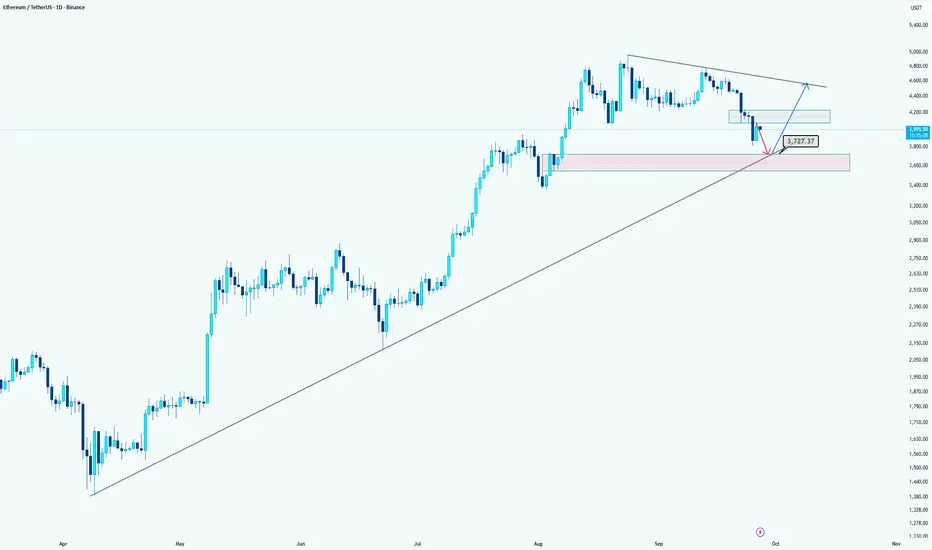
Ethereum: Levels to WatchHi guys!
Ethereum is currently showing weakness after failing to break higher. The price is likely to retest the MPL zone around $3727, which also aligns with the long-term ascending trendline, making it a strong confluence support.
The pink area highlights a potential demand zone where buyers may step in. If the market confirms bullish signals in this area, a long position toward the descending trendline resistance could be considered. However, extra confirmations are recommended before entering long.
Summary:
Short-term target for shorts: $3727 (MPL plus trendline support).
Watch the pink zone for potential long entries, but wait for confirmation.
Let's see what will happen!
ETH target 7100 areaIn my view after a rebound ETH will dump to 3600 area before resuming bullish trend, my target is 7100 area
