Activation trigger: 4h-close > 3977 (KC-Lower recap)Snapshot (last 4h-candle) — with the meaning of each indicator
• Price: ~3910.5 — current base point.
• VWAP (entire period): ~4245.2; z(Price−VWAP) ≈ −2.72 — price is significantly lower than "fair" (by VWAP), deviation is stronger than usual → increased probability of average return.
• aVWAP (anchors): start 4245.2, 60d 4256.0, from swing low 4036.6, from swing high 4020.0 — below swing anchors ⇒ sellers are locally dominant; below global (start/60d) ⇒ the cycle is still under pressure.
• Donchian 20: High 4228.8 / Mid 4025.1 / Low 3821.3 — boundaries of the local trading frame; Mid is often the target of rotation.
• Donchian 55: High 4643.7 / Mid 4232.5 / Low 3821.3 — "higher" range; breaking Mid changes the balance.
• Volume Profile (~60d): POC ~4490.5, VAL ~3627.2, VAH ~4778.2 — we are far below POC, inside the value-area; POC is a "magnet" for returns.
• HVN (volume nodes): ~4275–4420 and 4538–4610 (stable supply/demand zones).
• LVN (thin spots): ~3939, 4059–4107, 3723, 3435–3531 (slippery acceleration corridors).
• RSI(14): ~16.3 — deep oversold; often anticipates a rebound (but not always immediately in a strong trend).
• MFI(14): ~8.5 — oversold, taking into account volume; reinforces the thesis about a technical bounce.
• CMF(20): ~−0.06 — light capital outflow; for a stable reverse, you need ≥0.
• MACD(12/26/9): line −98.6 < signal −85.5, hist. −13.2 — bearish impulse is still active, the histogram is shrinking → impulse weakening.
• ADX/DMI(14): ADX ~63.0; +DI ~3.4 / −DI ~42.8 — very strong downtrend (−DI ≫ +DI).
• ATR(14): ~81.8$ — characteristic 4h swing; used for buffers.
• Keltner: Upper 4285 / Mid 4131 / Lower 3977 — the price is below KC-Lower: statistically, this is the mean-reversion zone to Mid (if the market makes a level recap).
• Bollinger(20,2): Upper 4291 / Mid 4126 / Lower 3960 — below BB-Lower; mean-reversion to 4126 is likely when the trend weakens.
• BB-Squeeze: OFF — no squeeze; volatility is already open.
• z(Price−VWAP) ≈ −2.72 — the "discount" to VWAP is abnormally large → extreme on the selling side.
• OBV z-scores: z50 −1.98 / z100 −2.56 / z200 −2.93, OBV ROC(10) ≈ −0.16 — volume background for the fall (distribution), no fresh influx of buyers is visible.
• Open Interest: ~1.05M, z(168) ≈ −0.07, ROC(5/10) ≈ +0.05/+0.05 — moderate set of positions on the decline (it looks like shorts were added); this strengthens trend continuations, but also creates fuel for short-squeeze at the recap.
Latest divergences (auto-detector)
• RSI: bullish on Aug 18 07:00 → Aug 19 03:00, bearish on Aug 24 03:00 → Aug 24 19:00
• MACD: bullish on Sep 8 19:00 → Sep 9 15:00, bearish on Sep 15 23:00 → Sep 17 07:00
• OBV: bullish 7 Sep 19:00 → 8 Sep 07:00, bearish 15 Sep 23:00 → 17 Sep 07:00
• MFI: bullish 7 Sep 19:00 → 8 Sep 07:00, bearish 10 Sep 15:00 → 11 Sep 07:00
⸻
What does it mean now
1. Mode: an extremely strong downward trend (ADX>60), with RSI/MFI in deep oversold, and the price below KC/BB-Lower and significantly below VWAP → a technical rotation towards the averages is statistically imminent; without confirmation, the market may still "slide along the lower edge."
2. Profile: under the upper HVN and significantly lower than POC ~4490 → KC/BB-Mid (≈4130) and Donch-20 Mid (4025) will act as a magnet on a stable recap round; above is 4232 (Donch-55 Mid).
3. Derivatives: OI slightly ↑ on red bars and OBV-z strongly neg. — downward extensions are possible, but with the first powerful recap, there is a chance for a short-squeeze.
⸻
Key levels
Resistance: 3977 (KC-Lower) → 4025 (Donch-20 Mid) → 4126/4131 (BB/KC-Mid) → 4232 (Donch-55 Mid) → 4285/4291 (KC/BB-Upper) → HVN-cluster 4275–4420 → 4490 (POC).
Supports: 3960 (BB-Lower) → 3939 (LVN) → 3821 (Donch-Low 20/55) → 3723 (LVN) → 3627 (VAL) → 3531/3459/3435 (LVN-pockets).
⸻
Scenarios and triggers (not the financial council)
A) Basic - rotation to the middle (4025 → 4126/4131)
Status: not activated yet (close < KC-Lower).
• Activation trigger: 4h-close > 3977 (KC-Lower recap) and better > ~4018 (KC-Lower + 0.5×ATR, ATR≈81.8), with RSI > 25–30, MFI > 20, hist. MACD↑, CMF → 0.
• Targets: 4025 → 4126/4131 → 4232 on impulse.
• Invalidator: return < 3977 after recap, especially if OI ROC+ is on a red candle and OBV z50 ≤ −2.0.
B) Continuation of the downward trend
• Trigger: 4h-close < 3821 (Donch-Low), ADX ≥ 40, OBV z50 ≤ −2.0, OI ROC+ on the fall.
• Targets: 3723 (LVN) → 3627 (VAL) → 3531/3459/3435 (LVN-pockets).
• Invalidator: fast return > 3977 and hold.
C) Short-squeeze (acceleration up)
• Trigger: impulse break and hold > 4232 (Donch-55 Mid) or > 4285/4291 (KC/BB-Upper) when OI decreases and OBV increases.
• Targets: HVN 4275–4420 → 4490 (POC) → 4643 (Donch-55 High) on development.
• Invalidator: fake breakout with return < 4130.
⸻
Tactics (example of logic)
• Impulse long (on the base): after closing > 4018. Partial fixation at 4025, main fixation at 4126/4131; then, trail to 4232. Stop under 3977 (or local minimum of the recap) with a buffer of 0.5×ATR (~41$).
• Reversal long (conservative): from KC-Lower/BB-Lower 3977/3960 only when demand reacts (RSI/MFI up, CMF→0/+, hist. MACD is shrinking). Targets 4025 → 4130.
• Contra-trend short: on rejection 4126/4131 → 4232 at RSI<50, hist. MACD↓, OI ROC+ — targets 4025 → 3977; stop — over 4235–4240.
⸻
Briefly: what to expect
The basic setup is a technical rotation up (to 4025 → 4130), but it will turn on only after a recap > 3977 / better > 4018.
• We will confirm the recap → a logical move to Mid-am (4126/4131), with strength to 4232.
• We will break through 3821 on a growing OI/weak OBV → continuation down to 3723 → 3627 → 3530+
Trade ideas
ETH Short Update - First Target Hit, Next Targets on their WayETH has successfully dropped from our entry.
First target has been hit, short has fully began and we will see a very fast drop to lower targets.
Good luck and be safe out there.

Ethereum (ETH/USDT, 4H) – Bounce Setup After Textbook Drop In my previous analysis, I highlighted the $4,700–$4,800 zone as a critical resistance cluster. ETH was rejected exactly from $4,720 and dropped sharply to $3,850, just as projected. ✅
⸻
🔎 Current Outlook:
• ETH has now reached the lower boundary of its descending channel.
• Price is sitting right on the $3,850 support zone, where buyers are showing early signs of activity.
• Momentum indicators suggest that the downside pressure may be exhausting, increasing the probability of a relief rally.
⸻
📊 Scenarios:
🔸 Bullish Reversal (more likely):
If $3,850 holds, ETH could rebound toward:
• First target: $4,100–$4,200
• Extended target: $4,400
🔸 Bearish Case (alternative):
A clean breakdown below $3,850 would expose the next demand zone at $3,600–$3,700.
⸻
📌 Conclusion:
After a sharp and accurate rejection from $4,720, Ethereum is now testing strong support at $3,850. Given the confluence of channel support and demand, the odds favor a bounce scenario over continued downside.
ETHUSDTHello every one🖐🏻
Chart is clear , demands area is in the table ,
Entry points for holders and futures traders is on ,( green sign)
Stop loss is under second area 🍌
Good luck and get rich all of you 💵🔥👑

$ETH Bearish Short-Term (September 25, 2025)BINANCE:ETHUSDT
CRYPTOCAP:ETH Strong Bearish Pressure with Oversold RSI Signals
Overall Price Trend: ETH has experienced a sharp decline from recent highs around 4,700-4,800 USDT earlier in the period, now hovering near 3,472 USDT (as labeled on the chart). The recent candlesticks show a series of strong red (bearish) bars, indicating heavy selling pressure in the last few hours. This mirrors broader market weakness, possibly correlated with BTC's drop.
Ichimoku Cloud:The price is firmly below the cloud, a classic bearish setup signaling sustained downward momentum.
Tenkan-sen (red line) is below Kijun-sen (blue line) in a bearish crossover, and the cloud itself is thinning but still reddish and acting as overhead resistance. The Chikou Span (lagging line) is also below price action, reinforcing the downtrend.
RSI (Relative Strength Index): At the bottom panel, RSI is deeply oversold at 21.31—well below the 30 threshold. This suggests the selling has been exhaustive, potentially setting up for a short-term relief bounce. However, in a strong bearish context like this, it often just signals a pause rather than a full reversal.
Volume and Momentum: High volume on the red candles points to aggressive selling, with no immediate bullish divergence. The price is testing potential support around 3,400-3,450 USDT, but the momentum lines (like the blue trendline) are sloping downward sharply.
Summary: The chart remains Bearish dominantly, with the drop accelerating. The extreme oversold RSI adds a layer of caution for a possible pullback, but the Ichimoku setup keeps the bias downward.
Forecast Until Tomorrow (September 26, 2025):Based on the 2H chart, the bearish trend may continue in the coming hours, but with a small chance of rebound due to the deeply oversold RSI.
Here are the possible scenarios:
Base Scenario (Bearish, 75% probability): Price could test lower levels around 3,300-3,400 USDT if selling persists (especially if the cloud remains resistant). This would happen without a positive Ichimoku crossover or a strong green candle, and it's likely if broader market (e.g., BTC) stays weak.
Alternative Scenario (Mild Bullish, 25% probability): A short-term bounce to 3,550-3,650 USDT, if RSI climbs above 30 and price breaks the Tenkan-sen. This would be temporary, without changing the broader bearish trend.
To monitor, watch key levels: Support at 3,417 (recent low), resistance at 3,584 (near-term high). If ETH breaks below 3,400, it could accelerate lower; a close above 3,500 might signal temporary relief.

ETH-bias short Bearish indications:
Trend line support broken
Previous day's closing respected
MA 21 being respected daily and 1 hr
HS pattern in 15 min inside the flag
Bearish flag
AB=CD indcates fall until 3730
Trade plan bias short @ 4127
SL:4222
TP1:4035
TP2:3945
TP3:3863

$ETH Bearish Short-Term (September 24, 2025)BINANCE:ETHUSDT
Summary of Price Action:
Recent Movement: In the last 24 hours, ETH has dropped by about 1.12%, reaching around $4,133 - $4,175 this morning (UTC). This follows a slight recovery from lows near $4,092 on September 22, but it's now retesting support at $4,100 amid strong institutional redemptions. In your 2H chart, we see a series of red candles (bearish) indicating selling pressure, with trading volume increasing during the decline, confirming seller interest.
Key Levels:
Support: $4,100 (immediate level, tested today) and $4,000 - $4,092 as a stronger lower zone. If $4,100 breaks, we could see a drop toward $3,900.
Resistance: $4,180 - $4,200 (strong level with recent rejections). A break above $4,200 would signal recovery toward $4,300.
Volume and Liquidity: 24-hour volume is around $34.8 billion, with large liquidations tied to $141 million in spot ETF outflows over the past day, mostly from institutional longs. This shows smaller traders suffering from bearish pressure.
MACD Indicator Analysis :In the chart you sent, the MACD line (blue) is crossing below the signal line (orange), with the histogram turning more negative (red bars growing). This indicates a bearish divergence – the price is weakening while momentum is losing strength. MACD is below the zero line, confirming a weak short-term trend. RSI (at similar levels) is around 40-50, signaling lightly oversold, but still without strong buy signals.
Overall Trend:
Bearish Short-Term, Bullish Long-TermShort-Term (Today/Next Day): Bearish.
The price is consolidating in a bearish channel, with predictions for further downside toward $4,000 - $4,092 today or tomorrow, due to fear sentiment and pressure from ETF outflows. This matches your chart, where we see a potential descending triangle pattern (but still uncertain). Avoid immediate buys – wait for confirmation below $4,100 for shorts or above $4,180 for longs.

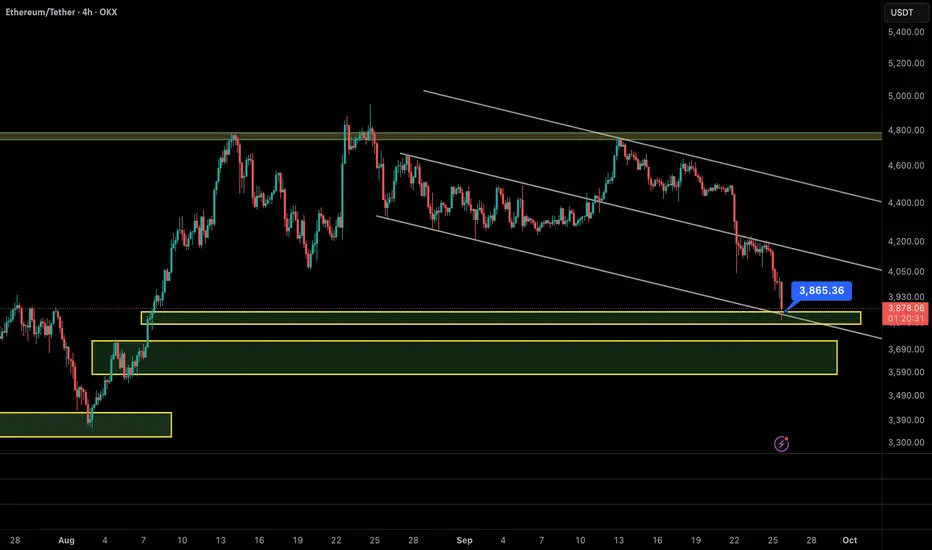
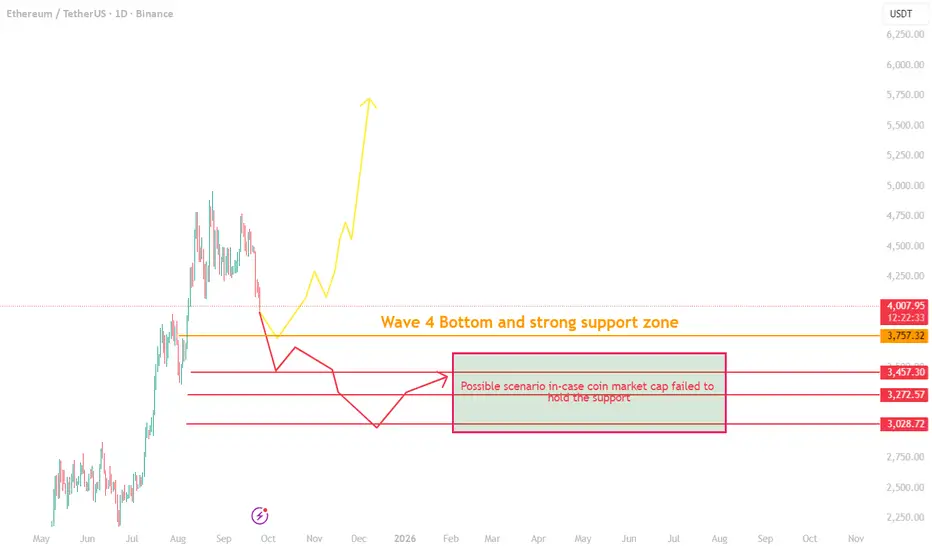
ETH Crash or Bounce? The Critical Level Everyone Is WatchingEthereum (ETH/USDT) – Critical Support Test Ahead
Ethereum is currently under pressure after breaking below the $4,000 support. The next significant level to watch is the $3,760 zone, which is not only a strong technical support but also aligns with the Elliott Wave 4 bottom as well as a key Fibonacci retracement area.
Key Scenarios
1. Bullish Recovery (Primary Expectation)
If ETH holds above the $3,760 support, we can expect consolidation in the range of $4,000 – $4,350.
This zone is likely to act as a base for Ethereum until broader market conditions stabilize.
Once momentum returns, ETH has the potential to resume its upward trend.
2. Bearish Breakdown
If ETH fails to defend $3,760, then deeper downside levels may come into play:
$3,450
$3,270
$3,000
This would represent a sharp and aggressive downturn. While possible, this remains weak scenario, given how violent the move would be.
Why the Answer Lies Outside ETH’s Chart
The real driver here isn’t just Ethereum—it’s the total "crypto market cap excluding BTC" as I have warned 2 days ago that's it's falling into a correction
The altcoin market cap is currently in correction as capital flows back into Bitcoin dominance, which has already broken its downtrend line and reached today 59%.
If the altcoin market cap holds its critical support and BTC dominance starts dropping, we can expect a broader bullish recovery across altcoins, with Ethereum following.
If that support breaks, then the weaker bearish scenario may unfold.
Conclusion
For now, the $3,760 support remains the critical line in the sand. Holding it keeps Ethereum within a bullish recovery path. Breaking it could open the door to deeper corrections.
Critical Moment for ETH – Support or Breakdown?Ethereum is sitting on the key $4,000 level with strong downward momentum. The big question: will this support hold or break? I’ve been saying for a while that $3,500 is still on the table.

ETH Pullback before ATH and AltseasonOver the past few months, ETH has been a beast. Now it needs to cool off before it can push to higher highs, igniting the broader altcoin market and the long-awaited "altseason."
Coinciding with an oversold RSI, I anticipate that we will see a "sell the news" event for next week's FOMC announcement on 9/17. This aligns with historic seasonality of September being a bearish month.
My forecast is that we pull back to the $3,900-$3,500 zone (.618 fib and 21 week EMA confluence) before pushing to higher highs.
IF ETH holds above $5k with volume, this will allow the broader altcoin market to pump, attracting massive liquidity to close out Q4 in euphoria.
Happy trading,
Melonfarmer

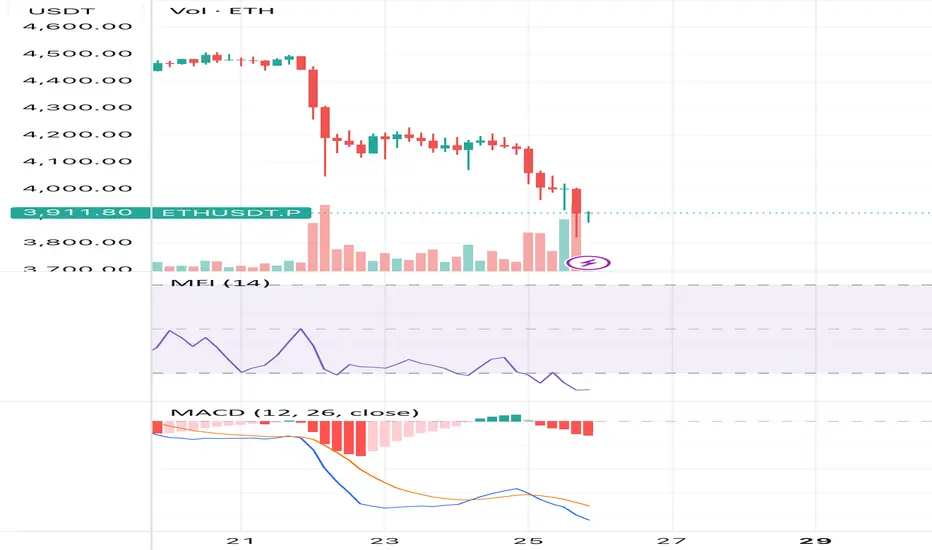
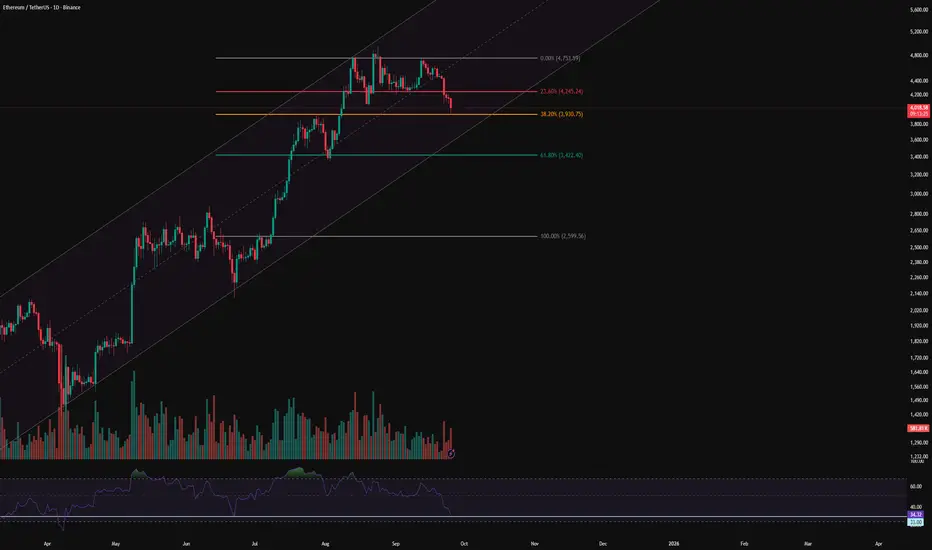
ETH 1D Analysis - Key Triggers Ahead | Day 27❄️ Welcome to the cryptos winter , I hope you’ve started your day well.
⏰ We’re analyzing ETH on the 1-Day timeframe
👀 On the daily timeframe we observe that Ethereum is trading inside a strong ascending channel. Currently, after touching the channel top, price moved toward the midline, lost the midline, and is now heading toward the channel bottom. Ethereum reacted once at the 38% Fibonacci zone, but selling pressure is increasing, and with losing this support level around $3,930, ETH can move toward the channel bottom and even lower support levels.
🎮 The Fibonacci retracement is drawn from the $2,600 breakout area up to the all-time high of Ethereum, which clearly covers all the support and resistance zones. At this stage, Ethereum has reacted to the 38% Fib level, but with losing this area it could move toward the key support overlapping with the channel bottom. The 38% zone observed in this analysis has high validity in daily price action, and with breaking this area we can open a short position.
🧮 Looking at the RSI oscillator, after creating a new all-time high, Ethereum entered selling pressure and is now near its oversold area. Our key RSI zone is also located here. With a cross below 33, Ethereum could experience a deeper correction and fully enter the oversold range.
🕯 The size and volume of red candles for breaking Fibonacci zones usually happen in a whale-driven manner. Normally, before the move, one or two opposite stop-hunts with shadows (wicks) appear, and then the move continues. The recent candles Ethereum has formed show strong selling volume, and candle closes below the 38% Fib zone together with selling pressure can bring even more red candles.
🧠 For an Ethereum position, it seems better to wait until whales and sharks of the market finish their stop-hunts. On the third touch, for example, with a break of the 38% Fib zone and entry of ETH into the oversold RSI area, we can open a sell position.
💡 Keep in mind that today the U.S. labor market has strengthened significantly, and there may be no signal of upcoming rate cuts in the next Fed meetings.
❤️ Disclaimer : This analysis is purely based on my personal opinion and I only trade if the stated triggers are activated .
Ethereum (ETH): Back Near $4000 | Huge Shakeout Going OnETH has had a nasty fall since breaking the long trend holders' EMAs. Since then we were looking for a reclaim of EMAs but what happened was the price bottomed at $4000, which is a strong support zone!
Every indicator is telling us the ETH is oversold and so we are looking for some kind of bounce to happen anytime soon, which would lead to a retest of EMAs, and then most likely back above them and movement to a new ATH!
Swallow Academy

ETH - First Key TestHere is a link to our last post:
We were seeing some market structure be build with three different bottoms come in around the $4,060 level.
However, last night those lows were breached which lead us to our first test of the macro support range.
This area ranges from about $3,700 to $3,950. It is very important as it was a level of resistance for many years and we would like to see the market establish this area as a new level of support. If this is established the trend will be intact to push toward highs.
We just saw the first test and bounce from the top of the box at $3,950. Will be key to monitor how the market reacts to this price action and will be looking for any further bottom developments in this macro support range.

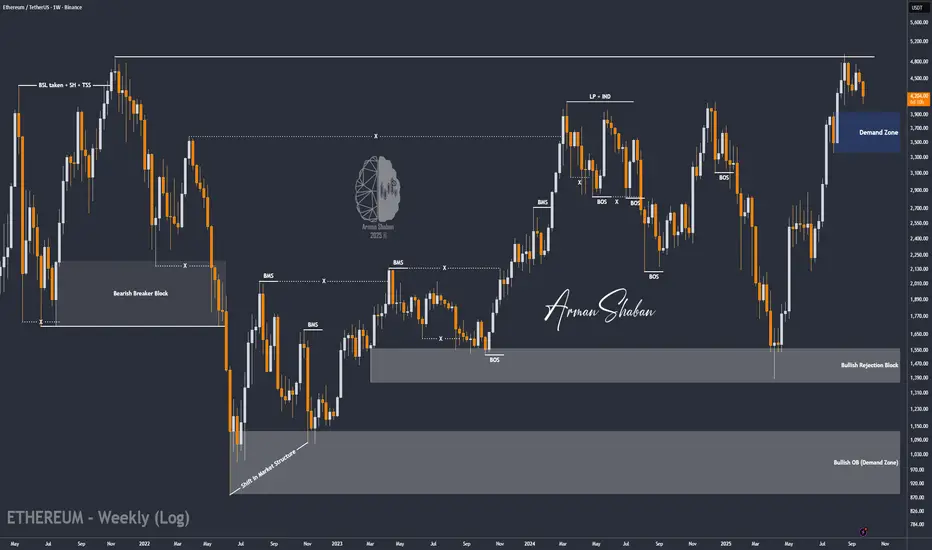
ETH/USDT | Correction Over? Big Rally Loading After Demand ZoneBy analyzing the Ethereum chart on the weekly timeframe, we can see that after Bitcoin’s heavy dump , ETH also corrected and is now trading around $4,200 .
Based on the previous analysis, the $3,300–$3,900 zone is still a key demand area. If the price enters this zone, I expect Ethereum to start its next bullish wave.
The possible upside targets for this rally are $5,100, $5,500, and $6,000.
Please support me with your likes and comments to motivate me to share more analysis with you and share your opinion about the possible trend of this chart with me !
Best Regards , Arman Shaban
ETH$ in uptrend ch ?!Ethereum is in an ascending channel, but it's undergoing a correction. The bottom of the channel, marked in orange, is an important point. Additionally, the green box indicates a key area that aligns with the weekly Fibonacci zone, as well as the 200 EMA. This is very significant and could lead to a price increase.

$ETH shows bullish hidden RSI divergence.A **bullish hidden RSI divergence** is a trading signal that suggests a continuation of an upward trend, often indicating that the price will keep rising. It occurs when the price action and the Relative Strength Index (RSI) show a specific pattern. Here's a simple explanation of how to identify and trade it:
### Step 1: Understand the Pattern
- **Price Action**: The price makes **higher lows** (each low point is higher than the previous one), indicating an uptrend.
- **RSI**: The RSI makes **lower lows** (the RSI is declining while the price is not), showing a divergence from the price trend.
- This mismatch suggests that the uptrend is still strong, and the dip in RSI is just a temporary slowdown in momentum, not a reversal.
### Step 2: Identify the Divergence
1. **Chart Setup**: Use a price chart (e.g., candlestick chart) with the RSI indicator (typically set to 14 periods) on a platform like TradingView .
2. **Spot Higher Lows in Price**: Look for a price chart where the recent low is higher than the previous low (e.g., $100 to $105).
3. **Check RSI for Lower Lows**: At the same time, check if the RSI is making a lower low (e.g., RSI drops from 50 to 45 while price makes a higher low).
4. **Confirm the Uptrend**: Ensure the overall trend is bullish (price is generally moving up with higher highs and higher lows).
### Step 3: Trading the Bullish Hidden RSI Divergence
1. **Entry Point**:
- Enter a **buy** trade when you confirm the divergence and see the price starting to rise again after the higher low.
- Look for additional confirmation, like a bullish candlestick pattern (e.g., a hammer or engulfing candle) or a break above a resistance level.
2. **Stop Loss**:
- Place a stop loss below the most recent higher low to protect against a potential trend reversal.
- For example, if the higher low is at $105, set the stop loss slightly below, like $103.
3. **Take Profit**:
- Target a take-profit level based on previous highs, support/resistance levels, or a risk-reward ratio (e.g., 1:2, meaning you aim for twice the profit compared to your risk).
- For instance, if your stop loss is $2 below entry, aim for a $4 profit target.
### Step 4: Manage the Trade
- **Monitor RSI**: Ensure RSI doesn’t drop into oversold territory (below 30) or show signs of a bearish reversal.
- **Adjust Stop Loss**: As the price moves up, consider trailing your stop loss to lock in profits.
- **Exit Strategy**: Exit the trade if the price hits your target, or if you see signs of a trend reversal (e.g., a bearish divergence or break of key support).
### Example
- **Price**: Stock XYZ makes a low at $100, then a higher low at $105.
- **RSI**: RSI drops from 50 to 45 during the same period.
- **Action**: You enter a buy trade at $106 after a bullish candle. Set a stop loss at $103 and aim for a take-profit at $110 (1:2 risk-reward).
- **Outcome**: If the price continues its uptrend to $110, you take profit. If it drops below $103, you exit with a small loss.
### Tips
- **Timeframes**: Use higher timeframes (e.g., 1-hour, 4-hour, or daily) for more reliable signals.
- **Confirmation Tools**: Combine with other indicators like moving averages or trendlines for stronger signals.
- **Practice**: Test this strategy on a demo account before using real money to understand how it works in different market conditions.
- **Risk Management**: Never risk more than 1-2% of your trading account on a single trade.
This strategy works best in trending markets, so always confirm the broader trend before trading.

Ethereum $ETH similar price action to late JuneIt's not perfect look to see CRYPTOCAP:ETH losing the daily range
However, the current PA oddly reminds me of one from late June
RSI and AO are similar as well
The next few days will be interesting to see if they are trying to scare the paper hands before the generation run, or the generational run is getting postponed for now

ETH Long-Term Outlook📊 Current Setup
ETH just cracked down from consolidation and is now sliding toward that $3750–$4000 pocket 📉. This zone’s a straight-up make-or-break spot for the long-term trend — no cap.
🚦 Scenarios
👉 If price taps the zone and rejects strong (big wicks, strong closes, volume surging) 🔥 — ETH could gear up for a bounce that not only reclaims upper ranges but maybe even pushes toward fresh ATHs 🚀.
👉 If the zone cracks and we consolidate under it, that’s a midterm bearish flip 🐻, and the market could stay heavy for a while.
🧭 My Take
No clean setup to ride yet. Patience is key — the next few candles and ETH’s reaction to the $3750–$4000 zone will lay it all out.
This is one of those levels where legends get made, fam. Either we catch the next monster wave 🌊, or we sit tight and protect the bag until the tide shifts. Stay locked in 💯.
💬 What do you think about this scenario? Only share your idea if you’ve got another opinion — otherwise just hit that button 👍

ETH Check-In📊 Current Setup
ETH just slipped outta the box and is cruisin’ down toward that $3750 zone 🩸. That spot’s stacked with weight — if it holds, we might see the tide flip from bull vibes to bear mode 🐻.
🚦 Scenarios
👉 If $3750 catches and sticks, could be a minor pivot point worth watchin’.
👉 If it cracks clean, ETH might surf lower before bulls even think about comin’ back.
🧭 My Take
Right now? No clean setup. Best play is to sit tight, let the dust settle, and wait for the next wave 🌊. Patience prints 💯.
❓ What’s Your Read?
Does $3750 hold the line, or are we about to see ETH dive deeper? Drop your vibe below 👇

ETHUSDT #009 (Be careful, need 15-20% correction for next cycleHello dear traders.
Good days.
First of all thanks for your support and comments.
————————————————————————
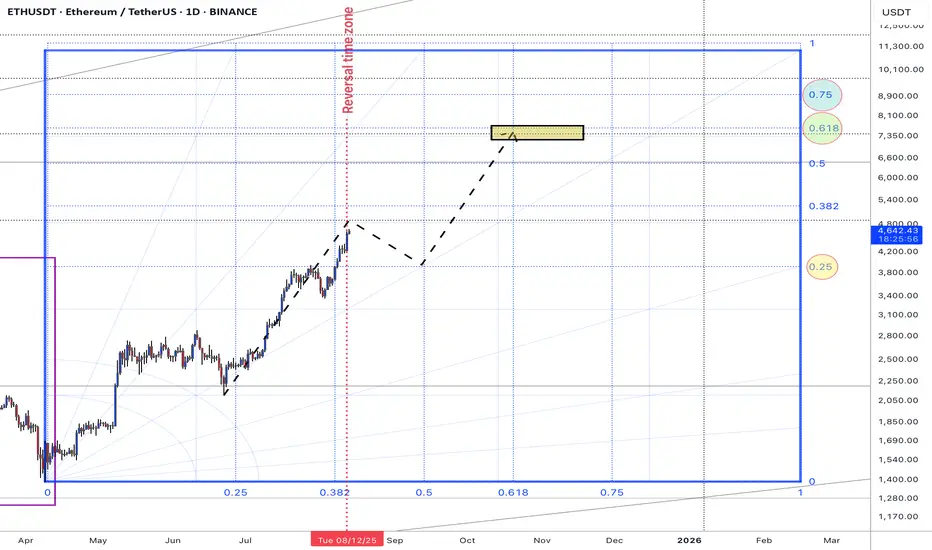
On daily Gann Square ETHUSDT break out 0.5 Gann Square price zone and with good strength trend line support it expected to fill 0.618 Gann box price level at exact reversal time zone .
So be careful and do not be FOMO . expected to grow up to 4800$ and correct 15-20 % correction for retest 0.5 Gann price zone .
If support at 3940-3915 $ will grow up fro next bull cycle .
BTC Dominance is mached also at exact time with ETHUSDT .
Weekly overview of ETHUSDT Chart will updated.
Good luck and safe trades.
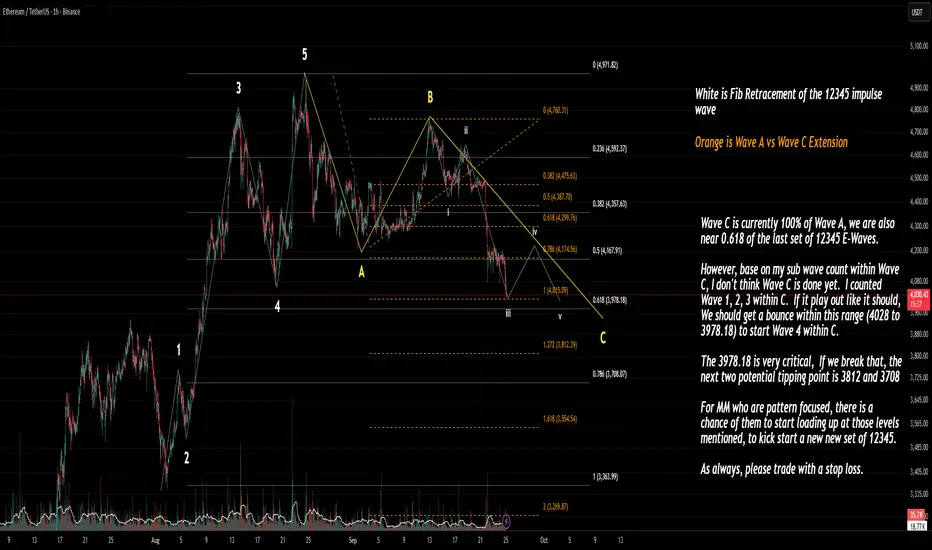
Elliott Wave Ethereum / Fibonacci LevelWave C Progress:
Wave C has already reached 100% of Wave A.
Price is sitting near the 0.618 retracement of the previous 12345 impulse wave.
Subwave Count Inside Wave C:
I have counted Waves 1, 2, 3 inside C.
If this sub-count is correct, a Wave 4 bounce is expected soon in the 4028 – 3978 zone.
Critical Levels
4028 – 3978.18: Expected bounce range (Wave 4 inside C).
3978.18: Key level — breaking it opens the door to deeper downside.
If broken, the next supports are:
3812 (1.272 extension)
3708 (0.786 retracement of entire impulse)
Implications
If 3978 holds, ETH may stage a corrective bounce (Wave 4) before a possible Wave 5 inside C.
If 3978 fails, 3812 and 3708 are the next tipping points where market makers/pattern traders might start accumulating for a new 12345 impulse set.
Watch for a bounce between 4028–3978.
Lose 3978, and 3812/3708 become the big decision zones for the next move.
#ETH Bullish Head and Shoulders, Beware of a Rebound 📊 #ETH Bullish Head and Shoulders, Beware of a Rebound ⚠️
🧠From a structural perspective, we've found support at the weekly neckline support area, forming a bullish head and shoulders pattern, suggesting the possibility of a further rally.
➡️Note that we're currently near the 4-hour neckline resistance area. While further gains are possible, be wary of the risk of a pullback. Therefore, consider a small number of long trades. If a pullback occurs, buy again near the next support level of 4100.
🤜If you like my analysis, please like 💖 and share 💬
BITGET:ETHUSDT.P

This Volatility Period:Around September 24th(September 23rd-25)
Hello, traders!
Follow us to get the latest information quickly.
Have a great day!
-------------------------------------
(ETHUSDT 1D Chart)
This Volatility Period: Around September 24th (September 23rd-25th)
Before this volatility period began, the price fell below 4403.87 and then fell to the 3900.73-4107.80 range.
The 4403.87-1749.30 range, which corresponds to the HA-High ~ DOM (60) range, is likely to act as resistance, as it represents a high point.
The 3900.73-4107.80 range represents the previous all-time high (ATH). If the price remains above this range, the uptrend is likely to continue.
Therefore, the key question is whether the price can find support in the 3900.73-4107.80 range and rise above the 4403.87-4749.30 range.
After this volatility period, we should examine whether the price can find support in the 3900.73-4107.80 range.
If not, support around 3265.0-3438.16 is crucial.
-
If the OBV indicator falls below the Low Line, the price is likely to decline again.
Therefore, support around 3900.73-4107.80 is crucial.
-
The basic trading strategy is to buy in the DOM(-60) ~ HA-Low range and sell in the HA-High ~ DOM(60) range.
Considering this basic trading strategy, it may be natural for the price to decline since it failed to rise above 4403.87-4749.30.
Since it fell in the HA-High ~ DOM(60) range, it is likely to decline until it meets the DOM(-60) or HA-Low indicator.
However, since important support and resistance points or zones have formed, the trend can reverse at any time depending on whether support is found at those points or zones.
In this sense, the K value of the StochRSI indicator is in the oversold zone, suggesting a potential uptrend in the near future.
While the K value of the StochRSI indicator is in the oversold zone, the possibility of further decline is high. However, the established support and resistance zones increase the likelihood of turning this crisis into an opportunity.
In this situation, what we can do is confirm the signs of an uptrend.
Otherwise, if we anticipate a new trade in advance, we may face another crisis as the volatility period progresses.
-
If you are currently trading, there is an opportunity to sell in the first installment when resistance is encountered in the 4403.87-4749.30 zone.
As mentioned earlier, this is based on the basic trading strategy.
Depending on whether support is found in the 3900.73-4107.72 range, you'll decide whether to sell in two installments or buy.
Since the stock market trades in single-share increments, selling before the price has more than doubled from the purchase price makes it difficult to buy again.
However, the coin market allows for decimal trading, making trading easier than in the stock market.
This freedom of buying and selling is the biggest advantage of the coin market.
If your buy price is below 3900.73, buying when the 3900.73-4107.80 range shows signs of support will increase your average buy price, potentially putting you under psychological pressure.
However, as mentioned earlier, the coin market allows for decimal trading, making it possible to separate your buy price into separate trades.
Therefore, you can record the purchase price and purchase amount separately, differentiating them from the existing average purchase price, and then trade them separately.
If you understand this principle, you'll find the coin market much easier to trade than the stock market.
This is one of the reasons why even those who have successfully traded in the stock market often fail in their initial trading in the coin market.
-
Thank you for reading to the end.
I wish you successful trading.
--------------------------------------------------
- Here's an explanation of the big picture.
(3-year bull market, 1-year bear market pattern)
I'll explain more in detail when the bear market begins.
------------------------------------------------------
