ETH *UPDATE*Hello friends
Given the channel breakdown and the entry of buyers, it now seems that the price is in a pullback. In this case, the price pivots of the channel, which are now becoming supported, are expected to be good support and cause the price to grow and move with it to the specified targets.
*Trade safely with us*
Trade ideas

Ethereum price pullback before Fed rate cutsWith the FED rate cuts just around the corner. The market is screaming bullish and euphoric. I do see this $4,200-$4,300 level being tested before moving higher during or after the cuts are announced.
Could we see a buy the rumour and sell the news event?

Long ETHUSDTHello traders!
After a succesful break above resistance, I'm looking for this scalp long.
Don’t forget to like and share your thoughts in the comments! ❤️

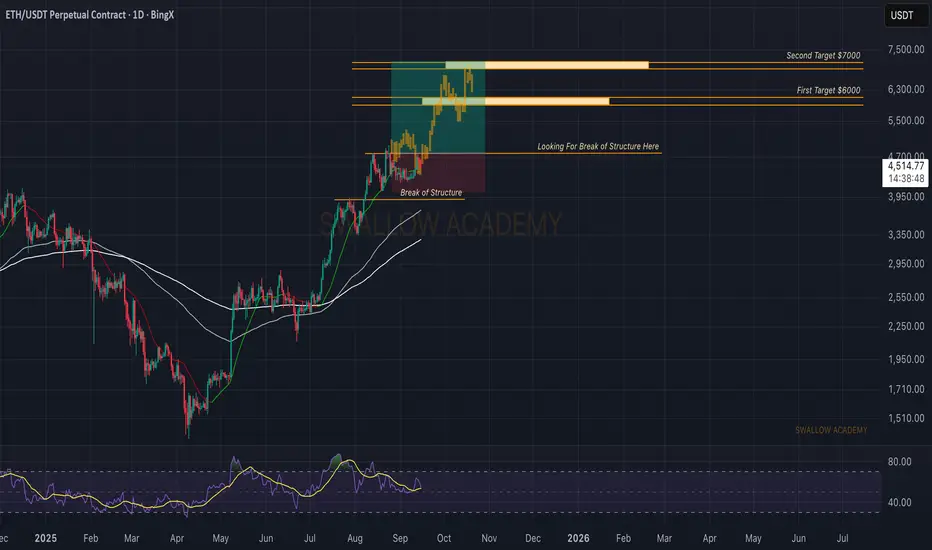
Ethereum (ETH): Looking For That Break of Structure | Bullish AFETH is still waiting for that break of structure, and once it happens we are going to be looking for a push into new ATH levels. Monday came with a bloody move, but for now it looks nothing more than a shakeout before buyers step back in and take control.
Swallow Academy
ETH/USDTI think wave B is in the form of a completed triangle for wave C, so I will open a short position with this setup.

Ethereum (ETH): About To Explode | Very BullishGameplan remains the same, we wait for a break of the local high. Buyers keep the momentum, and once that breakout happens, we look for a strong move to the upside. First target sits at $7K, with $9K as the major one.
Swallow Academy

#ETHUSDT 4H ChartPrice previously reached the 4h supply zone where it got rejected perfectly as predicted. MACD is currently showing bearish indications, RSI is neutral and EMAs are bullish. Mix indications overall, but price is currently expected to tap into the 4h demand zone at around $4,450 before potentially continuing its bullish movements.

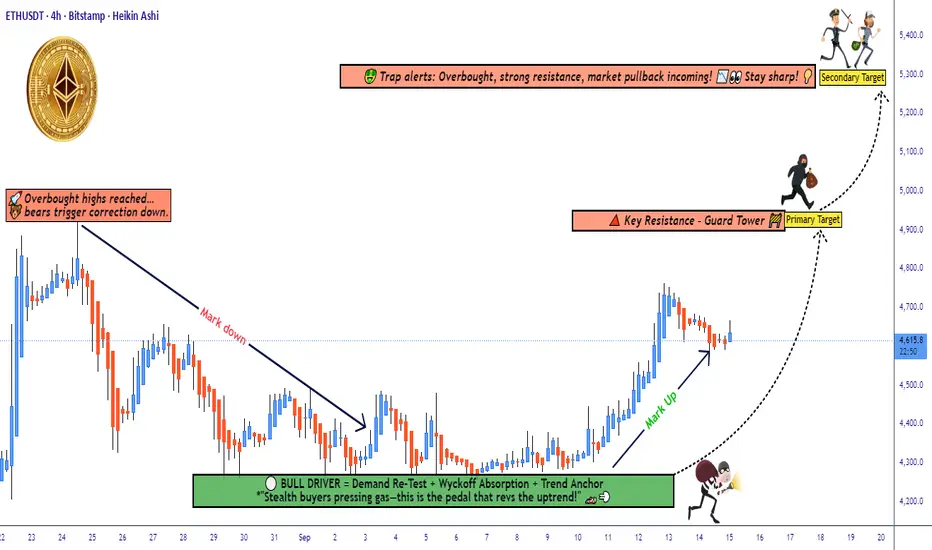
ETH/USDT Technical Outlook: Demand Layer Entries vs Trap Risk🚀 ETH/USDT | Ethereum vs Tether 💎
Crypto Market Money Looting Plan (Swing/Day Trade)
📌 Trade Plan (Bullish Outlook)
Setup: Demand Re-Test ✅ + Wyckoff Absorption 🔑 + Trend Anchor ⚓ (buyers confirmed presence)
Entry Style (Thief Layers 🪙): Using layered limit entries — examples: 4500, 4550, 4600, 4650 (you can add more layers as per your own method).
Stop-Loss (Protect the Vault 🔒): Example zone near 4400 after breakout. Adjust SL to fit your own risk appetite & personal strategy.
Target 🎯:
🎯 Primary: 4900 (local resistance)
🎯 Secondary: 5300 (major resistance / overbought zone)
🧾 Notes for Thief OG’s
This plan is not financial advice, only an idea. Always manage your own entries, SL, and TP.
Think of it as a vault strategy: take money, then protect money.
🔗 Related Pairs to Watch
BINANCE:BTCUSDT → ETH often follows BTC’s momentum. A BTC breakout/false move can affect ETH.
BINANCE:ETHBTC → Good pair to confirm ETH’s relative strength vs BTC.
BINANCE:SOLUSDT & BINANCE:BNBUSDT → Correlated majors; watch for rotation of capital in altcoins.
✨ “If you find value in my analysis, a 👍 and 🚀 boost is much appreciated — it helps me share more setups with the community!”
#ETH #Ethereum #Crypto #USDT #Altcoins #SwingTrade #DayTrading #LayerStrategy #Wyckoff #ThiefPlan #TradingView #CryptoTrading
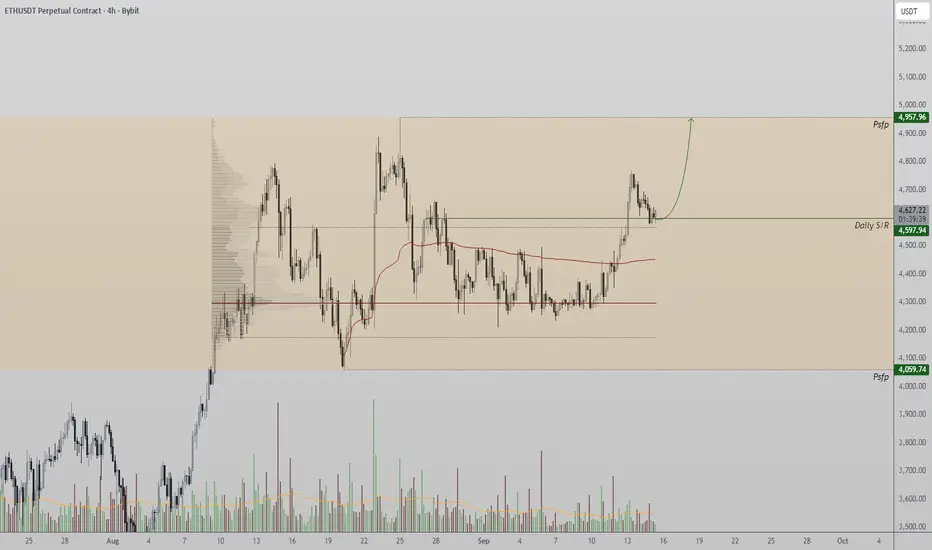
Ethereum - follow the plan Ethereum - follow the plan
new long after a local range
1st target 4957
full TP - 5393

Ethereum Retests Support and Eyes Higher ObjectivesETH price action has recently pivoted from key daily support, maintaining the broader uptrend. With structure intact and value area high reclaimed, buyers continue to show dominance.
Key Technical Points:
- Daily support at $4,600 has held.
- Value area high reclaimed as support.
- Potential upside target sits at $4,950.
The $4,600 level has proven to be a crucial foundation for Ethereum. After multiple tests, this region continues to hold as buyers defend it, creating conditions for a push higher. The bounce coincided with a reclaim of the value area high of the current range, a technical signal that suggests acceptance above prior supply.
Price structure remains bullish, with ETH printing consecutive higher highs and higher lows. This reflects healthy market dynamics and increasing demand. Importantly, each consolidation has been absorbed efficiently, leaving ETH primed for continuation.
If momentum persists, the $4,950 level is the next logical target. This region represents not just a technical objective but also an area where previous sellers might attempt to defend.
What to Expect in the Coming Price Action:
As long as ETH trades above $4,600, buyers retain control. Continuation toward $4,950 remains probable, with invalidation only if $4,600 breaks on strong volume.
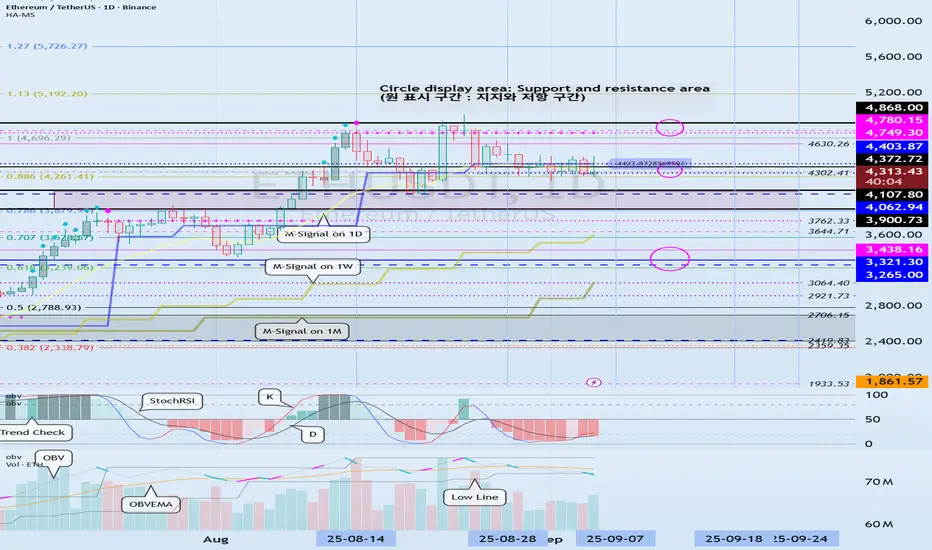
Volatility Period: Around September 7th (September 6th-10th)
Hello, traders!
Follow us to get the latest information quickly.
Have a great day!
-------------------------------------
(ETHUSDT 1D Chart)
This volatility period is around September 7th (September 6th-10th).
After this period of volatility, the key question is whether the price can find support and rise above the 4403.87-4749.30 level.
-
To continue the cascading upward trend, the price must rise above 4749.30.
Therefore, we need to monitor whether the price maintains above the 4749.30-4868.0 level.
-
If resistance is encountered at 4403.87 and the price declines, it is likely to decline until it meets the HA-Low indicator.
Therefore, we need to check for support around 4302.41-4403.87.
However, there is a possibility of a rise after touching the previous all-time high (ATH) range of 3900.73-4107.80, so we need to consider a response plan.
If the price falls below 4107.80, it is expected to touch the M-Signal indicator on the 1W chart and resume the trend.
-------------------------------
The On-By-Signal (OBV) indicator is falling below the Low Line.
The TC (Trend Check) indicator is below 0.
The K value of the StochRSI indicator is showing signs of rising from the oversold zone.
If the High Line of the OBV indicator falls and forms a downward channel, it is highly likely that selling pressure will continue to dominate, so caution is advised when trading.
Therefore, the key issue this time is whether support is found around 4302.41-4403.87.
The TC (Trend Check) indicator is a comprehensive evaluation of the StochRSI, On-By-Signal (OBV), and PVT-MACD Oscillator indicators.
Therefore, if the TC indicator is below 0, selling pressure is dominant, and the price is likely to decline.
If the K value of the StochRSI indicator continues to rise, the price is likely to rise after this period of volatility.
However, for the uptrend to continue, the OBV and TC indicators must show upward trends.
-
Thank you for reading to the end.
We wish you successful trading.
--------------------------------------------------
- Here's an explanation of the big picture.
(3-year bull market, 1-year bear market pattern)
I'll explain more in detail when the bear market begins.
------------------------------------------------------
ETHEREUM ETHUSDT ,WE are watching the price action for next possible trade direction. The right direction is to allow the weekly time frame form a double top and aim the break of the neckline and sell down.
break above will be open for long position.
trading is probability
RISK MANAGEMENT IS KEY.
#ETHUSDT #ETHEREUM.

ETHEREUM ETHUSDT ,we are waiting for potential weekly candle from the demand floor ,a break will call for retest and we sell .then breakout of the supply roof will call for buy.
#ethusdt

Update of yesterday’s analysisAs we mentioned yesterday, Bitcoin has entered a range, and it’s likely that this range will continue until the news we posted in “mind” a few minutes ago. At the moment, the volume is very low, and the probability of fake moves is high. ✅


Looks like we should wait for a price correction.Support and resistance points are clear
Explanation stated on YouTube
