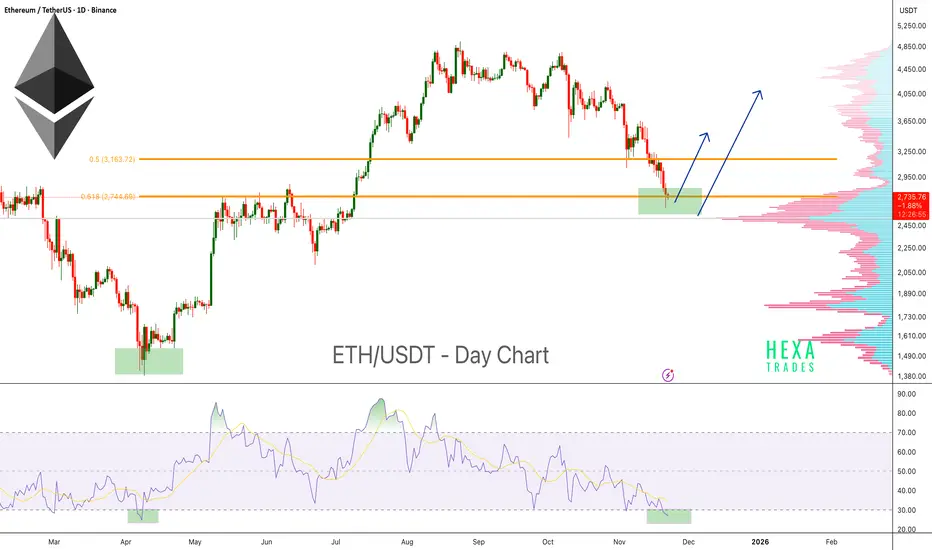
Ethereum Approaching Reversal Zone!Ethereum is currently trading at a major support zone, an area where price has historically shown strong reactions and multiple bounces. This demand zone has acted as a key reversal region several times, and ETH is once again testing it.
Price is also sitting near the 0.618 Fibonacci retracement (Golden Zone), which is commonly used to identify potential reversal points during market corrections.
The Volume Profile shows a high-volume node exactly at the current support area, indicating strong interest and previous accumulation. This increases the probability that this zone will act as a strong support.
On the momentum side, the RSI has entered oversold territory once again. Historically, whenever ETH’s daily RSI dipped below 30, it marked strong bottom areas followed by significant bounces.
Key Highlights
- ETH retesting a major historical support zone.
- Trading inside the 0.618 Fibonacci Golden Zone.
- Daily RSI oversold (<30) — historically a strong bounce region.
- Volume Profile high-volume node aligns with support, increasing the strength of the zone.
- Potential for a short-term reversal if the support continues to hold.
Cheers
Hexa
Trade ideas
ETH - UPDATECRYPTOCAP:ETH - Update:
Very neutral area & bearish bias.
TP3 almost hit yesterday on my view. ✅🎯
Key support: 2620 - 2650$ - 2560 - 2480 - 2460 - 2380
Big resistances; 2900 - 2880 - 2815 - 3220
Under the main downtrend, Deeper correction possible 📉
Bottom could be around 2400$ - 2480 (weekly levels).

ETH/USDT – Weekly Analysis (W1)Price is around $2,730 after a strong weekly sell-off (–11.8%).
ETH has broken below the 0.618 retracement of the previous impulse, showing loss of bullish momentum.
Price is retracing toward a major multi-year demand zone.

eth short plan according HTF strucutreBTC and ETH shows complete selling from last one month so i planned accordingly on HTF.
#tradingplan #eth BINANCE:ETHUSDT

Spot idea for Ethereum (Nov 9, 2025)CRYPTOCAP:ETH / #Ethereum Spot idea for Ethereum (Nov 9, 2025)
On October 29, 2025, I posted an update saying it's worth waiting for Ethereum to drop into the $3,100 - $3,400 range, since that's where the nearest long trader liquidations are sitting, along with some big limit orders on exchanges like Binance and Coinbase.
We've hit those levels now.
Update:
So, it's time for a new update aimed at traders hunting for a better entry point on Spot (no leverage involved).
There are fresh large limit orders set by market makers and major whales.
➖ On Binance: $3,055, $3,000, $2,900, $2,800, $2,700, $2,500.
➖ On Coinbase: $3,000, $2,500.
If you check the Liquidation Heatmap on the Bybit crypto exchange through the Coinglass platform, the biggest pain point for traders is around $2,500 - $2,700, where big players will scoop up Ethereum more cheaply after those liquidations hit.
To sum it up:
The crypto market and the US stock market are both in correction mode right now, so you need to be extra cautious when looking for entry points and try to avoid using leverage on futures positions—otherwise, you could wipe out your trading deposit.
I think it's smart to hold off a bit longer and enter positions right where the big players are waiting, and where those trader liquidations are clustered.
That way, you'll have an edge on your entry and can hold the trade through Ethereum's distribution zone all the way up to $10,000.
Charts:
Looks like 2026–2027 could hit peak cycle vibes, right alongside the highs for stocks and crypto.
Altseason on deck?

Ethereum Bearish Price Action Suggests Lower to Come Ethereum’s price action is weakening as downside pressure accelerates. ETH has broken through several major support levels and is now trading below the $3,500 zone, which has flipped into a high-time-frame resistance area. This region also aligns with the 200-day moving average, adding to the bearish confluence.
The correction has pushed price toward the $2,600 area, where an oversold bounce may occur. However, any rebound from this level would likely form a lower high within the broader downtrend, as Ethereum continues to print consecutive lower lows.
From a structural perspective, the key downside target remains the $2,100 range low, which serves as the next major support zone. With ETH now finding acceptance within a lower trading range, the probability of price rotating toward this level has increased.
While a short-term bounce is possible, market structure currently favors continued bearish movement unless Ethereum can reclaim former support levels with strong momentum.

ETH/USDT Bearish Roadmap: Structure + MA Break AligningAsset: ETH/USDT — “Ethereum vs Tether”
Market Context: Crypto Market | Swing Trade | Bearish Profit Pathway Setup
📉 Market Outlook: Bearish Plan Confirmed
Ethereum is displaying a bearish continuation structure, with price breaking below the Triangular Moving Average zone, signaling shifting momentum from buyers to sellers. Market structure is weakening, liquidity is building above the recent highs, and major supports remain untested below.
This creates a clean swing-trade opportunity for disciplined traders.
🎯 Trade Plan: Thief Layered Entry Strategy
The plan uses a layered sell-limit approach to capture premium retracement entries.
🧩 Sell-Limit Layers (Short Entry Zones):
1st Layer: 3200
2nd Layer: 3100
3rd Layer: 3000
(Traders may add additional layers depending on preference, liquidity, and volatility.)
Layering helps reduce emotional entry pressure and allows scaling into premium short zones rather than rushing into the move.
🛑 Stop-Loss: Structural SL @ 3300
This is the Thief SL reference level at 3300, positioned above structural liquidity.
Ladies & Gentlemen (Thief OG’s): adjust SL according to your own risk tolerance, capital, and strategy framework.
Risk is personal — protect your account.
🏆 Target Zone: 2700
The downside objective aligns with:
Strong support retest
Oversold region confluence
Trap-pattern breakdown
Correlation pressures across major crypto pairs
Ladies & Gentlemen (Thief OG’s): this is a community target reference — take profit based on your own comfort and risk appetite. Profit is profit.
🔍 Related Pairs to Watch (Correlation Insights)
1️⃣ BTC/USDT ( CRYPTOCAP:BTC )
Bitcoin leads crypto directional momentum.
ETH generally mirrors BTC swings with slightly slower volatility.
If BTC struggles to reclaim resistance zones, ETH downside probability strengthens.
2️⃣ ETH/BTC ( BINANCE:ETHBTC )
Key ratio indicating Ethereum’s strength vs Bitcoin.
ETHBTC downtrend continues → ETHUSD bearish continuation becomes more reliable.
3️⃣ SOL/USDT ( CRYPTOCAP:SOL )
Strong competitor in Layer-1 ecosystem.
SOL weakness often reflects broader market appetite decreasing → ETH follows.
4️⃣ TOTAL2 (Altcoin Market Cap)
Tracks overall strength of altcoins excluding BTC.
Breakdown in TOTAL2 = bearish environment = supports ETH downside targets.
Monitoring these pairs provides confirmation of:
Trend alignment
Market-wide weakness
Strength of bearish momentum
Liquidity flows across majors
✅ Final Notes
This setup is built for traders who prefer structured entries, disciplined layers, clear SL zones, and realistic targets.
Trade smart, manage risk, and follow your own strategy refinement.

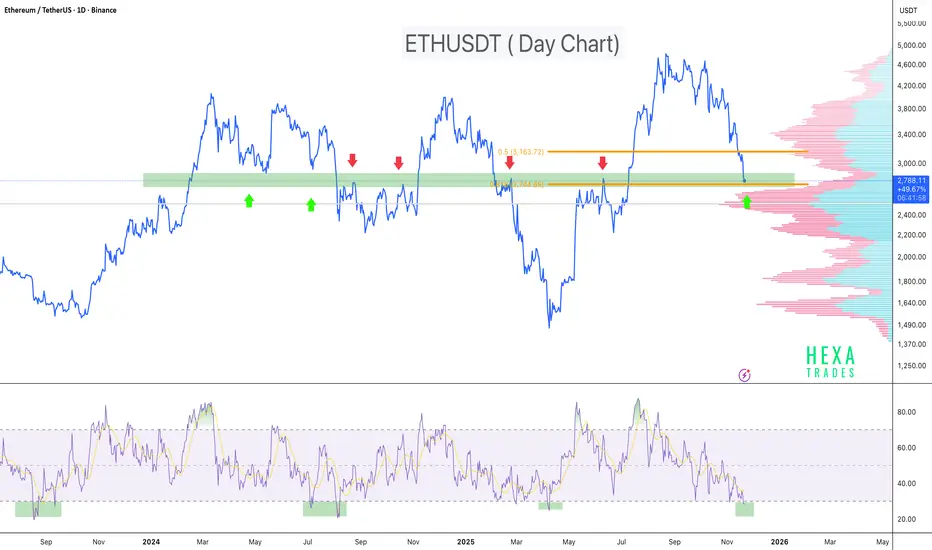
ETH : Oversold RSI + Fib Golden Zone = High-Probability ReversalETH is currently trading inside a major historical support zone, an area where price has repeatedly been rejected and bounced in the past. This level has acted as a strong demand zone multiple times, and the price is once again testing it.
On the momentum side, the RSI has dipped below 30 on the daily chart. Historically, every time ETH’s RSI dropped into the oversold region, it marked a strong bottom formation followed by a notable bounce.
Price is also sitting inside the Fibonacci golden zone, adding further confluence that this area could act as a potential reversal point.
Key Points:
- Strong multi-tested support zone
- Price reacting inside the Fib golden pocket
- Daily RSI oversold (<30) - historically reliable bottom signal for ETH
- High probability bounce zone if the support holds
- This is a critical level to watch for bullish reactions or early reversal signals.
Cheers
Hex
ETH Weekly Outlook: Critical Support – What Happens Next?📌 Scenario 1 — Bullish Rejection From Support → Break of Liquidity Zone
Price continues to pull back into the 2,500–2,650 support zone, which also aligns with previous structure and mitigation levels.
If buyers defend this area strongly:
Price forms a higher low inside the support zone.
Bullish momentum pushes ETH back above the broken trendline.
ETH targets the liquidity zone around 4,500–4,600.
A breakout and close above this level could lead to a strong continuation rally, sweeping previous highs.
Bias: Bullish continuation after correction.
📌 Scenario 2 — Deeper Sweep Into Major Support → Strong Reversal
If current support fails to hold:
ETH may dip deeper into the major support + imbalance zone (around 2,250–2,400).
This area contains a liquidity pool, meaning price may intentionally sweep it before reversing.
After the liquidity grab, a sharp bullish reaction is expected.
Price climbs back toward 3,000–3,200, retests structure, and then targets the 4,500–4,600 liquidity zone again.
Bias: Liquidity grab → Market structure shift → Strong bullish recovery.

ETHUSDT.P - November 22, 2025Ethereum is trading in a clear short-term downtrend, defined by consistent lower highs and a descending trendline resistance overhead. Momentum remains bearish and, unless price can reclaim the 2,825–2,875 resistance bands, the next support zone to watch sits around 2,625; failure there could see an extension lower toward the 2,525 region.

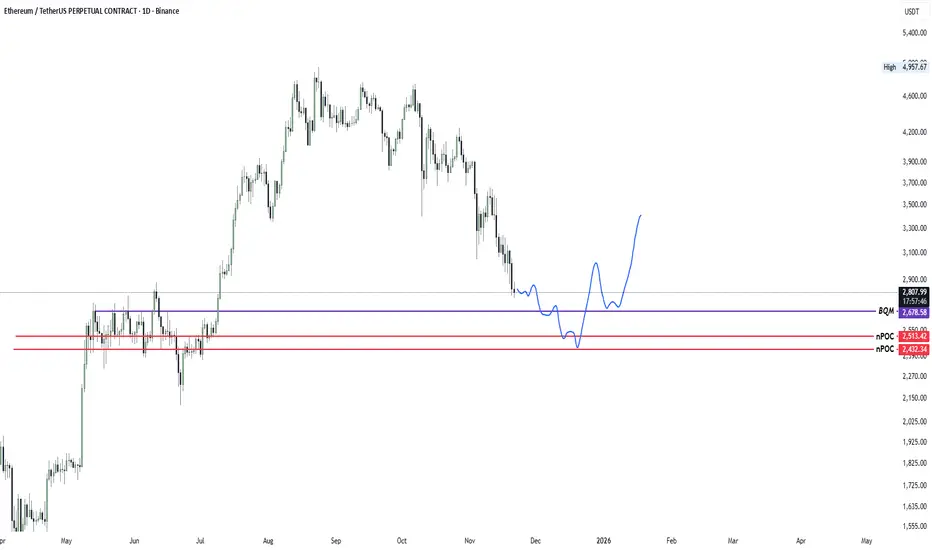
#Ethereum (Higher Time Frame Analysis)We can see Volume Areas and BQM levels.
I am watching these levels for a Spot Buy Trade.
It is better to DCA #ETH for now
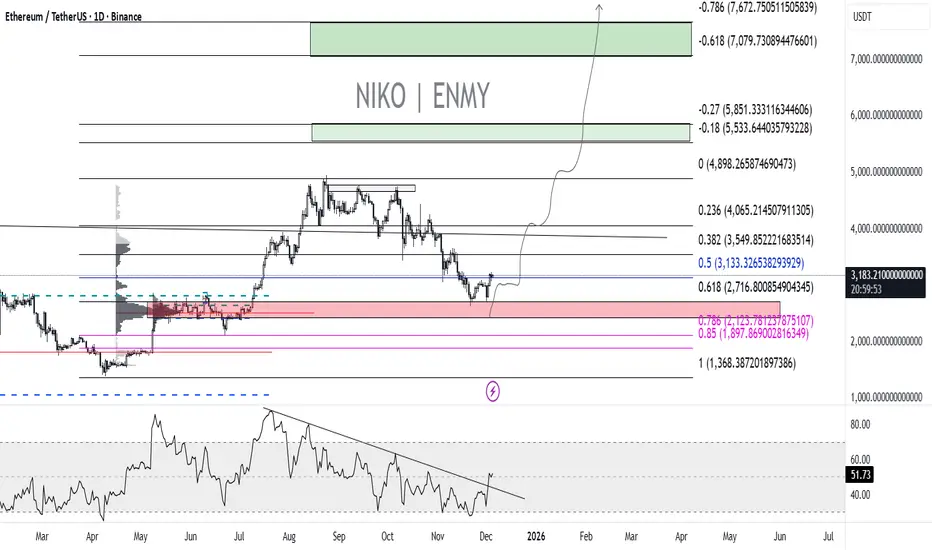
ETH probaly has got the last correctionThe vast majority of traders really expect prices to continue falling, not only for ETH, but across the entire cryptocurrency market. It seems to me that everyone is already disappointed and devastated by all this, so they are not expecting a new ATH. I'm not even talking about unrealistic goals, such as 11-13 thousand for 1 ETHEREUM, not because I'm afraid to say it, not at all, I just want to show the lowest, absolutely logical goals that I see without any special equipment. The first is $5,601, the second is $7,001, and when we get there, we'll keep talking about it.
I believe that everything is much simpler than people try to distinguish and understand. We have a strong bullish trend from 1381 to 5006 with a solid and very valuable imbalance zone of 2301-2830, which is also the 0.618 FIBO level of the entire trend. A perfect correction and reaction from this level. Moreover, we have a breakout of the daily trend line on the RSI. Whatever happens, don't follow me, this is just another opinion. Time will tell who is right.
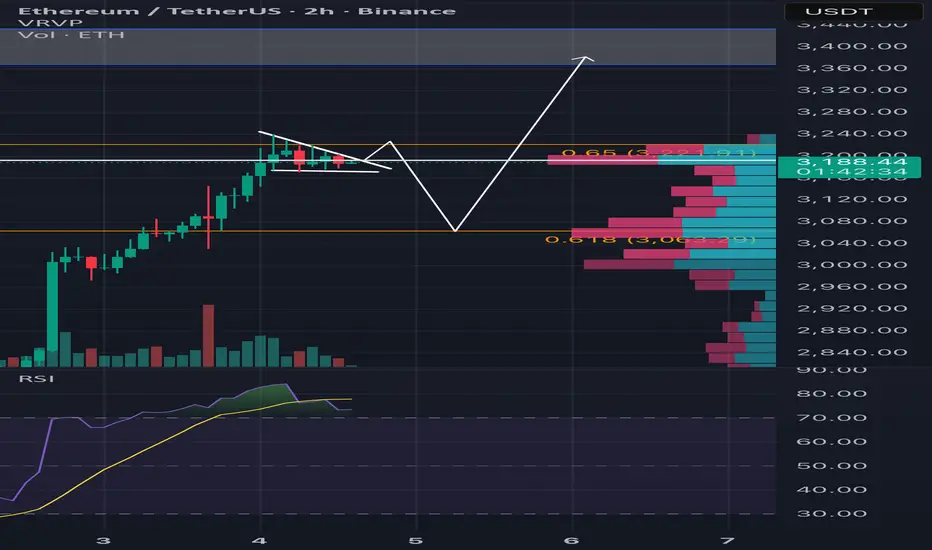
ETH 2h triangle and potential liqudity grabPrice is currently around $3190 and is consolidating inside a small descending triangle. Volume is decreasing, showing indecision.
A major support zone appears near the 0.618 Fibonacci level at ~$3063, where there is also a strong VRVP volume node, which could act as a liqudity grab zone.
Two possible paths are:
1. Bullish scenario: Price breaks out of the triangle upward and continues toward the $3350–$3400 resistance zone.
2. Bearish scenario: Price dips down to the $3060–$3080 region, finds support at the 0.618 fib, and then continues up toward the same target zone.
RSI is cooling off after being in the higher range.
ETH/USDT Bullish Reversal SetupETH/USDT Bullish Reversal Setup
The chart shows a clear transition in ETH as price moves from a prolonged distribution-driven decline into a developing accumulation range. After weeks of consistent bearish structure, the market finally printed multiple upside shifts, signaling that sell-side pressure is weakening and liquidity behavior is changing.
The recent impulsive rally out of the discounted range confirms that buyers are actively defending lower levels. Price is now pulling back toward a short-term demand pocket formed during the breakout. This area represents the first meaningful accumulation zone after the market broke a series of internal swing points.
As long as price maintains stability within this demand block, the structure favors continuation toward the next major liquidity cluster above. The next upside draw is positioned around the 3,440–3,500 region, where previous inefficiencies and unmitigated zones converge. That region also holds resting buy-side liquidity, making it the logical target for a future expansion move.
The current market behavior suggests that ETH is in the early phase of a bullish repricing cycle. A controlled pullback into the highlighted zone—followed by a reaction—would confirm continuation and attract momentum buyers aiming for the higher liquidity magnet.
Overall, this chart reflects a shift in narrative: sellers are losing dominance, the market is building a fresh bullish structure, and the path of least resistance is gradually tilting upward as long as the demand zone remains protected.

Role of International Trade1. Driving Economic Growth and Development
One of the primary roles of international trade is to accelerate economic growth. When countries engage in cross-border trade:
GDP increases due to higher production and export activities.
Foreign exchange earnings expand, allowing countries to import advanced goods and technologies.
Investment flows rise, as global investors look for new markets and opportunities.
Developing nations particularly benefit from increased exports of agricultural products, textiles, minerals, or manufactured goods. When these countries participate in global markets, they experience:
Higher income levels
Improved infrastructure
Better economic stability
Integration with global supply chains
Historically, trade-led growth has transformed economies like China, South Korea, and Singapore, demonstrating that global integration is a powerful engine for development.
2. Promoting Specialization and Comparative Advantage
International trade allows countries to specialize, producing goods and services they can create most efficiently. This concept is rooted in the theory of comparative advantage, proposed by economist David Ricardo.
For example:
India specializes in IT services, pharmaceuticals, and textiles.
Germany excels in automobile manufacturing and engineering.
Japan specializes in electronics and robotics.
Brazil is strong in agriculture and raw materials.
Specialization increases:
Productivity
Efficiency
Quality of goods
Global competitiveness
By focusing on strengths, nations produce more with fewer resources and trade for goods they cannot efficiently manufacture.
3. Expanding Markets for Businesses
Without international trade, companies are constrained by the size of their domestic markets. Trade opens access to billions of consumers worldwide, allowing firms to scale production, reduce costs, and increase profits.
Key benefits include:
Access to larger customer bases
Opportunity to diversify products
Increased brand recognition
Ability to compete globally
Export-oriented industries often grow faster than domestic-focused ones because they face greater demand and tougher competition, which boosts innovation and efficiency.
4. Generating Employment Opportunities
International trade creates millions of direct and indirect jobs across sectors such as:
Manufacturing
Agriculture
IT and services
Logistics and shipping
Banking and finance
Export industries usually require skilled and unskilled labor, increasing employment opportunities. Additionally, growth in trade-related sectors—port operations, customs, warehousing, and transportation—creates supply chain jobs.
In many developing countries, trade-driven manufacturing has pulled millions out of poverty by providing stable income and opportunities for skill development.
5. Encouraging Innovation and Technology Transfer
A key role of international trade is accelerating global technological advancement. When countries import technology-rich products such as machinery, robotics, medical devices, and software, they indirectly gain access to new knowledge and innovation.
Trade fosters:
Technology transfer, from advanced economies to developing nations
Improved industrial processes through imported machinery
Research and Development (R&D) investments driven by global competition
Multinational companies bring modern production systems, managerial skills, and digital tools to the countries where they operate. This accelerates industrialization and enhances productivity.
6. Enhancing Consumer Choice and Quality of Life
International trade dramatically increases the variety of products available to consumers. Without global trade:
Fruits like apples, kiwis, and oranges would be unavailable in many regions.
Electronics, automobiles, and smartphones would be far costlier.
Medicines and medical equipment would be limited.
Trade ensures:
Lower prices
Better product quality
Wider product variety
Continuous innovation
Competition from foreign producers forces domestic companies to improve their products and cut costs, benefiting consumers directly.
7. Strengthening Geopolitical and Diplomatic Relations
Trade is not just an economic tool but also a strategic instrument in international diplomacy. When countries engage in trade partnerships, they build political trust and cooperation.
Benefits include:
Stronger international alliances
Reduced chances of conflict due to mutual economic dependence
Increased cultural exchange
Collaborative agreements in defense, research, and environment
Institutions like the World Trade Organization (WTO), regional trade blocs (EU, ASEAN, NAFTA/USMCA), and bilateral agreements help maintain global economic stability.
8. Supporting Industrial and Infrastructural Development
International trade encourages governments to invest in:
Ports
Highways
Railways
Digital networks
Special Economic Zones (SEZs)
Warehousing and logistics facilities
These improvements not only boost export capacity but also strengthen domestic economic development. In many developing countries, international trade has driven major upgrades in transportation and communication infrastructure.
9. Reducing Production Costs through Global Supply Chains
Trade enables companies to source raw materials, components, and labor from countries where they are most cost-effective.
Examples:
Electronics manufacturers source chips from Taiwan, assembly from China, and components from Malaysia.
Automobile companies import spare parts from multiple countries.
Fashion brands source textiles from India and Bangladesh.
This interconnected global supply chain reduces production costs and enhances efficiency. It also allows companies to diversify supply sources, reducing dependence on any single country.
10. Promoting Economic Resilience and Diversification
Countries that rely heavily on a single industry or resource are vulnerable to economic shocks. International trade helps diversify economic activities.
For example:
Gulf countries are investing in tourism and manufacturing to reduce oil dependency.
African countries are moving from raw material exports to processed goods.
Asian economies balance IT services, manufacturing, and agriculture.
Diversification through trade strengthens economic resilience and reduces vulnerability to global price fluctuations.
Conclusion
International trade plays a foundational role in shaping the modern global economy. It drives economic growth, promotes specialization, increases innovation, and expands opportunities for businesses and workers alike. It enriches consumer choice, strengthens diplomatic ties, and promotes global economic stability.
For developing nations, international trade is a powerful engine for lifting populations out of poverty, modernizing industries, and integrating into global value chains. For advanced economies, it supports innovation, competitiveness, and continued prosperity.
In a rapidly globalizing world, the role of international trade is more significant than ever—linking nations, building economies, and shaping a more interconnected and prosperous global future.

ETH-USDT
Ethereum has reached the resistance I was expecting
and it has made up for the losses it had on Monday.
Now it has hit resistance and might want to correct, which is natural 🚨📣
The short-term support for Ethereum is $2950 📊
If it breaks the resistance, I’ll give you an update 💰✔️

Ethereum Price Prediction: Can New Holders Fill the LTH Gap?Ethereum is trading at $2,805 at the time of writing, reflecting a 6% daily decline. The asset is sitting just below the $2,814 resistance level after its latest failed attempt to break through $3,000.
Based on current sentiment and market structure, ETH could stabilize and attempt a rebound, but a strong recovery will require consistent investor support. In the near term, Ethereum will likely fluctuate between $2,814 and $3,000 as it searches for direction.
If bullish momentum strengthens and fresh demand remains steady, Ethereum could finally break above the $3,000 barrier. A successful breach would pave the way for a move toward $3,131 and potentially $3,287, invalidating the short-term bearish thesis.

ETH Hit the First Target — The Downtrend Is Fully IntactETH has perfectly reached the first downside target we mapped earlier. Price broke the key support zone and today's candles confirm that the move was not a fakeout — this is real momentum, not noise.
Right now, ETH is only retesting broken structure and still trading below all major resistances. Nothing about this chart suggests strength.
🔻 Next Steps (as plotted on the chart):
A small bounce / retest is normal here, but as long as ETH stays below $3,700–$3,800, the trend remains bearish and continuation toward $2,900–$3,000 stays the primary target.
This is still not a place to consider longs — it's simply a corrective pullback inside a confirmed downtrend.
⚠️ Trend direction has not changed.
This move down is following the same plan we laid out from the top.
❗ Not financial advice — only my personal view.

ETH-USDTI updated my Ethereum chart, also after the sharp correction.
It has formed a support floor and ceiling, and a range between 2726 and 2840 🕯📊
If it can maintain this 2750 box, it could recover and bounce back toward 3,000 dollars with the resistance breakout I mentioned 🔼💰

NLDN | Technical Analysis ETHUSDTMy current projection is that ETH (Ethereum) will continue its downward trajectory toward the $2,300 price range.
However, unless there is significant buying volume and a decisive break above the $2,350 range, the possibility for a bullish rally remains limited.

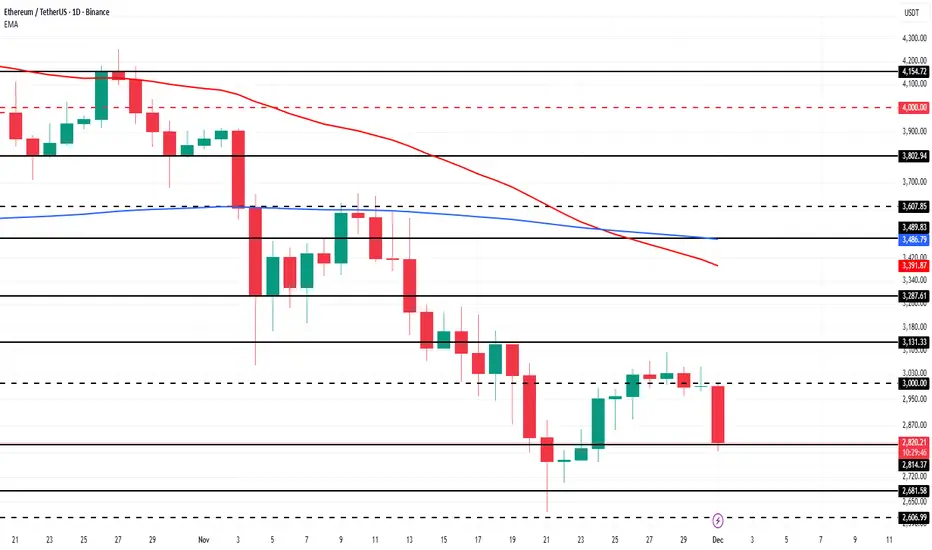
3 Altcoins To Watch In The First Week Of December 2025Ethereum is a key altcoin to monitor this week as it approaches the Fusaka upgrade, scheduled to go live on December 3. This marks its second major upgrade of the year following Pectra and aims to strengthen the network’s long-term scalability.
Fusaka is designed to help Ethereum support high transaction throughput from layer-2 chains by implementing 12 Ethereum Improvement Proposals. The upgrade could lift ETH from its $2,814 support level toward $3,000. Reclaiming that level is essential for a push toward $3,131 and a broader recovery.
If bearish momentum continues and Ethereum reacts negatively to the ongoing Death Cross indicated by its EMAs, ETH may lose support. A fall below $2,814 could send the price toward $2,681, invalidating the bullish thesis and signaling deeper downside risk.
ETH-USDTThis 2-hour chart has formed a support and resistance. If it breaks the 2866 resistance, it could bounce back upwards 🚀🔼
And if the 2790 support is broken, there’s no significant support until 2630 🔽🔽💰

ETH-USDTIt's almost similar to Solana's chart 📣
And Ethereum is also between the two levels marked at 3090-2890
If it can break its resistance, the rise towards 3400 could continue 📊🚀
The second and next support for Ethereum after 2890 is around 2790 ✔️💰💰
