ETHUSDT — Bearish Flow Targeting 2,956ETH is still trading below the key intraday resistance at 3032–3045, keeping the bearish structure intact.
As long as price fails to break and hold above this zone, downside pressure is expected to continue.
The current Fibonacci sequence supports a continuation lower, with price showing repeated rejections around the 0.333 / 0.236 levels.
This keeps the market biased toward the next liquidity pocket.
📉 Main bearish target: 2,956
This level aligns with the Fib 1.0 extension, making it the next high-probability destination if bearish momentum persists.
A break above 3045 would invalidate this scenario; otherwise, ETH remains on track toward 2,956.
Trade ideas

LONG TRADE (ETHUSDT)ENTRY: 3,074
STOP LOSS: 3,054
TP1: 3,104
TP2: 3,124
RRR: ~1.5:1 (TP1), ~2.5:1 (TP2)
1m:
Clean microstructure breakout above local resistance
Reclaim and retest of breakout zone near 3,070 followed by bullish engulfing
Strong impulse with no chop → suggests momentum continuation
5m:
Volume spike breakout from recent consolidation
Reclaim of prior structure around 3,050–3,060, now acting as demand
Higher low + engulfing move confirms setup
15m:
Trend direction remains bullish after strong impulse
Pullback held key structural support (3,020 zone)
Price now reacting off previous high-volume node → continuation into upper supply


ETHUSD – Major Dump → Major Imbalance Targets AboveETH just came off a heavy sell-off, leaving a stack of unfilled imbalances (vector candles) across multiple timeframes — from 15min all the way up to 1W.
Price has reached a deep discount region and may still dip further (ETH is more volatile than SPX), but the upside inefficiencies remain the key magnets. These purple zones show where aggressive volume previously entered but never got fully retraced. Historically, ETH gravitates back to these levels before forming any true macro reversal.
I’m watching the following levels as primary targets on any sustained recovery move:
$3,328 → $3,398 (15m vectors)
$3,411 (30m)
$3,447 (45m)
$3,658 (1W imbalance)
$3,866 → $3,891 (3–5min clusters)
$4,075 (higher-timeframe inefficiency)
As long as ETH holds above the recent lows and continues building structure, these imbalances remain the key draw on liquidity. Any deeper discount could simply provide a better base before the inevitable vector recovery.
Not financial advice — just my map.

ETH/USDT – Perfect Predictive BUY Signal (10.88R) Using OQBA PAEI tested my new indicator :
OQBA Predictive Analysis Engine (PAE)
on the ETH/USDT pair, and the results were extremely impressive.
During the last sessions, the indicator generated 5 consecutive winning signals (LONG + SHORT), and just two hours ago, it triggered a Predictive BUY that delivered a remarkable:
📈 Risk/Reward: 10.88R
This BUY signal was supported by:
Strong predictive MACD momentum
High-confidence R² stability
Volatility compression detected before the breakout
Histogram projection confirming bullish pressure
🔍 Why this signal matters
The indicator doesn’t wait for lagging confirmation —
it predicts trend shifts using linear regression forecasting + MACD projection.
On ETH, this created a clean high-confidence setup that developed into a powerful breakout.
📌 Chart Preview
(ضع سكرينشوت هنا يظهر نقطة الدخول و الـ TP)
🔧 Indicator Used:
OQBA Predictive Analysis Engine (PAE)
– My own open-source predictive momentum system
– Designed to detect early reversals with confidence filtering
– Now available for public use on TradingView
💬 Let me know if you want:
✔️ A breakdown of how the indicator detected this move
✔️ Settings I used
✔️ A backtest template
✔️ or the premium edition version
ETH-USDTYesterday also showed signs of an upward move.
It managed to break out of its short-term channel and is now above the 2894 level 📊📊
🔤🔤🔤
If this level holds, it has bounced back and is heading for the 3174 target 🚀🚀
However, if it goes below 2894 ✌️
it could correct down to the 2789 support
and then rise again 🔼

ETH is bottom 2000 usd and bull start after 1 May?We can see that Ethereum’s Fibonacci 0.618 level is at $2,000, and it is also following a parallel pattern. Additionally, market sentiment is in a state of extreme fear.

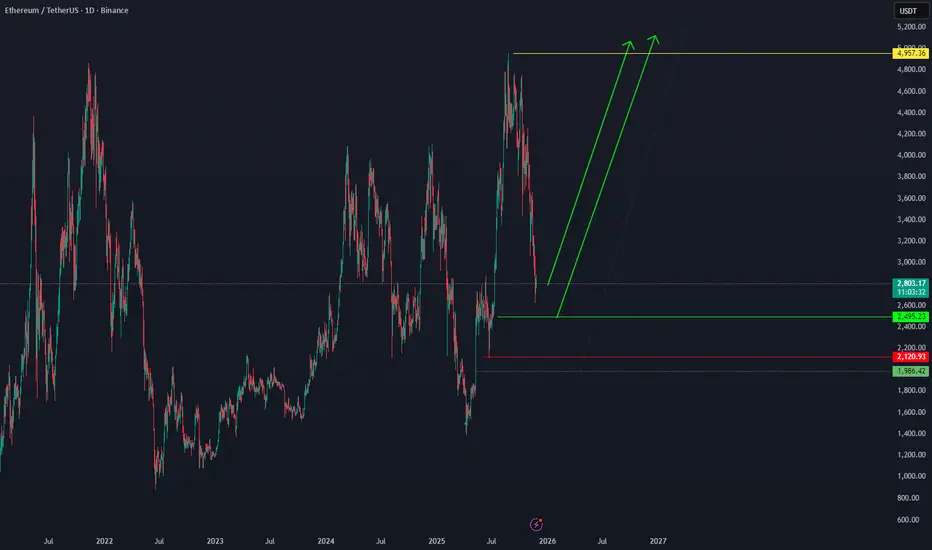
ETH is ready to reach its ATH.Ethereum can start its bullish move from the current price, as well as from 2495 — and in a more pessimistic scenario, from 1983.42 — targeting 4957 and potentially higher. BINANCE:ETHUSDT
ETH/USDTETH remains in a broad consolidation phase.
Price has now reached the lower boundary of the range, bringing the market into a potential long setup zone — but only if proper confirmation signals are present.
As always, patience and validation of conditions are key before considering any long entries.

Descending channel ETH/USDTSeems like we've found ourselves in a channel. It tried to breakout above it, but it couldn't. Let's see what happens now.

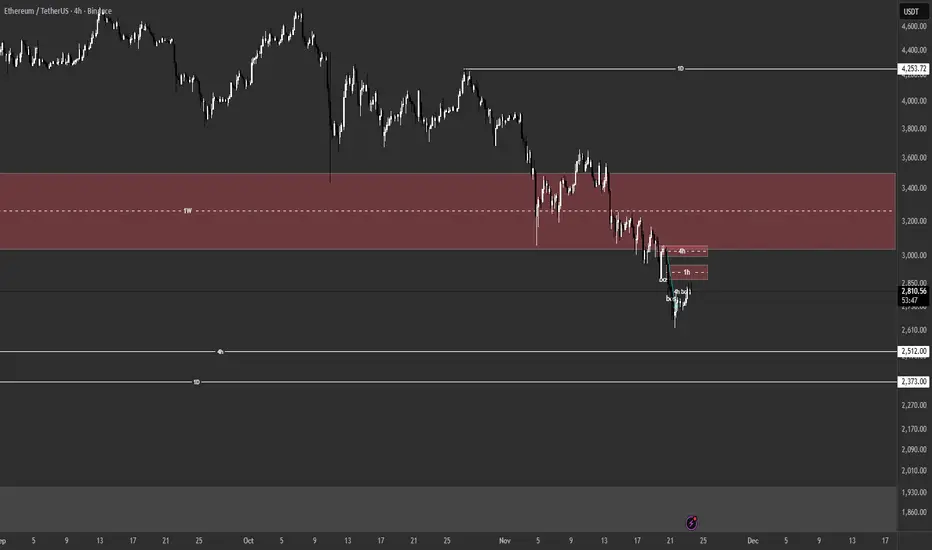
BEARISH DIRECTIONAL BIASETH is showing a clear bearish structure on the daily timeframe, and as we scale down to the 4H and 1H charts, price has formed bearish Fair Value Gaps that may act as short-term reaction zones, potentially driving ETH toward $2,512 on the 4H timeframe and $2,373 on the daily, while on the higher 1-month timeframe, a significant order block exists that could induce a bullish relief rally if price closes below the 4H and daily lows, providing a potential area for buyers to step in and temporarily counter the broader downtrend.
Elloit wave ETH 11/23/2025This is my current Elliott wave count of ETH.I think that there will be a last lower low and then,the wave 3 shall begin.

ETH-USDT🔤🔤🔤
Similar to Solana, it's in a channel and has reached the top of the channel 🕯
So for a rise, it needs to break the top of the channel.
If it succeeds in breaking the trendline, the short-term targets are
$3,000 and $3,170 🔼🔼💰💰
On the other hand, if it fails to break the trendline again,
Ethereum's short-term supports 👇👇
are at
2790
2650 🚨

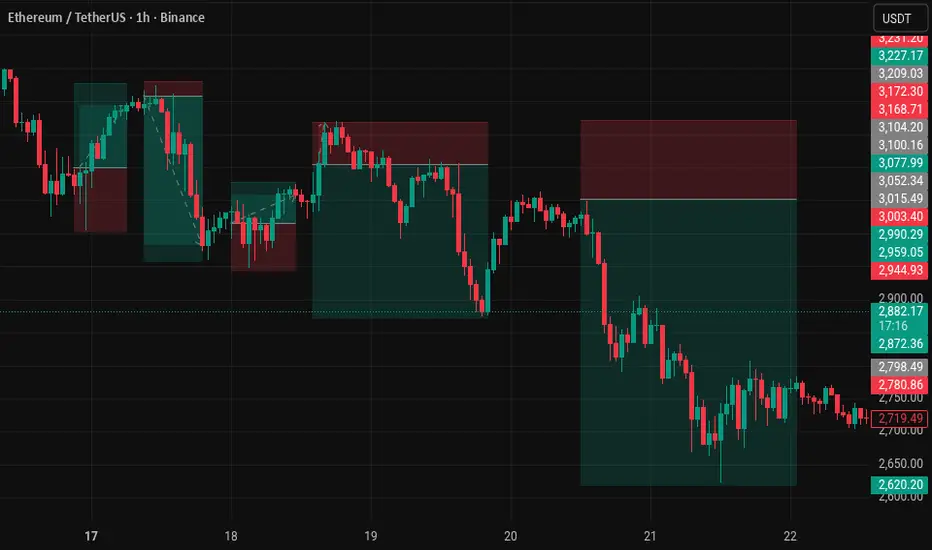
ETH Down to 2450The reason for the trade is
1) Downtrend
2)The selling volume near the entry zone is very high(strong selling from the zone on Thursday 20 Nov)
3) 1hr Demand Just above the entry
4) Fair value gap still pending
There was a strong supply zone around 2620 which got tapped on Friday 21 Nov, to break through that zone, the market is consolidating and will need strong selling to go further down to our next target 2450. Market is slowly moving towards the demand zone right above 2950 from where it can get the selling power required to break the 2620 zone.
P.S:- Due to weekend the market won't follow the trend line drawn.

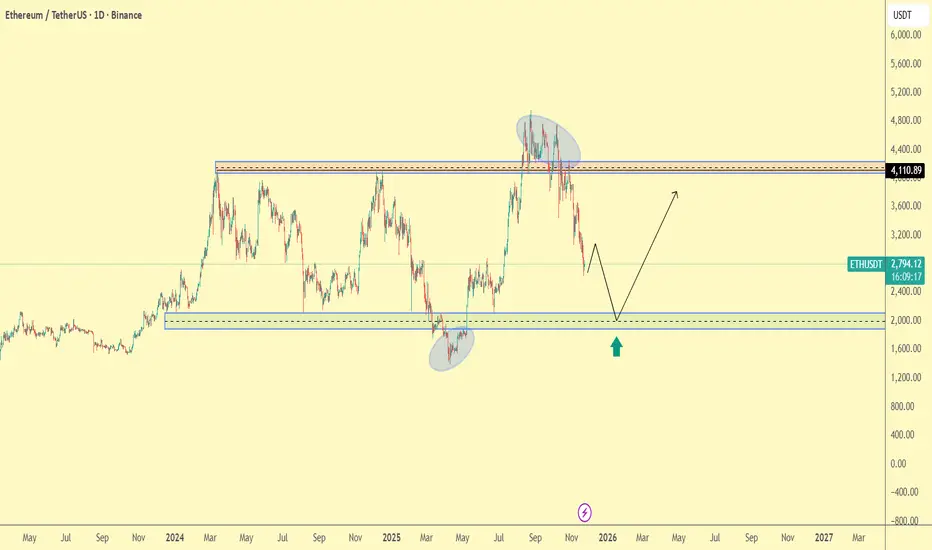
ETH Trade Plan 23/11/2025(Daily Time Frame)Dear Traders,
Ethereum is currently in a corrective phase after a significant rally and repeated rejections from major resistance levels. The structure suggests price is approaching a critical zone that could determine ETH’s medium- to long-term direction.
Below is a full technical + fundamental + scenario-based analysis based on your chart.
🟦 1. Technical Analysis
🔹 Market Structure
In the daily timeframe, Ethereum has rejected the major resistance area at $3,950 – $4,200, which previously acted as a local top. After failing to break above it twice, the market shifted into correction mode.
Price is now heading toward a major support zone around $1,890 – $2,150, which includes:
A strong historical demand zone
A previous accumulation area
A key horizontal support level
The region that initiated the previous uptrend
This is a macro support, tested multiple times.
🔹 Repeated Tops (Distribution Zones)
ETH formed two distribution structures around $4,100, indicating strong sell pressure.
Your marked ellipses correctly highlight areas where large players likely distributed positions.
🔹 Likely Path of Price
The chart structure suggests a high-probability scenario:
Retracement into $1,890–$2,150
Reaction or short-term bounce
Retest of broken structure or mid-range resistance
Potential start of a new upward leg
This follows the classic pattern: correction → accumulation → impulse.
🔹 Bullish Scenario
If Ethereum finds support and confirms reversal signals such as:
Bullish engulfing candles
Higher lows
Bullish BOS (Break of Structure)
RSI divergence
then a strong rally is likely.
Targets:
Target 1: $2,800 – $3,000
Target 2: ~$3,500
Target 3 (mid-term): $4,100 – $4,300
Breaking above $4,300 could open the door for a new long-term bullish cycle.
🔹 Bearish Scenario (Low Probability but Important)
If ETH loses the major support at $1,890 with strong volume:
Next support: $1,650
Deep correction target: $1,450
This scenario becomes more likely if Bitcoin enters a heavy sell-off or if macroeconomic risk increases.
🟦 2. Fundamental Analysis
Ethereum remains one of the strongest assets fundamentally, supported by real-world usage, developer activity, and network economics.
🔹 Network Upgrades (Ethereum Roadmap)
After the full transition to Proof-of-Stake and subsequent upgrades, Ethereum benefits from:
Lower issuance (near-deflationary supply)
Lower energy consumption
Higher performance
Better scalability
Upcoming improvements focus on data availability and rollup efficiency, which reduces gas fees and boosts ecosystem growth.
🔹 Growth of Layer 2 Networks
L2 ecosystems like:
Arbitrum
Optimism
Base
zkSync
Starknet
are driving massive transaction volume into Ethereum.
More L2 usage → more ETH burned → stronger long-term value.
🔹 Dominance in DeFi
Ethereum still leads the DeFi sector:
Highest TVL (Total Value Locked)
Most active protocols
Largest developer community
This creates continuous, organic demand for ETH in:
Transactions
Staking
Collateral
Smart contract execution
🔹 Staking Demand
Over 25% of Ethereum’s total supply is staked.
This reduces circulating supply, lowers sell pressure, and supports long-term price appreciation.
Institutional interest in staking continues to grow, further strengthening fundamentals.
🔹 Key Risks
Despite strong fundamentals, ETH faces these challenges:
Regulatory pressure on staking services
Correlation with Bitcoin in macro downtrends
Competition from fast L1 networks (Solana, Avalanche, Sui, etc.)
Still, Ethereum remains ahead in ecosystem maturity and security.
🟦 3. Final Summary
Ethereum is approaching one of its most important supports in the last two years.
If buyers defend the $1,890–$2,150 region, a multi-month bullish wave could begin.
🔥 Key Points
ETH is correcting into major support
Technical structure is still bullish in the bigger picture
Fundamentals remain extremely strong
L2 growth, staking, and DeFi support long-term appreciation
The main scenario is: correction → accumulation → upward continuation
Targets remain $3,000 → $3,500 → $4,300 if the support holds.
ETH Weekly Outlook: Critical Support – What Happens Next?📌 Scenario 1 — Bullish Rejection From Support → Break of Liquidity Zone
Price continues to pull back into the 2,500–2,650 support zone, which also aligns with previous structure and mitigation levels.
If buyers defend this area strongly:
Price forms a higher low inside the support zone.
Bullish momentum pushes ETH back above the broken trendline.
ETH targets the liquidity zone around 4,500–4,600.
A breakout and close above this level could lead to a strong continuation rally, sweeping previous highs.
Bias: Bullish continuation after correction.
📌 Scenario 2 — Deeper Sweep Into Major Support → Strong Reversal
If current support fails to hold:
ETH may dip deeper into the major support + imbalance zone (around 2,250–2,400).
This area contains a liquidity pool, meaning price may intentionally sweep it before reversing.
After the liquidity grab, a sharp bullish reaction is expected.
Price climbs back toward 3,000–3,200, retests structure, and then targets the 4,500–4,600 liquidity zone again.
Bias: Liquidity grab → Market structure shift → Strong bullish recovery.

ETHI think $2000 will mark the bottom for $ETH. The structure supports a sharp reversal from that zone, and once momentum shifts, a massive rally can begin. My upside projections remain $7200 and $9000 as liquidity returns and the trend expands.

ETHIt looks like a bottom here. My target is around 3600. BTC closed the weekly candle below the 50 WMA, but I wouldn’t rule out a bounce.

Ethereum Falls Under $2,800 — A 44% Drawdown From the Highs📉 Ethereum ( BINANCE:ETHUSDT ) has officially broken below the $2,800 level, a major structural zone that has acted as both strong support and resistance in multiple past cycles.
🔻 The drop now totals -44% from the all-time highs, pushing price back into an area where long-term buyers previously stepped in aggressively.
📊 The weekly RSI sits near 40, historically a region that has offered short-term relief and attractive asymmetric setups.
🧭 From a risk-reward standpoint, this remains an interesting zone for gradual accumulation, especially as sentiment turns increasingly bearish.
💡 In markets, the best opportunities tend to appear when nobody wants the asset.

ETH | Long 3 Hrs | Target: 3600This technical analysis is for informational and educational purposes only. It does not constitute financial advice. Remember to always research and consult with a professional before making investment decisions. Good luck! 📈💼🚀

ETH/USDT 1W review1. Broken uptrend
The black upward trend line has been clearly broken down.
➡️ This is a signal of a change in the market structure from uptrend → downtrend.
⸻
2. The current candle is under the important support of USD 3,070
You marked the ~3070 level as previous support.
Now the price is clearly below it, which suggests:
• breaking support,
• a retest from below may occur,
• continuation of declines is likely.
⸻
3. Another important support on the chart
I see strong levels:
🔴 #1 Support: $2,830 - $2,900 (current price)
This is the zone where the price is trying to hold – but it looks like there is a weak reaction.
🔴 Backer #2: $2,147
This is a wide zone where the upward impulse previously began.
➡️ If ETH drops below 2800-2830, the next logical target is 2150-2200.
⸻
4. RSI (1W) shows a downward trend
• RSI is around 40, which is close to the oversold zone.
• The RSI trend has been down for months.
• No bullish divergence (no trend reversal signal).
➡️ This supports the narrative of further declines.
⸻
5. Candle structure - clear downward momentum
Some previous candles:
• large red bodies,
• no aggressive buying,
• reflections are weak,
• The weekly candle currently looks bearish.
⸻
📊 Technical Summary
Based on the chart:
Short-term and medium-term trends: downward
The price broke key supports
Most likely scenario:
➡️ Continued declines to USD 2,150-2,200
if the 2830 level is broken and the weekly candle closes below.
⸻
📈 When would things look like they would turn around?
Only if:
✔️ Price will return above 3070
✔️ And will maintain a weekly close above this level
✔️ RSI will bounce up and divergence will appear
Then we can talk about a greater chance of returning to 3,500 and beyond.

ETH Extreme Cadence 2026 PredictionAs I see it, it might be possible that we are about to witness this huge movement down and up. It has occured three times in a similar cadence and same highs trend line so...
It also makes sence that we retest the All Time POC .
Anyway I´m buying as much ETH as I can next March/ April 2026 at that price...
Hope it´s usefull for some of you.
