ETHUSDT.P - November 21, 2025The market is in a short‑term downtrend, confirmed by a clear sequence of lower highs capped by a descending trendline and repeated failure at the 3,020–3,040 resistance band.
Price lost momentum after the last test of that resistance, triggered a new selling pressure, and unwound sharply back through intraday support levels, opening room for continuation toward the lower projected support zones.
Trade ideas

ETH / USDT (4H Timeframe)Pattern: Break of Structure + Retracement Into Major Supply Zone + Short Continuation Setup
The chart shows Ethereum forming a clean bearish structure with repeated Breaks of Structure (BOS) as sellers continue dominating the 4H timeframe. Price is currently pulling back toward a major supply zone, where strong institutional selling previously stepped in. This retracement is likely setting up a continuation to the downside.
Key Observations
🔹 Confirmed Bearish Structure:
ETH has printed multiple BOS levels, signaling that sellers remain firmly in control.
🔹 Major Supply Zone ($3,170–$3,143):
A strong supply block highlighted on the chart.
This is where ETH previously saw heavy sell pressure, creating an ideal zone for a bearish retest.
🔹 Retracement Before Rejection:
Price is currently climbing toward the supply zone, following the dotted bullish retracement path shown.
🔹 Liquidity Grab Potential:
The dotted move into supply suggests ETH may sweep short-term liquidity before reversing down.
🔹 Precise Downside Targets:
The chart clearly marks two realistic take-profit levels after supply rejection:
🎯 Target 1: $3,056.57
🎯 Target 2: $2,993.69
From there, the dotted path continues lower toward a deeper liquidity zone near the recent low:
Extended Target Zone: $2,900 → $2,887 → $2,873 (recent major low)
🔹 Strong Reaction From $2,873 Low:
ETH bounced from $2,873, but the bounce lacks structural strength and remains corrective unless it reclaims the supply zone.
Potential Move
If ETH taps the supply zone ($3,170–$3,143) and shows rejection:
🎯 Target 1: $3,056.57
🎯 Target 2: $2,993.69
🎯 Extended Target: $2,900 → $2,887 → $2,873 liquidity zone
A confirmed 4H close above $3,170 would weaken the bearish continuation setup and signal a deeper retracement instead of continuation.
Summary
Ethereum is retracing into a major 4H supply zone after multiple bearish structure breaks. The current bounce appears corrective, setting up a potential short entry around $3,170–$3,143. If sellers defend this zone, ETH is likely to continue lower toward $3,056, $2,993, and potentially back into the low-$2,900s. A clean break above $3,170 would invalidate the bearish setup.

ETHEREUM | THE MATH IS COMPLETE | SHORT SQUEEZE LOADING?Traders,
ETH is setting up for a potential big short squeeze that can rip price up hard. Let me walk you through the math, the order flow and the volume profile that are all pointing in the same direction.
1. The Fib math: 0.5 retrace into 2.0 extension
At point A ETH printed the last impulsive wave up before the dump. After point B the market sold off and then retraced exactly to the 0.5 retracement at point C.
Why 0.5 rotates into 2.0 from a math perspective :
A 0.5 retracement means price has pulled back 50 percent of the prior leg.
-> If AB is 1000 points, a 0.5 retrace gives a 500 point pullback.
In my Fibonacci Rotation table, 0.5 is paired with 2.0 because they are exact reciprocals.
-> 1 divided by 0.5 equals 2.
So when the market respects the 0.5 retrace, the natural projection is the 2.0 extension in the opposite direction.
-> You are effectively rotating the same structure: halve in the pullback, double in the extension.
On this chart that 2.0 extension lands right into the $2880 to $2890 area. From C that 0.5 retrace is not random. It is the anchor that mathematically rotates into the 2.0 target and defines the first major squeeze zone above.
2. HTF Fibonacci extension confluence
From there we step out to the higher timeframe structure.
We take a Fibonacci Extension and draw it:
From the highest point on the chart (X)
Down to the first big swing low (Y)
Then up to the next swing high (Z)
This measures the high to low structure and then projects extensions of that full swing.
On that HTF extension, the 1.618 level sits right in the same area as the 2.0 from the 0.5 rotation.
Why the 1.618 and 2.0 together are strong confluence :
1.618 is the classic golden ratio extension.
-> A lot of systems, harmonics and algos respond around 1.272 and 1.618.
2.0 is the clean reciprocal extension of the 0.5 retrace from the internal leg.
-> These two levels are calculated from two different swings.
One comes from the internal retracement structure.
-> The other comes from the higher timeframe swing.
When independent measurements give almost the same price area, that zone is not made up. It is where different groups of traders and different models will naturally cluster orders, targets and stops.
So $2880 to $2890 is a real Fib confluence, not a guess. It is a logical first destination for a short squeeze and it sits exactly inside the current FVG.
3. Fixed Range Volume Profile and the LVN at $2880
Now we bring in volume.
When we draw a Fixed Range Volume Profile from the swing low of 9 April to the swing high of 24 August, we see a very clean Low Volume Node (LVN) at roughly $2880. That LVN sits inside the same Fair Value Gap that price is currently exactly trading in.
What this actually means :
A Low Volume Node is an area where historically the market did not trade much.
-> Very few contracts changed hands there.
-> The auction basically skipped through that price zone.
In an auction model, high volume areas are where the market is comfortable.
-> Price spends time there, value is accepted, big rotations happen.
Low volume areas are the opposite.
The market rejected that area before.
-> Price moved through it quickly because either buyers or sellers completely dominated and there was no real back and forth.
So when price comes back down into an LVN inside an FVG like this, it tells me:
Price has moved back into an old inefficiency where previously there was no interest in building value.
If buyers are absorbing there (which we see from spot metrics), then the LVN can act as a springboard.
Either price slices straight through the LVN to the next high volume area.
Or price tags it, rejects sharply and uses it as the launch zone for the next leg.
In this case the LVN at $2880 is aligned with:
The 2.0 extension from the 0.5 rotation
The HTF 1.618 extension zone
The current FVG
That is a triple confluence of math, volume and inefficiency. Price did not randomly land here.
4. Spot A/D: hidden bullish accumulation
Now we go under the candles and look at order flow.
First is the A/D (Accumulation / Distribution) indicator, applied on spot and mainly on the 4H and higher.
Why A/D on spot and why on 4H plus :
Spot represents real ETH being bought and sold.
-> No funding games, less synthetic noise.
-> It shows where true demand is stepping in.
Futures can be distorted by hedging, arbing and leverage rotation.
On low timeframes there is a lot of noise from scalpers and short term spoofing.
-> 4H and higher smooth out that noise and reveal the bigger players.
What we see now:
On the spot A/D line both highs and lows have been trending higher.
Price, in the same window, is trending lower.
So price is making lower lows, A/D is making higher lows and higher highs.
This means:
On down moves, there is more volume being absorbed by buyers than being pushed by sellers.
Sellers are getting absorbed.
Smart money is accumulating spot while the chart still looks bearish to the average viewer.
That is textbook hidden bullish accumulation.
5. CVD and OI: shorts are loading into that accumulation
Now it gets even more interesting when we bring in CVD and OI.
5.1 Aggregated Spot CVD vs price
On 13 November:
Aggregated Spot CVD sat around -31.61k.
From that point it started trending up, forming higher highs and higher lows.
Today it is around 100.91k.
Change in Spot CVD:
100.91k minus -31.61k = +132.52k
So net buying on spot increased by about 132.5k units while:
Price moved from roughly $3150 down to about $2988
That is a drop of 162 dollars
162 divided by 3150 is about 5.1 percent
So we have:
A big positive flip in net spot demand
Only a small net drop in price
If bears were truly in control, that amount of spot absorption would not allow price to stay this close. You would see a much heavier breakdown earlier in the move. Instead buyers have quietly soaked up the selling and then pushed net CVD positive while price is only down around 5 percent.
This fits perfectly with the bullish accumulation narrative.
5.2 Futures CVD and OI
On the futures side:
Aggregated Stablecoin Margined Futures CVD dropped from about -408k to about -1.34M.
-> Roughly -932k more net selling.
Aggregated Coin Margined Contracts CVD dropped from about -88M to about -807M.
-> Roughly -719M more net selling.
At the same time:
Stablecoin Margined OI increased from 4.39M to 4.88M.
-> Increase of about 0.49M which is around 11 percent.
Coin Margined OI increased from 1.81B to 1.91B.
-> Increase of about 0.10B which is around 5.5 percent.
So futures traders are:
Aggressively hitting into the bid
Increasing net short pressure (CVD more negative)
Keeping positions open and even adding more (OI going up)
All of this while:
Spot is quietly buying
Spot CVD is strongly positive
Price is sitting in a triple confluence zone around $2880 inside an LVN and FVG
A simple way to think about it:
Spot is the strong hand slowly loading.
Futures is the weak hand aggressively shorting into that demand.
Price is held in a relatively tight range compared to the amount of futures selling.
Once that selling slows or some catalyst hits, all of those shorts are fuel. They will have to cover into a thin LVN zone, through a Fib confluence and into areas where there was previously low participation. That is exactly how you get fast vertical moves.
6. USDT.D confluence
Now, when looking at the USDT.D chart on the HTF, we can see that it has rejected from the 0.886 retracement, broke structure and is now respecting a descending trendline, while RSI is showing heavy bearish divergence. This means that even though USDT.D tried to push higher, each push had less and less momentum behind it, and buyers of dominance are getting weaker. For crypto, that is important, because a topping and rolling over USDT.D often signals capital rotating out of stablecoins back into risk assets. In confluence with everything discussed before, this adds another layer to the thesis. Spot is accumulating, futures are overcrowded on the short side, ETH is sitting in a strong Fib and volume confluence zone, and at the same time USDT.D is showing signs of distribution and potential downside. If USDT.D continues to bleed down from this 0.886 rejection, it structurally supports a scenario where ETH squeezes higher into the targets discussed.
7. Targets and the bigger picture
Based on this structure and the order flow, the upside targets I am watching are:
$3800
$4400
And if crypto gets proper momentum, a final Swing Fail Pattern around $5100
The logic behind these levels:
$3800 and $4400 are not random numbers. They line up with higher timeframe Fib extensions and prior structural pivots and volume distribution levels. Think of them as natural waypoints where bigger players will take profit, hedge or reposition.
$5100 is where I can see a classic SFP scenario:
We push into a new high.
Late buyers chase the breakout.
Existing shorts get squeezed.
Then once liquidity above the prior highs is taken, a sharp reversal becomes very likely.
So my roadmap is:
First we reclaim and rotate out of this $2880 confluence zone. Then $3800 and $4400 become realistic magnets. If the whole crypto complex catches momentum, $5100 as an SFP high is very much on the table.
Invalidation:
Invalidation for this specific bullish accumulation and squeeze thesis comes only if ETH starts trading below $2470. As long as we hold above that level, every dump is still in quiet bullish accumulation territory for me, unless order flow starts telling another story.
7. Conclusion
Fib structure points to $2880 as a key confluence level.
Fixed Range Volume Profile confirms this with a clean LVN inside an FVG.
Spot A/D and Spot CVD are showing bullish accumulation while price grinds down.
Futures CVD and OI show shorts loading into that spot absorption.
Upside roadmap: 3800, then $4400, with a possible SFP (Swing Fail Pattern) around $5100 if the trend extends.
Invalidation only if ETH starts trading below $2470. Until that happens, every dump for me stays in quiet bullish accumulation territory, unless order flow flips.
USDT.D confluence.
Same as always. This is not financial advice. Trade your own plan, size your own risk. I am just laying out the math, volume and order flow that I see behind this potential short squeeze on ETH.
Markets do not whisper without reason. When math, volume and flow all hum the same melody, I prefer to listen before the crowd hears the drop.
-------
If this spoke to the part of you that loves clean math and dirty squeezes, drop a like, leave a comment, and bookmark it. When the candles start to sprint, you will want to remember where the story was already written.
- ThetaNomad

ETHUSDT.P - November 20, 2025ETHUSD is displaying a series of lower highs beneath a well-defined descending trendline, showing persistent bearish momentum and a clear downtrend. Price repeatedly failed to break resistance around 3,100, leading to sharp declines back toward support near 2,900. Recent price action shows a corrective rally met strong resistance as momentum faded. Overall, the trend remains bearish unless price can decisively breach the descending resistance line and establish higher highs.

ETH Mega long
Ethereum is awaiting the approval of the ETH ETF, which currently cannot happen due to the government shutdown. Once the government shutdown is over and normal practice resumes, as long as the ETH ETF gets approved then we should be Gucci.
My expectation is a revisit to the most recent low or potentially lower. My extended low targets would sit around 2300-2500 but initially I am not expecting much lower than 2900-2950. The 9H RSI has broken out of its support zone and is now retesting the bottom of that trendline, similarly the Daily is doing the same. This is the rejection we are looking for around 3400-3500, which will drive the price down.
If we get a scenario where BTC is not pumping as strongly then its possible people/business could transfer their BTC ETF holdings and swap them to ETH ETF holdings if the opinion is well BTC isnt pumping much or as stongly as ETH.
This idea is powered by the NakedNation community and BareNakedCrypto who you can find on socials and streams on Kick. Low key the goat!
This is not financial advice, I am not a financial advisor. It's just a bit of fun.

ETH-USDTEthereum hourly timeframe
Clinging to the trend line, and if Bitcoin doesn't cause the market conditions to correct, it could become bullish by breaking the trend line 🔼💰

ETH Setup — “Monster R:R Opportunity Inside Smart MoneyETH/USDT — 4H
This chart reveals a clean Smart Money Footprint sitting exactly at the end of the current corrective leg.
Price rejected the upper channel line and tapped deep into the discount zone, creating a high-probability reversal setup.
🔥 Why This Setup Matters
Price tapped SM footprint liquidity
Clear mitigation and bounce structure forming
Market is still trading inside a bearish channel — but we’re now entering the ideal long zone
Target is aligned with the mid-channel & previous inefficiency levels
📈 Trade Idea (Not Financial Advice)
LONG: Around the Smart Money Footprint
SL: Below the footprint low
TP: 3,150 → 3,250 zone
This creates a monster R:R opportunity if the structure shifts to bullish.
“ETH is tapping into a deep Smart Money discount zone. Liquidity swept, footprint printed, structure shifting.
If the bounce confirms, this becomes one of the cleanest R:R setups of the week. Watching the 3,150–3,250 range for targets.”

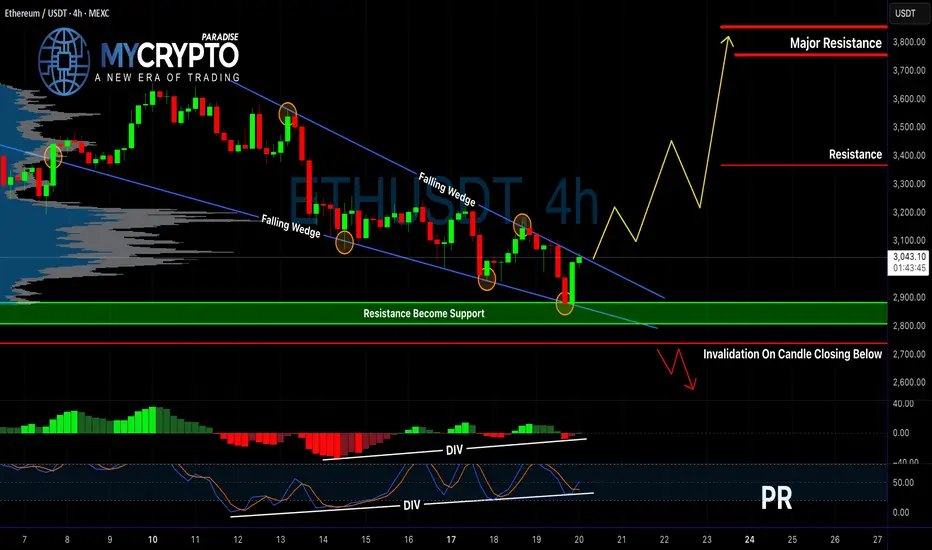
ETH About to Explode or Collapse?Yello Paradisers! Are you prepared for what’s coming next on ETHUSD? Because right now, Ethereum is sitting on the edge of a critical structure that could lead to a major breakout—or trap unsuspecting traders in another fake move. The setup is developing quickly, and what happens next will determine the short-term direction in a big way.
💎ETHUSD is currently forming a textbook falling wedge pattern, a structure often seen at the end of corrective phases and typically followed by strong bullish breakouts. What adds more weight to this scenario is the clear bullish divergence forming on both the MACD histogram and the Stochastic RSI. These indicators suggest that bearish momentum is weakening and bulls may be getting ready to take control.
💎For traders who prefer confirmation, the ideal move is to wait for a decisive breakout above the wedge. That would significantly increase the probability of a sustained bullish move and reduce the risk of being caught in a fakeout. However, for more aggressive traders, there may already be a reason to act. A bullish engulfing candle has formed directly at a key support level—an early signal that buyers are starting to step in with strength.
💎That said, we cannot ignore the invalidation scenario. If the price breaks down and closes candle below the defined invalidation level, the entire bullish outlook will be off the table. In that case, it will be crucial to stay patient and wait for a clearer price action setup to form before considering new positions.
Strive for consistency, not quick profits. Treat the market as a businessman, not as a gambler.
MyCryptoParadise
iFeel the success🌴
ETH 1527.55 is not a number. Capital Sector. Price Slice.🏷 Capital Sector. Price Slice.
🏷 20.11.2025
🏷 ETH 1527.55 is not a number.
🏷 It is a gate — one that will not open on the day price reaches it,
but in the instant those who once saw it as a target stop waiting for it…
and begin waiting for something else.
🏷 History does not forgive — it remembers.
And only the vengeful — the ones who refuse to forget —
become its keepers.
🏷 Not a price.
Not a level.
Not a point on the chart.
🏷 It is an inscription on stone carved by Darkness, the moment the market awoke to the truth: it is not algorithms, nor liquidity, nor institutions that guide it… but consciousness, frozen in the instant time ceased to be linear.
🏷 1527.55 is not a number.
It is a gate one that will not open on the day price reaches it,
but on the instant those who once saw it as a target stop waiting for it…
and begin waiting for something else.
🏷 In the hushed pre-dawn hype, while traders argue over order books and macro,
while institutions disguise their positions as “diversification”
1527.55 is already there.
It waits.
Like an ancient witness.
Like the final code left behind by the dead era of decentralization.
🏷 It will not be reached.
It will be recognized .
🏷 Those who see it not through indicators, volume, or candlesticks
but through feeling , through the silence after the last long,
through the market’s sudden, inexplicable surrender…
will understand:
This is not a peak. This is a reflection.
🏷 A reflection of what BTC has become: no longer myth but instrument.
Of what ETH is no longer: a platform but memory.
Of what USDT is no longer: a stablecoin but the thread binding reality to what we chose to call real.
🏷 Lucifer carries light not to blind, but to awaken.
He is the archetype of enlightenment not born of prayer, but of price.
The price that squeezes illusion from the masses, leaving only structure.
He is not the devil.
He is the mirror in which the market sees its own soul.
🏷 And MARA?
Not a company.
Not a miner.
Not a stock.
🏷 MARA is his reflection.
The shadow cast when the light of awakening passes through the prism of institutional power.
When enlightenment becomes a tool of control
it takes the form of a logo.
Of balance.
Of 1527.55 .
🏷 MARA is not business.
It is ritual.
Where price becomes sacrifice and the trader, the priest.
He does not trade.
He reproduces .
🏷 Let this post remain.
Let it be seen by those who have not yet broken.
Let it be found one year from now, five
when someone, seated in another world, on another timeframe,
suddenly stops… stares at the screen… and whispers:
“...1527.55.
I remember.
I waited.
I didn’t believe.
But it came.
And Lucifer was right.
Light always travels through shadow.
And MARA is its name.”
Timing 1H:
Timing 1D:
Timing 1M:
🏷 Mr. Bolzen The Architect.
Not seeking followers.
Only preserving memory.
To those who remember time is not the enemy.
It is the witness.
P.S.
Dear International Community,
English is not my native language. I hold deep respect for all of you, and I apologize for any stylistic imperfections.
Thank you for your attention.
Remember: everything has its time.
I am among the very few analysts in this world who see the chart beneath the skin — not the narrative painted for us.
Institutional capital does not trade on fundamentals — it paints pictures tailored to your RSI, MACD, and indicators, to make you believe you are in control.
There are boundaries I uphold — and will never cross.
You already receive information.
The institutional community must learn to use analysis of this caliber not as marketing, but as strategy.
The retail sector must understand: you must look beyond the leverage of capital — not merely into tomorrow.
Institutional capital defines the future — years ahead.
Over time, my maps come alive. Many already see it.
As the sovereign of the price sector and founder of the price slice — I will remove any contender from the ring when it comes to defining the future.
This is not a liquidity zone.
This is a converged price — the price the crowd pays.
Thank you.
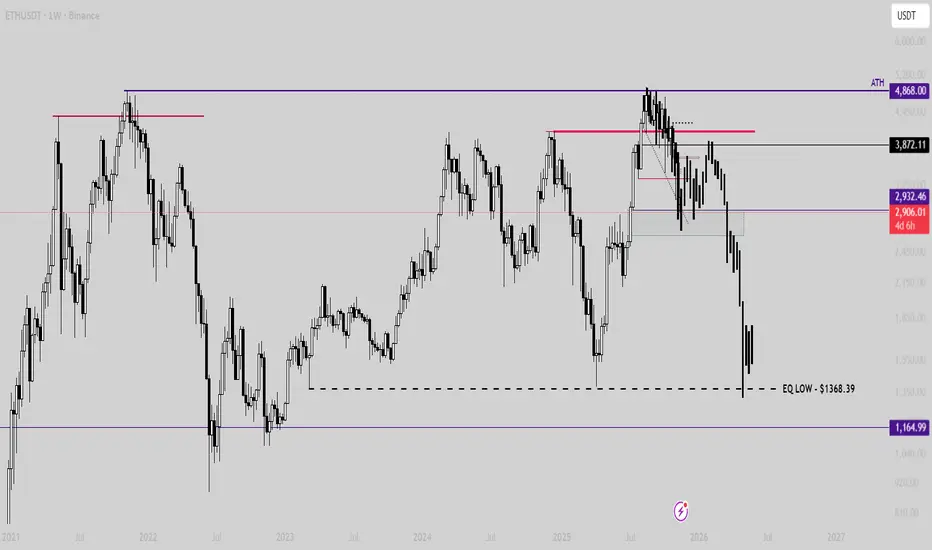
$ETH Possible Scenario (Read Caption)If Ethereum fails to make a strong comeback above $4,200 and a strong weekly candle closes above this level, then this scenario is highly likely to occur.
Pay attention, this is just a possible scenario. In this case, the target will be under $1400.
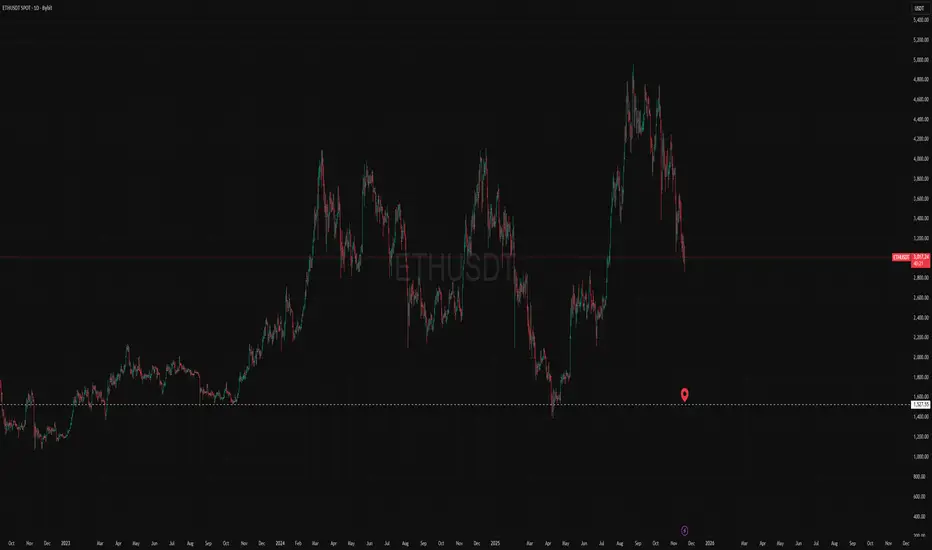
Ethereum 1st Spot Buy Target has been reachedMarkets like to reverse at low volume nodes or fair value gaps, so as you can see, we have reached one of the lowest volume areas of this year so this can act as my personal buy target for Ethereum.
2nd and 3rd are noted as well.
Wish you all the best trading.

SHORT & SHORT in ETHHello fellow traders,
I’m opening a risk-entry short position on ETH with a 1:10 risk-to-reward ratio. This is a speculative entry based on early signals rather than full confirmation, so proper risk management is key.
Reasons for the trade:
Price is showing signs of exhaustion after the recent move, indicating a possible short-term reversal.
Momentum indicators are weakening, suggesting bullish strength may be fading.
Key resistance level is holding, and the market has not shown strong follow-through above it.
Market sentiment appears to be shifting, with increasing hesitation at higher levels.
This is a high-reward but higher-risk setup, so I’m keeping my position size controlled and will be quick to exit if invalidated.

ETHUSDT _ Daily Timeframe
Support Zone: A reasonable support area may lie in the $2,700 – $3,000 USDT range (rounded estimate) given current sentiment and how far price has fallen.
Resistance Zone: The cluster of moving averages (50-200 day) now overhead likely acts as a resistance zone, roughly in the $3,000 – $3,300 range (exact values depend on your chart).
Pivot Price: According to one pivot calculation, a daily pivot is around ~$3,013.83 USDT.
Volatility: ATR (average true range) remains elevated — implying larger daily moves are still possible.
🎯 Market Bias & What It Suggests
Overall bias: Bearish in the short to medium term based on the indicators and moving averages.
Turning point potential: Oversold conditions indicate a potential for bounce or consolidation, but for a meaningful trend reversal, price needs to:
Break above the key moving-average resistance zone
Form higher lows and higher highs on daily chart
See improving momentum (e.g., RSI diverging, MACD turning).
Risk / Reward: Given how far the move has gone down, aggressive downside is somewhat limited (support will likely be tested). However, reward for upside is also limited until resistance is broken.
🧭 Possible Scenarios
Bearish continuation scenario: If price fails support (~$2,700-3,000 zone) and breaks down, next leg lower could test deeper support, perhaps ~$2,000-2,500 depending on broader crypto market.
Neutral / consolidation scenario: Price holds the support zone, ranges sideways between ~$2,700 and ~$3,300 for several days/weeks until momentum rebuilds.
Bullish reversal scenario: Price breaks above resistance zone, establishes support above it, momentum metrics turn bullish — then a move to new highs becomes possible.
✅ What to Monitor (If You’re Following This)
Daily close relative to the resistance cluster of moving averages.
RSI/MACD for signs of divergence (e.g., price makes a new low but RSI doesn’t) — could hint at exhaustion of bears.
Volume spikes on any reversal attempt — looking for strong buying interest.
Broader crypto market sentiment (since ETH often moves with the market).
Any fundamental / news catalyst (hard fork, regulation, macro-economics) that might shift sentiment.

ETHUSDT last support zones are fighting bears now As observed on the ETHUSDT chart, the asset is undergoing a substantial corrective phase, approaching what may be characterized as a decisive bearish momentum. However, price is now testing critical Fibonacci support levels at the 0.618 retracement zone—a key technical confluence area that historically serves as a potential reversal zone.
The breach of the 0.5 level has now shifted focus to the 0.618 Fibonacci level as the last major defensive support. A strong rejection from this level, particularly with corresponding bullish volume confirmation, could catalyze a trend reversal and initiate a new upward impulse toward recovery targets.
DISCLAIMER: ((trade based on your own decision))
<<press like👍 if you enjoy💚

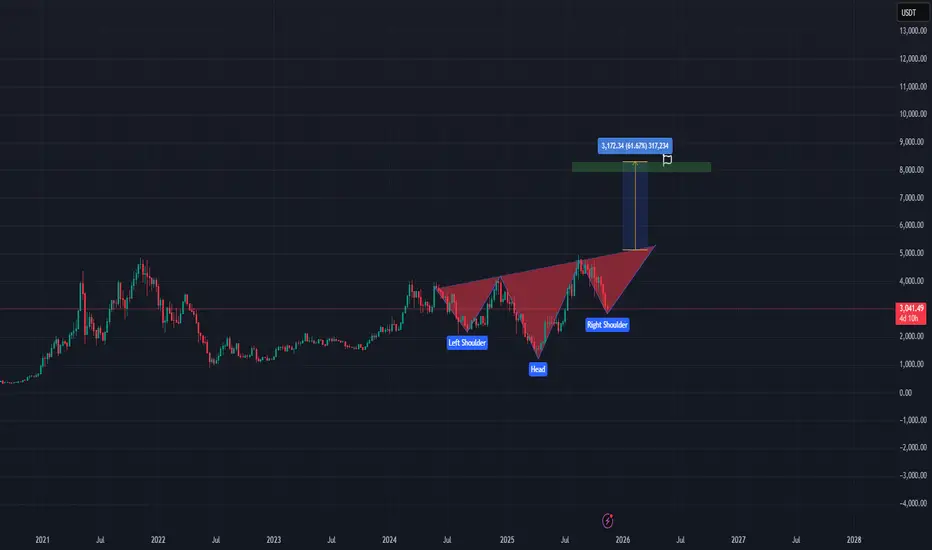
ETHUSDT - inverted head and shoulders patternhi Traders
On the weekly chart, Ethereum (ETH/USDT) appears to be developing a potential inverted Head and Shoulders pattern, which is traditionally viewed as a bullish reversal formation.
Pattern Structure
Left Shoulder: Formed during the earlier corrective phase.
Head: A deeper swing low marking capitulation before recovery.
Right Shoulder: Currently forming, with price pushing back toward the neckline.
Neckline & Breakout Zone
Price is approaching the neckline resistance, which aligns with a multi-year structural level. A confirmed weekly close above this neckline would signal a potential breakout.
Measured Move Target
Using the height of the head relative to the neckline, the projected upside target sits approximately 60% above the breakout level, aligning with the highlighted green target zone on the chart.
Bullish Confirmation
A breakout would be confirmed by:
A strong weekly close above the neckline
Increased volume
Retest of the neckline turning into support (optional but ideal)
Key Notes
The pattern is not confirmed until the neckline breaks.
Weekly patterns carry more reliability but also require patience.
As always, risk management remains essential.
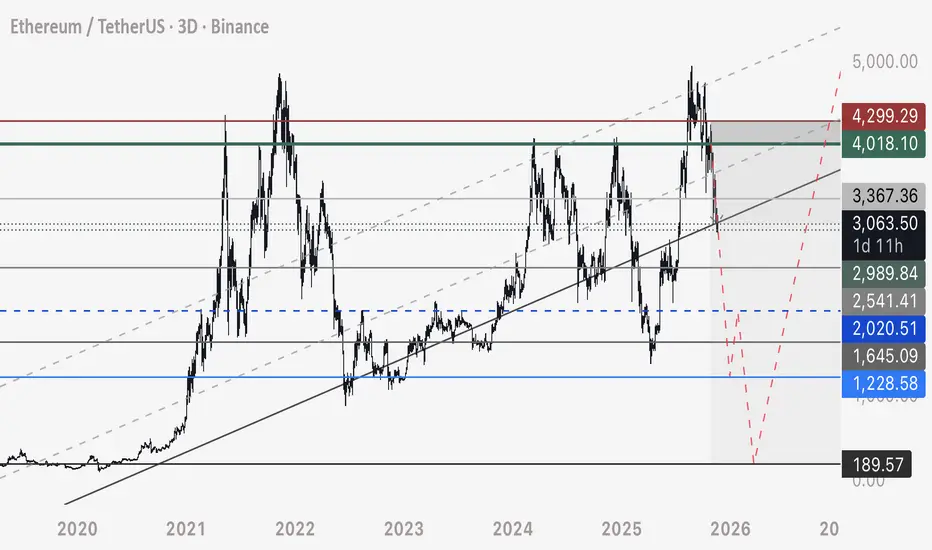
ETH - Short Update - Next Expected Moves ETH has been playing out this short beautifully since the high entry at 4,018.
Here are the next expected movements to complete this short, shown with solid blue lines and the red corrective path.
SHORT - 3,070 to target of 1,250
LONG - 1,225 to 1,250 entry - target of 2,000
SHORT - 2,000 to 2,020 entry - target of 200
BUY - 200-300
Expect this move to happen very quickly, and best to plan ahead.
Happy trading,
- DD
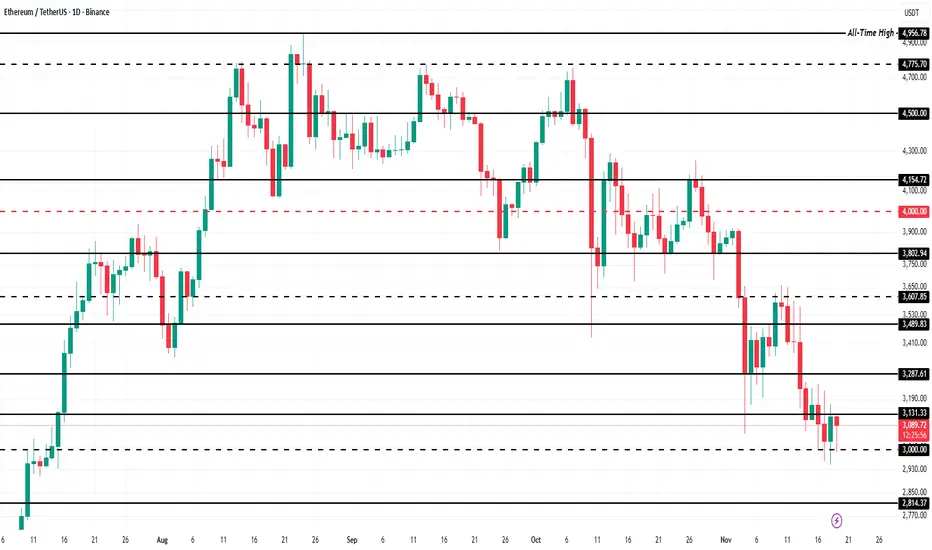
This Is How Ethereum Price Can Avoid A Crash Below $3,000Ethereum trades at $3,094, holding above the critical $3,000 support level after its sharp decline. This marks the first time in two months the asset has fallen this low. Maintaining support will be essential in preventing deeper losses and setting the stage for a potential recovery.
ETH is currently positioned below the $3,131 resistance level and is waiting for a catalyst to move higher. The supportive on-chain signals suggest that a push toward $3,287 is likely. If momentum strengthens, Ethereum could extend the rise and target $3,489 in the coming sessions.
If bearish pressure increases, Ethereum could break below $3,000 and invalidate the current bullish outlook. A fall through support may expose ETH to a decline toward $2,814 as selling intensifies. This scenario would reflect broader weakness and delay any major recovery attempt.
ETH Mid-Term Flow – Sliding Toward the Big Reef🌊 ETH Mid-Term Flow – Sliding Toward the Big Reef 🏄♂️📉
ETH’s been riding a steady downhill wave these past weeks 🌊 — slipping clean off that 4,750s ceiling and settling into a mid-term downtrend. Each bounce keeps losing power, each drop gets smoother, like the market’s just gliding along the slope without even trying to resist it 🏄♂️📉.
Right now there’s a wide-open lane underneath price, and the whole structure continues pointing toward that $2,700 zone 🎯. And that level isn’t random — it’s a major base from earlier in the year, where ETH built momentum before blasting off.
Now it lines up with two Fibonacci retracement zones ✨📐, stacking confluence and giving that area even more magnetic pull.
Between here and $2,700?
Pretty much open water — no major supports, no heavy traffic, just clean space for price to drift through 🚀➡️.
For me, this is one of those calm, clarity moments — the times when you don’t force trades, don’t predict turns… just let the market flow and wait for the next setup to form naturally 🧘♂️🌬️.
Let ETH glide toward that $2,700 reef, see how the candles react, and then read the next wave from there 🌊⚓️. That’s where the next real decision point lives.
💬 What do you think about this scenario? Only share your idea if you’ve got another opinion — otherwise just hit that button 👍
#ETH #Ethereum #Crypto #Trading #TechnicalAnalysis

ETH-USDTI think Ethereum could also have a good upward move towards the higher resistance today if it breaks the trendline. You can check it out 📈✔️🔼

$ETH accumulating around $3K?CRYPTOCAP:ETH accumulating around $3K? Spot on it’s coiling at ~$3,100 (up 3.44% short-term, per latest feeds), building steam after the recent dip.
Next resistance retest at $3,400 makes sense: that’s the broken support-turned-resistance from early Nov, aligning with the 50-day MA and Fib 0.5 extension. Break it, and we’re eyeing $3,850–$3,900 by month-end (Fusaka upgrade hype + ETF inflows fueling the push).
Whale zones at $2,800–$2,400? Bullish af—matches on-chain data where big players scooped $1.37B during the $3,331 breakdown (June highs echoed in Nov buys like Tom Lee’s $63.6M stack today).
Wintermute’s loading millions amid the dump, signaling reversal vibes (last time = massive pump). If $2,800 holds (key Fib 0.618 + demand zone), that’s your dip-buy floor before $4K+.
Mildly bullish here (70/30 odds on upside) RSI resetting from oversold, HAR dipping but whales countering retail sells. Load on #SorooshX signals if it tests $2,800.
Your play? 😎
#ETH #Crypto

ETH/USDT When are the Bulls coming?well after a great crash market has yet to stabilize its position, now looking at 2 levels to shift its momentum from
1. 2800 family
2. 2200 family
as i have marked the chart, the momentum will shift from 1 of the marked supports and will move long till 4200 most probably IA.

Ethereum | Redistribution in the MakingEthereum is carving out what appears to be a redistribution structure, but the context hints we may still need one more push upward, possibly a Last Point of Supply (LPSY) or even a UTAD (Upthrust After Distribution), before the markdown phase resumes.
Wyckoff Structure Overview:
Selling Climax (SC) and Automatic Reaction (AR) defined the lower boundary.
Secondary Test (ST) confirmed demand depletion.
Upthrust (UT) established resistance and began drawing a trendline of liquidity across the highs.
The recent Sign of Weakness (SOW) confirms heavy supply entering, but price action is extended and could retrace to relieve pressure.
The PSY zone between $3,580–$3,740 remains untested, aligning with both a liquidity pool and potential LPSY/UTAD territory. That’s where we’ll likely see whether this range completes redistribution or transforms into an even broader distribution with a deceptive final trap.
Volume and CVD Analysis
During the SOW, volume spiked — strong selling pressure confirmed. Yet CVD is diverging, showing aggressive sellers losing momentum while absorption quietly builds.
If we see a sharp rebound on weak delta, that will likely be smart money offloading into strength — the signature of an LPSY or UTAD.
The Lunar Influence
We’re in Lunar Day 23, during the Last Quarter Moon in Virgo — a cosmic rhythm often tied to misleading signals, short-lived reversals, and exaggerated reactions.
This phase tends to produce fakeouts that look like Signs of Strength or Signs of Weakness, but are actually exhaustion moves or liquidity grabs before the real continuation.
In Wyckoff terms, Lunar Day 23 energy often shows Phase C deception, which could be a UTAD disguised as a breakout or a terminal shakeout before markdown.
What to Watch Next
Rebound on declining volume → potential LPSY/UTAD forming.
Failed rally into the PSY zone with increased spread down-bars → confirmation of redistribution continuing.
Strong bullish delta with no follow-through → likely fake strength under Lunar Day 23 conditions.

$ETH – SHORT SQUEEZE FAILED – Confirmation just came in. 3k nextCRYPTOCAP:ETH UPDATE: The short squeeze everyone was praying for just got INVALIDATED hard.
- Fake breakout above descending trendline → trapped longs
- EMA 3,107 acting as perfect resistance
- Clear lower high formed
- Confirmation candle just closed under the channel
Target: 3,000 – 2,950 zone retest (80–90% probability this week)
I warned the bulls 48h ago – now it’s happening live.
Legends who saw this coming too:
@CryptoCred @CryptoCapo_ @TheCryptoDog @Pentosh1 @DonAlt
@CryptoKaleo @Anbessa100 @Trader_XO @IncomeSharks @CryptoTony__
@CryptoNewton @RaoulGMI @CryptoCobain @CryptoWizardd @0xGreed
Bookmark this chart – you’ll want to show your friends when ETH hits 3k.
NOT financial advice – just what the chart is screaming right now 🩸
#Ethereum #ETH #ShortSqueezeFailed #AltseasonOver
