$ETH – SHORT SQUEEZE FAILED – Confirmation just came in. 3k nextCRYPTOCAP:ETH UPDATE: The short squeeze everyone was praying for just got INVALIDATED hard.
- Fake breakout above descending trendline → trapped longs
- EMA 3,107 acting as perfect resistance
- Clear lower high formed
- Confirmation candle just closed under the channel
Target: 3,000 – 2,950 zone retest (80–90% probability this week)
I warned the bulls 48h ago – now it’s happening live.
Legends who saw this coming too:
@CryptoCred @CryptoCapo_ @TheCryptoDog @Pentosh1 @DonAlt
@CryptoKaleo @Anbessa100 @Trader_XO @IncomeSharks @CryptoTony__
@CryptoNewton @RaoulGMI @CryptoCobain @CryptoWizardd @0xGreed
Bookmark this chart – you’ll want to show your friends when ETH hits 3k.
NOT financial advice – just what the chart is screaming right now 🩸
#Ethereum #ETH #ShortSqueezeFailed #AltseasonOver
Trade ideas

Liquidity Hunter | Smart Money PlaybookSmart Money Footprint | Market Structure & Liquidity Trader
Hunting liquidity sweeps and smart money footprints across major sessions.
I break down the market the way institutions move it:
SFP • Break of Structure • Premium/Discount • Session Timing • Fakeouts
Daily charts, scalps, and tactical explanations.
Follow if you want to trade with the real flow — not against it.
Drop a comment once at all this information 🤑🔥❤️📉

ETHUSDT: First Drop To $2100 And Bounce Up To $6500ETHUSDT is dropping nicely and we expect a smooth reversal around $2200. This area looks promising due to the significant volume sitting there. We just need to avoid liquidation. Once the entry is active, you can enter with strict risk management and set multiple take profit levels. This analysis is suitable for all traders from intraday to swing.
Good luck and feel free to like and comment for more!
Team Setupsfx_
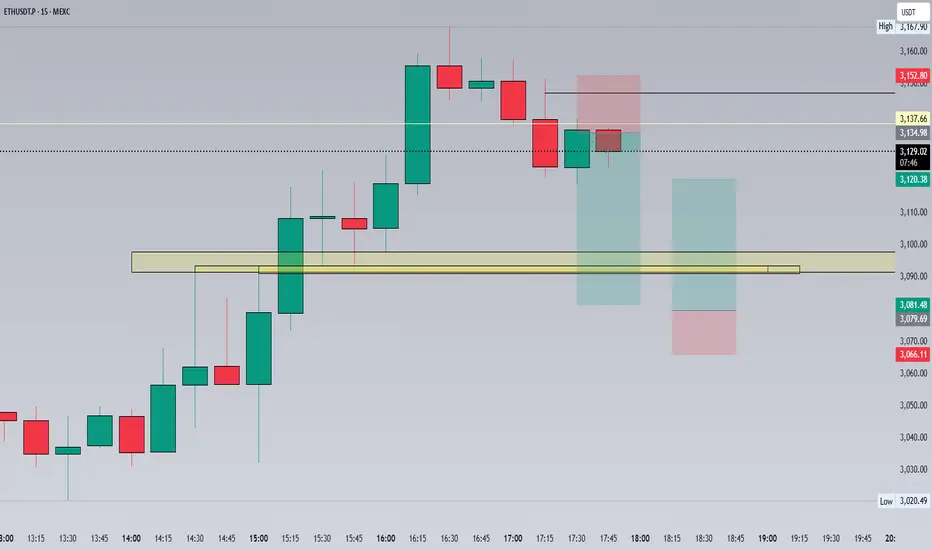
ETH SCALPSLittle briefer is due here
Let's see if we can catch this double up uchi uke ;)
Entries are on 1 minutes charts but tradingview wont allow to post lower than m15 lol
Ethereum (ETH): Expecting $3,650 as First Target | BullishThe recent dip we had on ETH has shown the bullish strength, where buyers did not let sellers take control over that zone. What it means for us is an opportunity for a bullish trade that can be taken here.
The main focus is the $3,650 zone, which is acting as a local resistance area where the 200 EMA is also sitting. If we see a proper MSB form near the current area, we might be in a decent bullish movement (short term for sure).
Swallow Academy

Smart Money Sniper – Catching Moves Before They Happen“Tracking smart money footprints, liquidity grabs, and engineered moves.
I only take sniper-precision entries — no noise, no hype.
If you want real market logic, not retail fantasies… welcome.”

Checking for support near 3472.96
Hello, traders!
Follow us to get the latest information quickly.
Have a great day!
-------------------------------------
(ETHUSDT 1D chart)
This period of volatility is expected to last until November 14th.
After this period of volatility, the key question is whether the price can rise after gaining support near the HA-Low indicator (3472.96) on the 1D chart.
At this point, it's crucial to see if the price can rise above the M-Signal indicator on the 1W chart and maintain its upward momentum.
If the price fails to rise, it is expected to meet the M-Signal indicator on the 1M chart again.
Therefore, to continue the uptrend, the price must remain above the 3239.06-3472.96 level.
The formation of the HA-Low indicator on the 1D chart indicates a significant decline, forming a low.
Therefore, even if the downtrend continues, there's a possibility of an eventual uptrend, so we need to consider countermeasures.
However, if the price meets the HA-High indicator on the 1D chart or falls near the HA-High level, the price is likely to decline until it meets the HA-Low indicator again or the DOM (-60) indicator.
Therefore, we must remember the basic trading strategy of buying in the DOM(-60) ~ HA-Low range and selling in the HA-High ~ DOM(60) range.
If the HA-High ~ DOM(60) range rises, a stepwise upward trend is likely, while if the DOM(-60) ~ HA-Low range falls, a stepwise downward trend is likely.
Therefore, the basic trading strategy should be a segmented trading approach.
To determine trading within the box range and trend trading outside the box range, we refer to the additional auxiliary indicators, StochRSI, TC (Trend Check), and OBV.
To continue the uptrend by breaking above a key point or range, the StochRSI, TC, and OBV indicators must show upward trends.
1. The StochRSI indicator should not have entered the overbought zone.
2. The TC indicator should remain above 0. 3. The OBV indicator should remain above the High Line.
Therefore, it's important to observe the movement around important points or ranges, such as the DOM(-60) ~ HA-Low and HA-High ~ DOM(60).
The next period of volatility will be around November 20th.
-
Thank you for reading to the end.
I wish you successful trading.
--------------------------------------------------

Ethereum: Life or Death?Ethereum: Life or Death?
Hey everyone,
Today I’m seeing some pretty clear signals on Ethereum’s chart.
On the weekly timeframe, we’ve got something that looks a lot like an inverse head and shoulders pattern. If this pattern completes and the price breaks above the neckline zone at 3582–3923, ETH could realistically pump all the way up to around 7500 USDT — something that would definitely make Ethereum holders feel hopeful about the future.
But… there’s also a second scenario — and the bears are going to love this one 🤣
If the price fails to hold the support range at 2196–2352, we could see a drop all the way down to around 900 USDT.
So what’s the smartest move right now?
Here’s the simple answer:
👉 Don’t rush.
It’s better to wait and see how the price reacts to these support and resistance ranges. Based on that reaction, you can decide whether it makes more sense to open a long position or a short one.
Stay tuned for my next analysis to see whether we should turn into bulls or bears 🐮🐻❄️

ETHUSDT at major support , holds or not??#ETHUSDT... market just reached near to his major supporting area for today,
That is around 3002-04
Keep close and buy above .
NOTE: we will go for cut n reverse below that in confirmation .
Good luck
Trade wisley

Elloit wave ETH 11/17/2025We are close to the end of the correction, Expect for another lower high to meet the resistance and then the last lower low to complete WXYXZ correction.

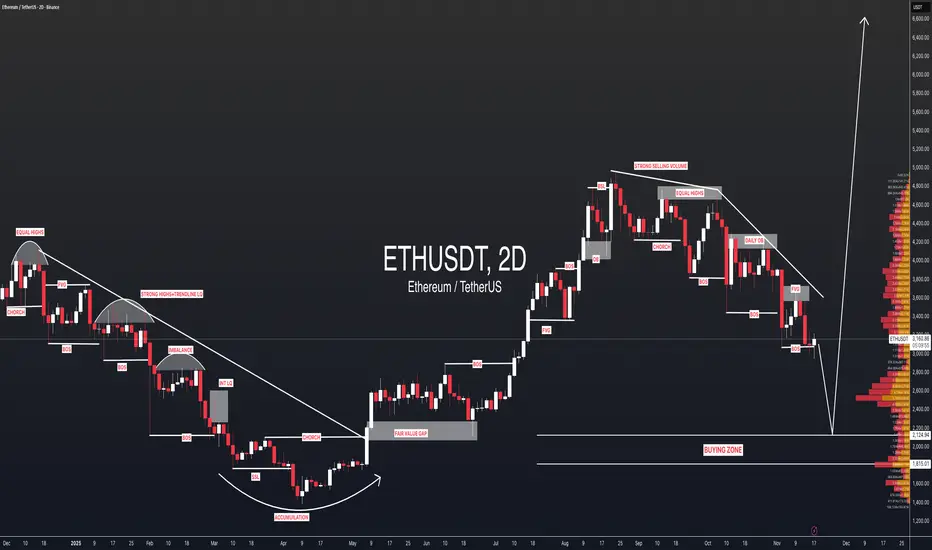
ETHUSDT Weekly Chart – Full AnalysisETH is moving inside a long-term descending wedge/channel pattern, with the upper boundary acting as resistance and the lower as support.
Major Levels: Key horizontal levels include $2,502 (support) and $4,830 (major resistance). The wedge confines most price action since mid-2022.
Recent Action: ETH surged toward the wedge top near $4,830 but faced rejection, leading to the current pullback toward the wedge mid-zone and support. This retracement remains above trendline support and above the last key breakout region.
Bullish Path: If ETH rebounds from the wedge and horizontal support, a breakout above $3,600–$3,800 could re-test $4,830. On a breakout, long-term targets are $6,000+ based on the wedge height and prior cycle moves.
Bearish Risk: If the wedge support fails and ETH loses $2,500, further downside could be seen toward the $1,420–$1,030 area.
Cup & Handle/Accumulation: Multiple rounded bottoms and retests reflect long accumulation phases. A successful move above the wedge would complete this structure and suggest major upside.
ETH is consolidating within a large wedge structure, at support after a strong run and rejection near $4,830. Holding the $2,500–$2,800 zone is key for bullish continuation. A confirmed breakout can trigger a fresh multi-month rally, while a breakdown signals deeper retracement.
DYOR | NFA

ETH/USDT Bearish Momentum Likely to ContinueETH is in a Bearish Trend, and if it breaks its support, it can go further down.
Let's take a 1:1 Short trade here.

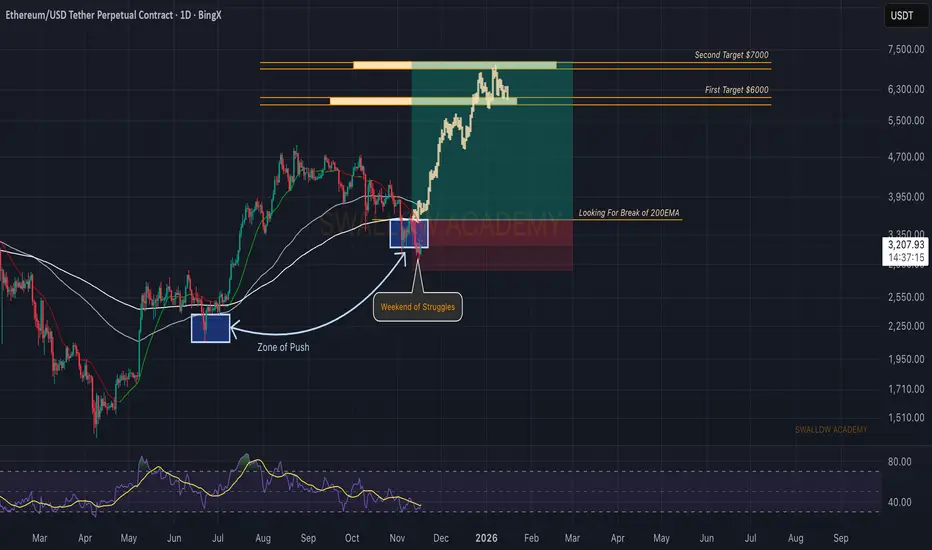
Ethereum (ETH): Weekend of Struggle is Over..........HopefullyThe start of a day looks pretty good for ETH, where buyers are showing dominance and forming MSB on smaller timeframes, which then could lead to bigger MSB on the current timeframe.
$3,240 is the zone we will be looking at for MSB to form; once we get that structure break, we will be aiming for 200 EMA to be reached and broken. (After that, we would be open to another set of long trades).
Swallow Academy
DeGRAM | ETHUSD will rebound from the support area📊 TECHNICAL ANALYSIS
● The chart shows Ethereum forming a broad symmetrical triangle (from June to Nov), with price currently near the lower trend-line support (approx $3 000) and facing a descending dynamic resistance line. A bounce at the support zone suggests buyers are stepping in.
● Price action indicates a test of the key accumulation zone around $3 000–$3 100 (green area). A successful rebound toward the descending resistance (~$3 600-3 800) and subsequent break could signal the start of the next upward leg (wave count suggesting completion of corrective triangle).
💡 FUNDAMENTAL ANALYSIS
● Despite recent weak sessions, the upcoming Fusaka upgrade (early Dec 2025) brings network improvements for Ethereum (lower fees, better scalability), which supports long-term bullish structure.
● Major institutional accumulation is shown by growing net supply increase (+18 262 ETH over one week) and large investors building positions, signalling underlying conviction even amid market pullback.
✨ SUMMARY
● Long bias: expect rebound from ~$3 000–$3 100 support zone.
● Key trigger: hold support + break above ~$3 600 resistance for continuation.
● Targets: initial move toward ~$3 600-$3 800, with broader potential beyond thereafter given upgrade tailwinds.
● Risk: if support fails (~$3 000), downside opens.
-------------------
Share your opinion in the comments and support the idea with a like. Thanks for your support!

Ethereum (ETH): Now of Never | Betting on This WeekETH looks good and bad at the same time. While price has broken the bullish trend on which it has been bouncing for quite some time and which again should mark a midterm bearish market, the gut feeling tells us differently.
A strong wipeout happened last week, where the current week started with a strong bullish candle (just as the US exited the shutdown).
It seems like good momentum is building up here so waiting for the price to reach and secure once again that bullish trend, which then would openor us a trading setup.
Swallow Academy

ETHUSDT: Rebound Setup from Broadening Wedge SupportETH is currently respecting the lower boundary of a broadening wedge pattern, a structure known for sharp reversals once price taps the support zone. The latest reaction shows buyers defending this area, indicating a potential upside move.
Entry: Current support area of the broadening wedge, below $3200
Stop-Loss: $2900
Take-Profit: 10%, 20% , 40%
Cheers
Hexa

ETH — Signs of StrengthEthereum has printed a lower low at point B, but quickly reclaimed the low of A — another sign of strength despite overall market weakness.
From a Wyckoff perspective, the elevated volatility around A may indicate a Selling Climax (SC), where panic selling was actively absorbed. The lower low at B followed by a sharp recovery fits the structure of a Terminal Shakeout, which reduces the floating supply before a potential Mark-Up phase.
Price is currently interacting with the descending R-line. A breakout above this level may signal the start of a bullish impulse.
What I expect next:
— Potential bullish breakout above the R-line
— Formation of a local uptrend within the channel
— Move toward the 3,350–3,450 resistance zone, where the mid-term trendline is located (marked as Target)
— Possible confirmation of a shift toward a more bullish market tone heading into the new week

Ethereum trading around the $2,900 supportEthereum is trading around the $2,900 support, a structural level that has been repeatedly defended. Momentum is slowing, but buyers still have control while price remains above this region.
A corrective rally toward $3,425 can unfold from here, as this level aligns with the 0.618 Fibonacci and represents a potential lower high within the broader downtrend.
Key Points:
- Key support at $2,900
- Target at $3,425 aligns with 0.618 Fib
- Structure still bearish unless $3,425 is reclaimed
What to Expect:
Expect a bounce toward $3,425 unless $2,900 is lost on high volume.

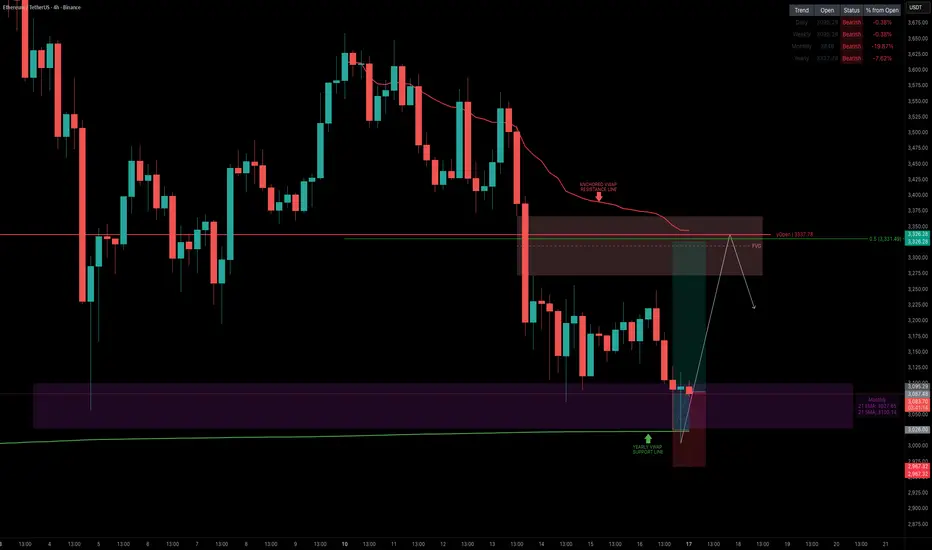
ETH — The $3,000 Rebound Zone: Multi-Confluence SupportETH has reached a key level around $3,000, a major psychological zone that also aligns with multiple high-timeframe supports. The yearly VWAP sits at $3,023.5, providing the first layer of confluence. Additionally, both the 21-month EMA ($3,028) and the 21-month SMA ($3,100) cluster tightly in this region, reinforcing it as a strong structural support zone.
This creates a long setup with a clear invalidation below the $3,000 level. The primary target is the 0.5 Fibonacci retracement at $3,331, which lines up closely with the yearly open at $3,337.78. This area also contains a fair value gap and the anchored VWAP, forming a solid resistance cluster and a logical take-profit zone.
Support and resistance levels are well-defined, and the trade structure is clean.
R:R ~1:5 if entering directly at the yearly VWAP support
R:R ~1:2 if entering at current price levels
Overall, ETH is positioned at a high-probability long zone with strong multi-confluence support and a clear upside target.
🔍 Indicators used
DriftLine — Pivot Open Zones → For identifying key yearly/monthly/weekly/daily opens that act as major S/R reference points
Multi Timeframe 8x MA Support Resistance Zones → to identify support and resistance zones such as the monthly 21 EMA/SMA.
VWAP
➡️ Available for free. You can find it on my profile under “Scripts” and apply it directly to your charts for extra confluence when planning your trades.
_________________________________
💬 If you found this helpful, drop a like and comment!
Bearish!!ETH Market updates (Based on current price 3164)
- Below EMA 50, 200
- Showing lower highs, lower lows
- No bullish reversal signal
- No bullish divergence
- Heavy selling volume
- Weak buyers above 3150
This thesis keeps short valid

ETHUSDT.P - November 17, 2025Price has broken below the rising trendline from the ~3,000 area and is now likely to retest it from underneath, showing potential continuation toward the next support near 3,020. A rebound remains possible if price reclaims 3,140, with major resistance sitting at 3,240. Overall, the market is trading between 3,020 support and 3,240 resistance, with momentum currently favoring the downside unless the trendline is regained.

Moon or DoomScratching on this longer term support. I’m 51% in favour of bounce. Let’s see whut the MM’s say, even a bounce will likely fake out below the support line 😂

ETHUSDT RETEST & REVERSAL AHEAD📉 Technical Analysis: Ethereum (ETH/USDT)
The price action is currently showing a downtrend following a significant drop from the highs around $4,800. A major 4-hour Support zone, previously established around $3,700 to $3,800, was decisively broken to the downside in early November. This support now acts as strong resistance.
Following the breakdown, the price has entered a consolidation phase, forming an Ascending Triangle pattern between approximately $3,200 and $3,500. This is typically a continuation pattern in the direction of the preceding trend (which was down), but a breakout above the flat resistance can signal a reversal.
The chart shows that the price has recently broken above a Key Level that represented the flat top of the Ascending Triangle and the immediate overhead resistance. The current price is around $3,589.94.
🧭 Projection
The breakout from the Ascending Triangle and the Key Level suggests bullish momentum in the short term, aiming for the next significant resistance.
The most critical resistance zone is the area of the previous 4-hour Support, now a Resistance Zone (marked on the chart between roughly $3,700 and $3,800). This resistance is strengthened by the convergence of the 4-hour Trendline (a major downtrend line) in the same general area.
Short-Term Bullish Scenario (Projected Move)
The price is projected to continue its climb toward the $3,700 - $3,800 Resistance Zone.
The area where the 4-hour Trendline and the old 4-hour Support/New Resistance meet is identified as the prime target for a Possible Retest and Reversal on Trend.
A strong rejection at this confluence of resistances would confirm the continuation of the overall downtrend, pushing the price lower, potentially back toward the lows around $3,200.
Long-Term Reversal Scenario
For a significant bullish reversal to be confirmed, the price would need a decisive, high-volume break and close above both the $3,800 Resistance Zone and the 4-hour Trendline. This would invalidate the major downtrend and open the path for a move back toward the $4,200 - $4,400 area.
However, the chart's current setup favors the retest and continuation of the bearish trend unless this major resistance is overcome.
In summary, the immediate move is projected to be up to the $3,700 - $3,800 zone, where the market will face a major test that will determine the mid-term direction.
