what I will do with eth“On ETH, waiting for a range breakout and reversal at 4330 to target 4423. This implies a 2% move, with a stop at 4290 (≈1%), giving a 2:1 risk-reward ratio.”
ETHUSDT.P trade ideas

ETH ETH price prediction for the upcoming days
If breaks out of this box, higher targets to ATH and 5400 is feasible
If it loses this level, 3800 is the next stop

ETH LONG SETUPBelow are key levels to watch
$4300 Hold on 4hr and 1hr could sustain bullish momentum
Eth went lower over the weekend to $4236 which now enables the bears to target lower prices
the 4hr EMA was held on Saturday and bullish momentum was seen at those levels, a break of the 4hr ema @4252 would send price action into bearish momentum on a longer time frame
In my opinion breaking the $4280 level will invalidate most bullish momentum and the next but of support comes in at $4250 which itself will create more bearish momentum if it gets there.
Even with all these bearish indicators, I do see price action currently swaying towards the bullish side on lower time frames,
We are looking for a retest and gold of $4300 on higher time frames.
thoughts ? lets get this bread together !!!!

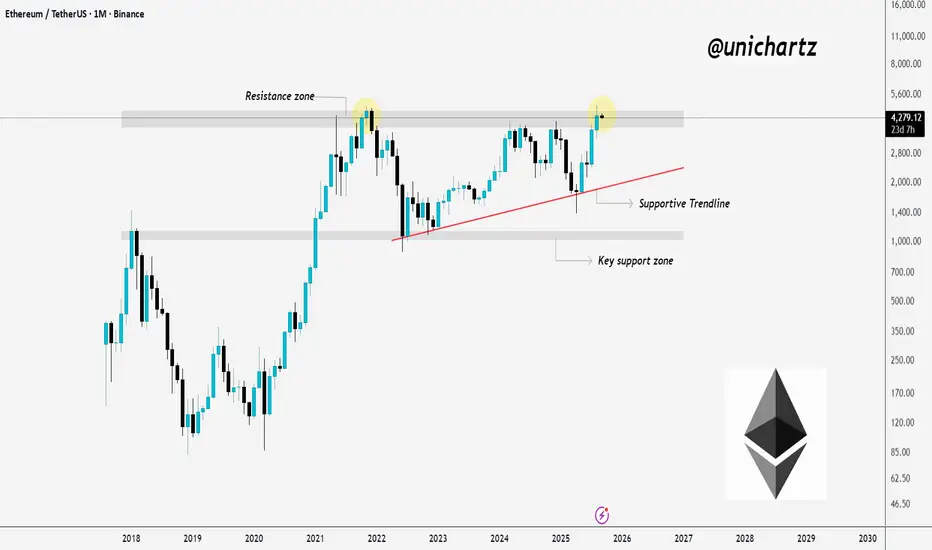
Decision Time for ETHCRYPTOCAP:ETH is struggling at the marked resistance zone.
Price has tested this area multiple times, which confirms it as a strong supply region. Right now, ETH is consolidating below resistance while holding above the supportive trendline.
If bulls can secure a clean monthly close above this resistance zone, the path opens for continuation toward higher levels. But if rejection plays out again, we could see a pullback to the supportive trendline or even toward the key support zone before another attempt.
This level is critical, it will decide whether ETH breaks into a new rally or spends more time ranging.
DYOR, NFA
More updates coming soon, Stay turned
#ETHUSDT 3H ChartPrice is currently consolidating showing no major movements after the NFP news release last Friday. MACD is slightly bullish but EMAs are bearish. Price would need to break above the $4,400 area in order to expect a bullish reversal aiming towards the 4h supply zone at around $4,800.

ETH 4H Analysis - Key Triggers Ahead | Day 15💀 Hey , how's it going ? Come over here — Satoshi got something for you !
⏰ We’re analyzing ETH on the 4-Hour timeframe .
🔭 On the 4-hour timeframe for Ethereum, we can see that ETH is currently moving inside a very strong box and is preparing for this week’s upcoming news. The resistance (ceiling) of this box sits at $4,471, while the support (floor) is around $4,254. Once either of these levels is broken, Ethereum could make a strong move after this long consolidation phase. There’s also an early trigger zone at $4,332; if ETH breaks and stabilizes above this level, we can consider entering a position toward the top of the box.
⛏ Key RSI levels for Ethereum are at 58 and 40. Breaking these ranges could signal the start of a strong move. With increased volatility, ETH could even push toward the overbought (OB) or oversold (OS) zones.
💰 Currently, the size and volume of candles have dropped significantly — something we often see during holiday sessions. But with the start of the new week and upcoming economic reports, Ethereum could generate bigger candles and stronger momentum once it breaks out of this box.
🪙 Looking at the ETHBTC pair on the 4-hour timeframe, the chart still looks bearish with decreasing volume. The current zone is considered a maker-buyer area, and we’ll need to watch how the whales react here. If this level is lost, Ethereum could face a deeper correction and move toward its lower support levels.
💡 Ethereum currently has 3 alarm zones:
A short alarm zone at the bottom of the box — if broken, it could trigger stronger selling pressure.
A long alarm zone #1 at $4,332, acting as an early trigger for a potential breakout toward the top.
A long alarm zone #2 at $4,471 — breaking and holding above this level could lead to a solid upward move.
❤️ Disclaimer : This analysis is purely based on my personal opinion and I only trade if the stated triggers are activated .

Ethereum (ETH/USDT) – Neowave UpdateEthereum continues to move inside a short-term descending channel. Based on the Neowave count, the current structure can be interpreted as wave G of a Diametric pattern.
🔑 Main Scenario:
• If ETH manages to hold above 4315, buyers could regain control.
• In that case, a move toward the channel’s upper boundary around 4410 is likely, completing wave G of the Diametric.
⚠️ Alternative Scenario:
• Failure to sustain above 4315 will keep the bearish tone intact.
• In this case, ETH may retest the lower boundary of the channel, with possible extensions toward 4200–4150.
📌 Conclusion:
Ethereum is at a decision point. A confirmed breakout above 4315 opens room for a rally to 4410, while rejection from this level could extend the corrective phase lower.

Crypto markets in waitCrypto markets in wait ⚖️
BTC & ETH are range-bound as traders await major news:
📌 Fed interest rate decision
📌 Bitcoin ETF review
A potential breakout—up or down—could happen after these events

ETHUSDT — Multi-Timeframe Deep AnalysisWhat’s up traders! ETH has been stuck in the same range so long it deserves its own zip code. Let’s map the structure before the next expansion.
High Timeframes (Weekly → 2D → 12H)
– Weekly trend remains bullish after HH into 4.6–4.8k supply. First pullback orderly, key support 3.3–3.45k.
– 2D flag forming. Support = 4.20–4.30k. Resistance = 4.55–4.65k. Lose 4.22k → imbalances open to 4.12k/4.05k.
– 12H range = 4.22–4.45k.
• Bullish CHoCH >4.40–4.43k → 4.50–4.55k.
• Bearish <4.22–4.25k → 4.12k/4.05k fills.
• Liquidity: below = 4.26–4.29k, 4.22k, 4.12k. Above = 4.38–4.43k, 4.50–4.55k, 4.6–4.8k.
Orderflow / Volume Profile
– Heavy profile 4.28–4.35k, POC in band.
– Absorption near 4.28–4.30k, sellers rotate into 4.36–4.40k.
Derivatives
– OI sideways, funding flat/negative, CVD flat → spot driven.
– Liquidations modest, basis compressed.
Rotation Context
– ETH tailwind while BTCETH rises and BTC.D softens.
– ETH >4.4k while BTC stalls = ETH dominance story. Break <4.22k = BTC retakes strength.
Conclusion
ETH remains in balanced consolidation, 4.22–4.45k. Key trigger levels: above 4.4k → 4.5–4.55k retest; below 4.22k → imbalance fills toward 4.12k/4.05k.
Candle Craft | Signal. Structure. Execution.

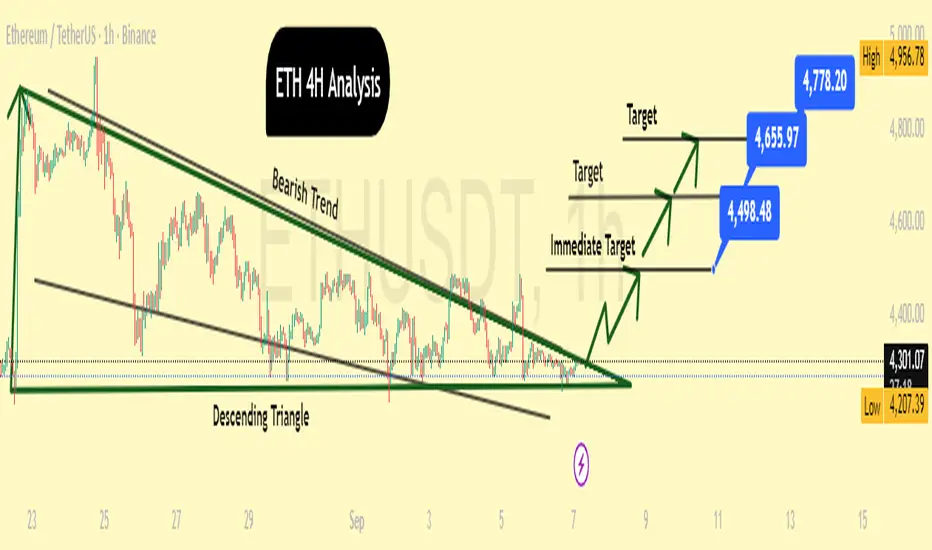
" Ethereum Silent Signal:Will the Triangle Spark a Trend Shift?"ETH breaks out of a descending triangle, hinting at a potential bullish reversal after sustained bearish pressure.
📊 Setup & Targets
A descending triangle formed under a bearish trendline now sees price action testing the breakout zone. With the breakout looking valid, the wave structure suggests the following bullish targets:
🔹 Immediate Target – 4,498.48
🔹 Secondary Target – 4,655.97
🔹 Final Target – 4,778.20
⚠️ Rejections & Price Pattern
Multiple rejections from both the descending resistance and horizontal support confirm the pattern’s integrity. The final squeeze at the apex increases the breakout's reliability, assuming volume supports the move.
🧠 Final Thought
A clean breakout from a high-probability pattern like the descending triangle often leads to strong impulsive moves. Watch for retests near 4,300–4,320 for confirmation before continuation.
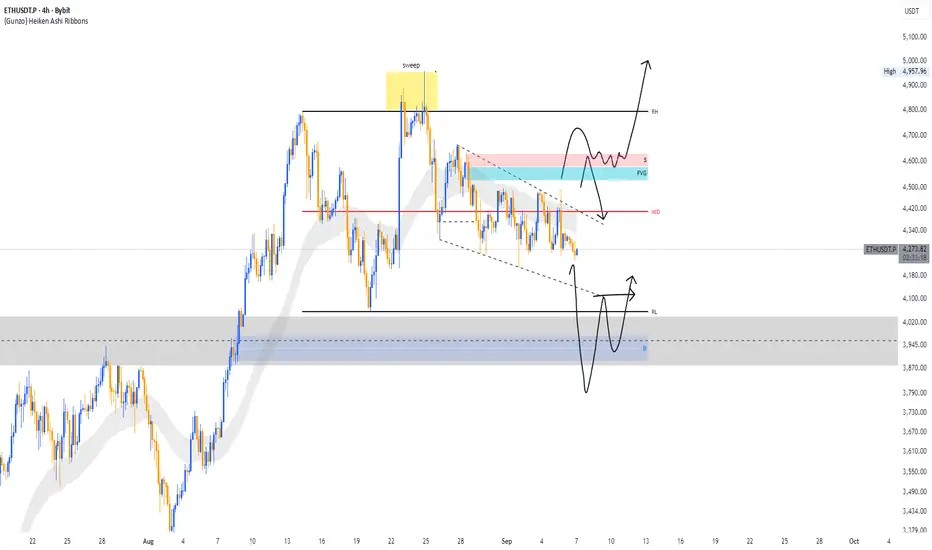
ETH/USDT 4H AnalysisEthereum is consolidating after a recent liquidity sweep near $4,950. Price is currently ranging between mid-level resistance ($4,420) and the demand zone around $3,950–$4,000.
Two possible scenarios in play:
🔹 Bullish Case: If ETH holds above $4,200 and clears the FVG + supply zone ($4,600–$4,700), we could see a strong continuation toward $5,000 psychological level.
🔹 Bearish Case: If current support fails, ETH may retest the grey demand zone ($3,900–$3,950) before any bullish recovery.
Key Levels to Watch:
Resistance: $4,420 / $4,700 / $5,000
Support: $4,200 / $3,950
⚠️ This analysis is for educational purposes only, not financial advice. Always trade with proper risk management.
💬 Do you think ETH will reclaim $5k next, or will we see a deeper correction first?
Elliott Wave 4 still in play ?There’s nothing worse than trading a slow, choppy market that doesn’t range far enough in either direction to give a clean read. This past week I’ve been tracking whether Wave 4 has finished or if we’re still stuck in its structure. My bias is that Wave 4 will drag on a little longer.
I expect price may test near the 0.382 Fib retrace before we get another leg higher that could still be part of Wave 4. Ideally, I’d like to see a correction down to the 55 EMA (green line), followed by two higher highs, a pullback, and then a breakout above the end of Wave 1. That would confirm the start of Wave 5 on the daily timeframe.
Based on my Fib time-cycle analysis (the vertical lines on the chart), Wave 5 might not truly start until late October. In the meantime, I’m scalping shorter timeframes—using Elliott Wave counts on the lower TF and MACD divergence on the slightly higher TF—to secure some overnight trades while waiting for a bigger breakout.
Trade with caution. Always check the higher timeframe before entering, and always use a stop loss. Protect your account.

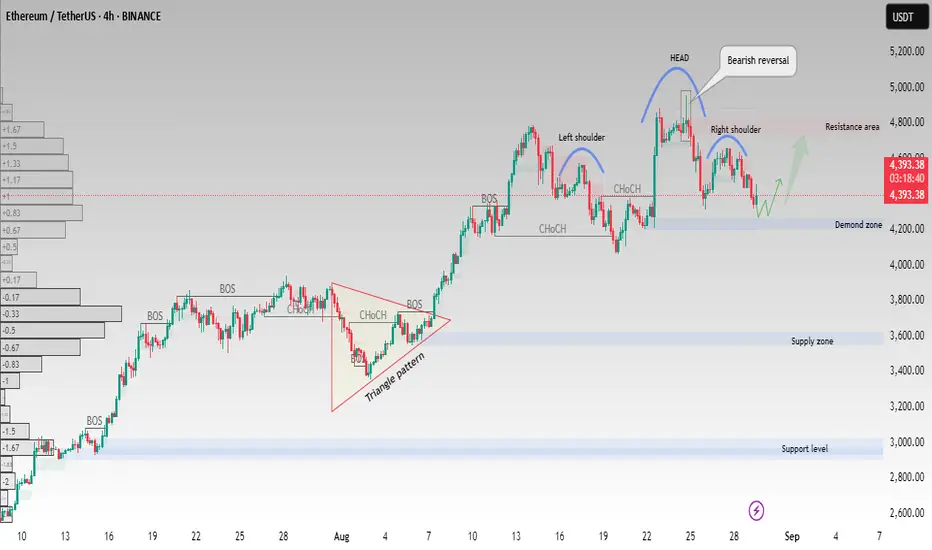
ETH/USDT–Head&Shoulders BearishReversal with DemandZone ReactionEthereum (ETH/USDT) on the 4H timeframe is showing a Head & Shoulders pattern, which often signals a potential bearish reversal after a strong bullish move.
Pattern Observed: Head & Shoulders formation with clear Left Shoulder, Head, and Right Shoulder.
Resistance Area: Around $4,750 – $4,850, aligning with the neckline rejection.
Demand Zone: Current support seen near $4,300 – $4,350. If buyers defend this level, ETH could see a short-term rebound.
Supply Zone: Strong supply below $3,600, in case bearish momentum continues.
Possible Scenarios:
A bounce from the demand zone could push ETH back toward resistance.
A breakdown below support may trigger further downside toward the supply zone.
This setup combines BOS (Break of Structure) and CHoCH (Change of Character) signals, strengthening the bearish case in the short term.
This analysis is for educational purposes only and not financial advice. Always manage your risk before entering any trade.
Short SqueezeShort Squeeze on ETH once it fakes the deviation. Expecting an entry shown as that is prev resis but also will be in the current range. TP: scale out half once ATH is reached then the sky is the limit.

Ethereum Weekly Analysis📊 Ethereum Weekly Analysis
This week, I have analyzed the ETH/USDT chart focusing on key support & resistance levels, market structure, and potential trading zones.
The breakdown includes:
🔹 Weekly trend direction
🔹 Major support & resistance zones
🔹 Key liquidity levels & possible reversal points
🔹 Short & long opportunities based on structure
This analysis is purely educational and based on my personal trading experience. Always manage risk properly and do your own research before trading

TradeCity Pro | Ethereum Consolidates in Descending Triangle👋 Welcome to TradeCity Pro!
In this analysis I want to review Ethereum for you. Ethereum is by far the most popular altcoin in the market and with a market cap of 520 billion dollars it is ranked 2nd on CoinMarketCap.
⏳ 4-Hour Timeframe
After the bullish leg that started from the bottom of 3380, Ethereum broke 3890 and reached the top of 4806, managing to register a new all-time high.
✨ Currently, the price is in a corrective and ranging phase and has corrected down to the 0.382 Fibonacci level, forming a Maker Buyer zone near this area.
⚡️ A descending trendline has also formed, where the price has tested it multiple times, creating a descending triangle between this trendline and the Maker Buyer zone.
📈 With a breakout of this trendline, we can open a long position. The trendline trigger is at 4488, and this position can be taken as a pre-breakout entry before 4806, with the main trigger being the breakout of 4806 itself.
🔽 On the other hand, if the triangle breaks to the downside, the price will move towards lower Fibonacci levels and can correct down to 3890.
💫 In my opinion, as long as Ethereum is above the 3890 level, its trend remains fully bullish, and if it is supported in this current zone, the next leg up will start even stronger.
💥 The first confirmation of a trend reversal will be if the price stabilizes below 3890, but currently, the price is still far from this level, and as long as it is above it, opening short positions is not logical.
📝 Final Thoughts
Stay calm, trade wisely, and let's capture the market's best opportunities!
This analysis reflects our opinions and is not financial advice.
Share your thoughts in the comments, and don’t forget to share this analysis with your friends! ❤️

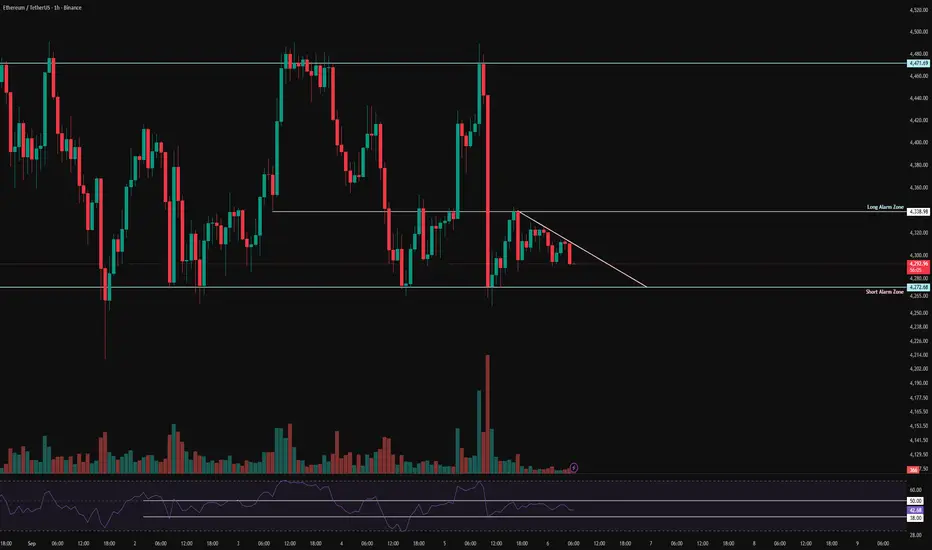
ETH 1H Analysis - Key Triggers Ahead | Day 14💀 Hey, how's it going ? Come over here — Satoshi got something for you!
⏰ We’re analyzing ETH on the 1-hour timeframe timeframe.
🔭 On the 1H timeframe for Ethereum, we can see that after yesterday’s news, ETH pushed upward toward the top of its range but failed to break out. From that resistance, it faced a heavy rejection, and this drop happened within just two 1H candles! At the moment, ETH is in a consolidation zone, and breaking out of this compression could provide us with an entry.
⛏ The key RSI oscillator levels are at 38 and 50. Once RSI breaks above or below these zones, Ethereum could start its next move following the effects of yesterday’s NFP news.
💰 The size and volume of red candles have increased sharply, showing strong selling pressure. The corrective bounce happened step by step, but then another fairly large red 1H candle was printed. With continued selling pressure, Ethereum may test lower price levels.
🪙 On the 1H timeframe for the ETHBTC pair, we can see it is moving inside a multi-timeframe range. Each time it reaches the bottom of the box, volume increases and the price reacts with zig-zag moves. Note that the bottom of this box is at 0.03864, which has already been tested twice. This area should be considered as a short alert zone for ETHBTC.
💡 The alert zones for Ethereum itself are at 4,272$ and 4,338$. If either of these levels is broken, ETH could start a strong move, especially considering the momentum after yesterday’s NFP News.
❤️ Disclaimer : This analysis is purely based on my personal opinion and I only trade if the stated triggers are activated .
ETH Breakout Ahead: $6700 Target on the Horizon !Hello Traders 🐺
As I mentioned before, when ETH was around $1430, I said price is on its way to reclaim its ATH. Now, after breaking above this huge triangle pattern — an obvious sign of long-term accumulation — the next target sits around $6700 at the 0.5 Fibonacci level.
But it’s not just the technicals. Fundamentals are also pointing toward a strong upcoming pump:
Inflation at 2.7% → almost in line with the Fed’s target.
Unemployment at 4.3% → highest in 4 years, signaling labor market weakness.
NFP only 22K → far below trend.
Jobless Claims above expectations → more signs of deterioration.
This combination puts the Fed in a forced position: either cut rates or risk a severe recession.
📉 Realistic Odds
A 25bps rate cut in September looks almost certain.
A larger 50bps cut is, in my opinion, more likely than what the market is currently pricing (above 10–14%), given how weak labor data really is.
Now let’s zoom into the 4H chart:
As you can see, ETH is forming a falling wedge, ready to break to the upside. If price manages to push above the current high, we can expect strong volatility and continuation to the upside.
I hope you enjoy this idea and as always remember our golden rule :
🐺 Discipline is rarely enjoyable , but almost always profitable . 🐺
🐺 KIU_COIN 🐺

ETHEREUM ETHUSDT WEEKLY CHARTETHEREUM failed to bridge 5k zone on weekly close .I was forecasting a push into the weekly ascending trendline which could have seen price into 6300-6500k zone.
but as we retested the current all time high and we are seeing correction and took correction from that level to 4,298$ per Ethereum today
My buy floor will be in 3300-3370 zone and another buy floor will be 2229-2200 zone if key demand floor is broken .
its best to wait for buy on the 3300-3370 zone
no idea is perfect
manage your risk and protect your capital
trade with my hunter mindset
#ethereum #ethusdt

EtheriumEtH usdt daily analysis Time frame hourly Risk rewards ratio >2.3 👈👌
Target 4474$
Move up and down in the rectangle and waiting for good news to pump
I set my SL too far to scrap of sl hunting

ETH – Back at support?Demand box is still holding price. We just tagged H4 EMA200 and trendline again too, good long opportunity with a very tight invalidation.
More importantly, watch a possible loss of the trendline and demand zone for a flush into the 3800 zone, I think the better long opportunity is there and it can pay to have some bids sitting there.

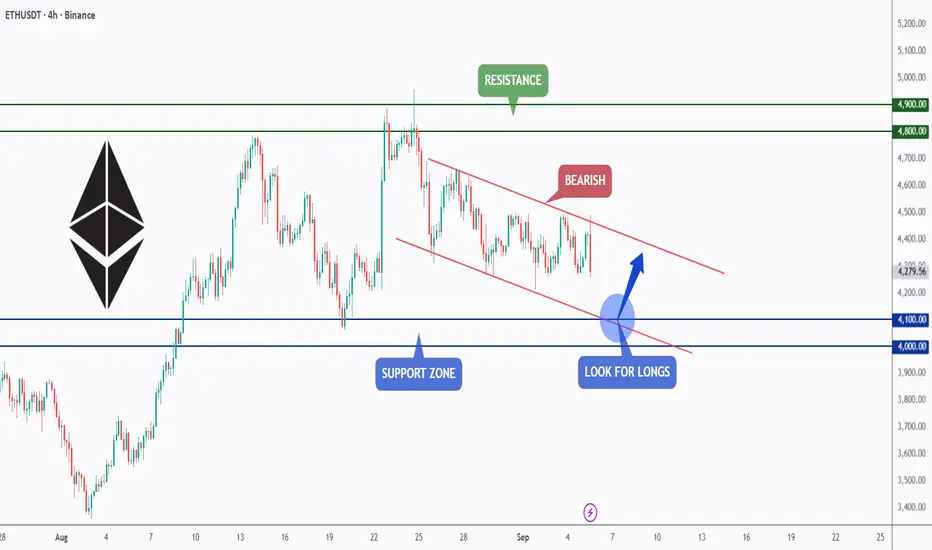
ETH – Watching the Falling Channel!Ethereum is currently trading within a falling channel on the 4H timeframe, showing short-term bearish pressure.
Price is approaching the support zone around the $4,000–$4,100 area, which also aligns with the lower boundary of the channel.
As long as this zone holds, it could act as a springboard for bullish momentum, offering a potential long setup.
A breakout from the channel would further confirm buyer strength and open the way toward the resistance zone near $4,800–$4,900.
⚠️ Disclaimer: This is not financial advice. Always do your own research and manage risk properly.
📚 Always follow your trading plan regarding entry, risk management, and trade management.
Good luck!
All Strategies Are Good; If Managed Properly!
~Richard Nasr
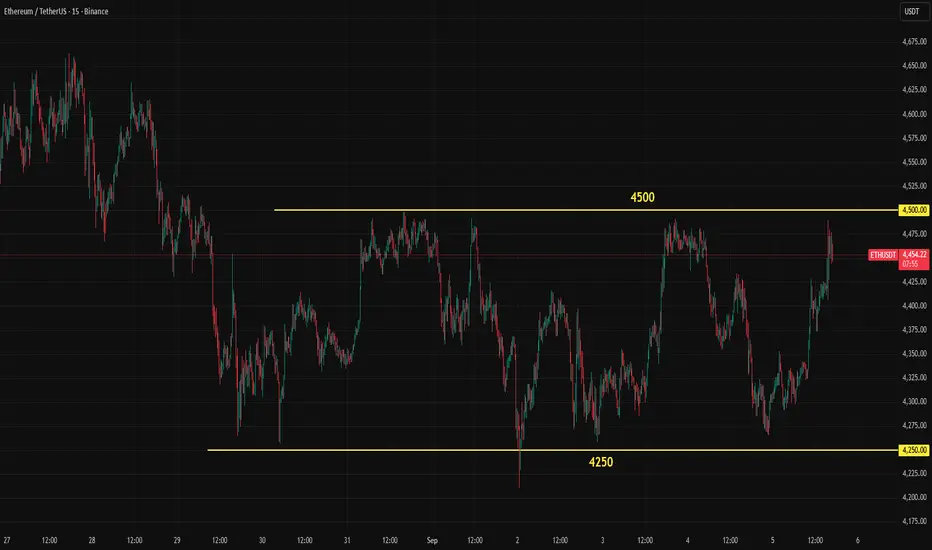
Quick Update on EthereumETH has been ranging between 4,250 and 4,500 since late August. With the weak payrolls data and yet another downward revision, a September cut is now mostly priced in. The market has also started to anticipate two more cuts for the rest of the year. This has supported Ether, with 4,500 being tested again. If a breakout occurs, an upward move may begin shortly, but for now the 4,500 resistance is still holding.