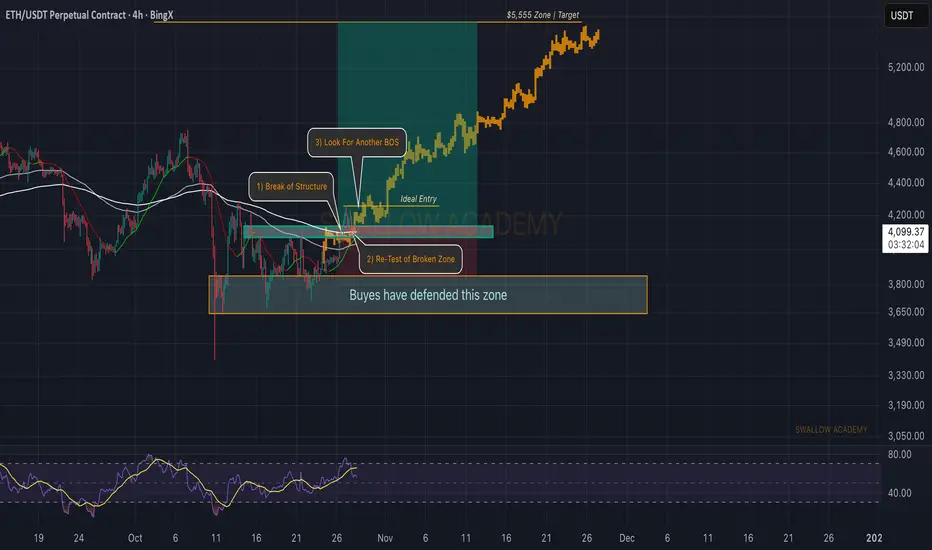
Ethereum (ETH): Last Step For Perfect Entry | Wait For Last BOSOne of the best setups that has been working for us is BOS/Re-Test/BOS, where ETH is at the last stage to potentially give us an ideal entry for a long position.
The game plan is simple: we wait for BOS to form; once we get that, we are going to target the current ATH area near $4900 and then a new ATH, which we have been aiming for, of $5555.
Swallow Academy
Trade ideas
ETH: Another Attempt To Resume Upward MovementETH: Another Attempt To Resume Upward Movement
Ethereum is showing strong bullish momentum after forming a bullish flag pattern on the chart. The price has broken above the flag, confirming the potential for further upside movement.
As long as ETH stays above the breakout zone, the next target levels are around $4,125 and $4,285.
If the price fails to hold above the breakout area, a short pullback could occur before another attempt to move higher.
Overall, the structure remains bullish while ETH trades above the $3,900 support zone.
You may find more details in the chart!
Thank you and Good Luck!
❤️PS: Please support with a like or comment if you find this analysis useful for your trading day❤️

ETH heavy pump ahead after major daily breakoutEthereum (ETH) is approaching a critical technical juncture as it tests a key descending trendline. A decisive breakout above this trendline, confirmed by a sustained close and supported by high trading volume, would signal a potential reversal of the recent bearish momentum.
Such a confirmed breakout is often followed by a significant bullish impulse. The initial phase of this move would likely be characterized by strong, high-volume bullish candles, indicating robust buyer conviction.
Based on classical technical analysis principles, and specifically using measured move projections from the prior consolidation range, the initial upside target following a successful breakout is projected toward the $5,500 level. This represents a significant resistance zone and a logical first objective for a new bullish phase.
DISCLAIMER: ((trade based on your own decision))
<<press like👍 if you enjoy💚

Ethereum Shows Weakness at 0.618 Level — Lower High FormationEthereum’s price action is displaying significant weakness around the 0.618 Fibonacci retracement level, currently situated near $4,114. This region has repeatedly acted as a rejection zone, highlighting the lack of sustained bullish momentum in the current market structure.
If continual rejections persist at this level, the probability of a deeper corrective move increases, with the next major support target lying around $2,400. The broader structural framework remains bearish, as Ethereum continues to form lower lows on higher timeframes — a classic signal of downtrend continuation.
Key Points:
- Critical Resistance: The 0.618 Fibonacci level at $4,114 remains a key rejection zone.
- Bearish Structure: Ongoing lower lows suggest sustained weakness in market structure.
- Downside Target: Potential corrective move could extend toward $2,400 support.
From a technical perspective, this region can act as a lower high projection unless Ethereum decisively reclaims the $4,800 level. Until such a breakout occurs, the bias remains to the downside.
What to Expect:
As long as ETH fails to close above $4,114, bearish pressure will likely persist. A continued rejection here opens the door for a retracement toward $2,400, reinforcing the broader corrective outlook.

ETH Support Holding, But Cracks ShowingAs long as CRYPTOCAP:ETH holds the key support zone, the overall structure remains bullish and there’s nothing to worry about.
However, the technical setup is starting to weaken, a break below this support could turn things ugly, especially for altcoins.
DYOR, NFA
#PEACE
Thanks for reading! Appreciate your support and engagement 🙏

ETHUSDT 2-Hour Chart Analysis. ETHUSDT 2-Hour Chart Analysis.
ETH is consolidating above key support levels ($3,700–$3,800) and exhibiting a lateral range, but a clear breakout has yet to occur.
The chart path indicates a bullish scenario: if ETH holds above this base, the next major resistance lies near $4,280—a move above this could lead to a target of $4,400+.
Bullish traders will want to see a strong candle above $3,900 to maintain momentum; failure to hold $3,700 raises the risk of a move towards the $3,390 support level.
DYOR | NFA

The key is whether it can rise above 4403.87
Hello, traders.
Follow us to get the latest information quickly.
Have a great day.
-------------------------------------
(ETHUSDT 1W chart)
The formation of an upward trend line (A) created an upward channel from (A) to (B).
Therefore, the key is whether it can continue to rise along this upward trend line.
If the upward movement fails, we need to check whether the price rises along the rising trend lines (1) and (2).
Therefore, the 3900.73-4107.80 range is a crucial area for sustaining the upward trend.
In this context, we expect a significant period of volatility to begin around the week of November 24th.
This period of volatility could continue until around the week of January 12th, 2026.
-
(1M Chart)
If this month closes with a bearish candle, forming an upward trend line (a), the key question is whether the price can rise along trend line (a).
If not, there's a possibility of touching the upward trend line (2), so we need to consider a response plan.
-
(1D Chart)
The key is whether the price can sustain above the uptrend line (1) and rise above 4403.87.
To do this, we need to see if it can break above the downward channel created on the 1D chart.
Therefore, we need to observe how the price moves after the volatility period around November 5th.
The HA-High ~ DOM(60) section (4393.04-4780.15) on the 1W chart overlaps with the HA-High ~ DOM(60) section (4403.87-4749.30) on the 1D chart, so it's likely to act as resistance.
------------------------------------
The basic trading strategy is to buy in the DOM(-60) ~ HA-Low section and sell in the HA-High ~ DOM(60) section.
However, if the price rises from the HA-High to DOM(60) range, a step-like uptrend is likely, while if it falls from the DOM(-60) to HA-Low range, a step-like downtrend is likely.
Therefore, a split trading strategy is recommended.
To maintain a step-like uptrend in the DOM(-60) to HA-Low range,
1. The StochRSI indicator must be rising. If possible, it should not enter the overbought zone.
2. The On-By-Value (OBV) indicator must be rising. If possible, it should remain above the High Line.
3. The TC (Trend Check) indicator must be rising. If possible, it should remain above the 0 level.
If the above conditions are met, the uptrend is likely to continue.
If not, a high point is likely to form, so you should consider a countermeasure.
-
Thank you for reading to the end.
I wish you successful trading.
--------------------------------------------------

ETHEREUM ETHUSDTTHE 3HR STRUCTURE CONFIRMS THAT THERE IS NOTHING LIKE MANIPULATION IN TRADING.WHAT WE HAVE IS DEMAND AND SUPPLY.
TRADERS SAND OVERSIGHT ARE NORMAL AND WILL TAG IT AS MANIPULATION.
AM LOOKING FOR SUPPLY AROUND 4378.69 IN THE DIRECTION OF TAKE PROFIT AGAIN.
Ethereum remains the second-largest cryptocurrency by market capitalization and continues to be a foundational platform for decentralized finance (DeFi), smart contracts, and tokenized assets.
Ethereum Overview and Outlook
Ecosystem Growth: Ethereum’s ecosystem is expanding with over 127 million active wallets and total value locked (TVL) in DeFi protocols reaching about $96.86 billion, a 50% increase since mid-2025.
Technology Upgrades: Recent upgrades like Pectra and Fusaka, along with Layer 2 solutions such as Arbitrum, improve scalability, reduce fees, and enhance user experience.
Macro and Regulatory: Institutional inflows via Ethereum ETFs total nearly $24.7 billion, supported by gradual regulatory clarity.
Price Forecast: Despite short-term volatility, Ethereum shows strong fundamental on structure and rally.
Summary
Ethereum remains a dominant blockchain platform with robust adoption and technical advancements, supporting a positive price outlook .currently, with potential to rally toward $5000-6000k if they break and close weekly resistance
the ecosystem growth, institutional participation, and network upgrades will be its bullish catalyst
#ETHUSD #ETHEREUM

ETHUSDTBINANCE:ETHUSDT have a amazing trend because this is second the best crypto an head of all project so is in watchlist of best traders.
Support for buy: 3750$
Resistance for targets: 4045 - 4200 - 4435 - 4755
Please your risk management.

more optimistic cycle topbased on historic data and patterns, a potential -more optimistic- cycle top at price range of 9.5-9.8k USD.

ETH is now preparing for a rally toward the $4,500 zone.Ethereum will bounce within the channel, moving toward the $4,500 target.
Even in a spot position, this move could deliver around 18% gains.

ETHUSDT 4-Hour Chart Analysis !!ETHUSDT 4-Hour Chart Analysis
Trend: ETH has found support at the intersection of a long-term downtrend line and a horizontal demand zone ($3,850–$3,900 area). This area has held steady several times and is acting as a base for the price.
Structure: The price has recently pulled back after rallying to $4,220, but continues to make higher lows on this timeframe, indicating that the bullish structure remains intact as long as $3,900 remains stable.
Key Levels:
Support: $3,850–$3,900 (trend line and horizontal zone)
Resistance: $4,220 (recent swing high), $4,830 (key target—see green arrow projection)
Perspective: If ETH remains stable above $3,900 and bounces back from this support, the next targets will be $4,220 and then $4,830. A breakdown below $3,850 would weaken this bullish outlook.
ETH remains bullish above support, and an upward move towards $3,900 is highly likely. Watch for a break above and sustain above the $4,220 level for further momentum.
DYOR | NFA

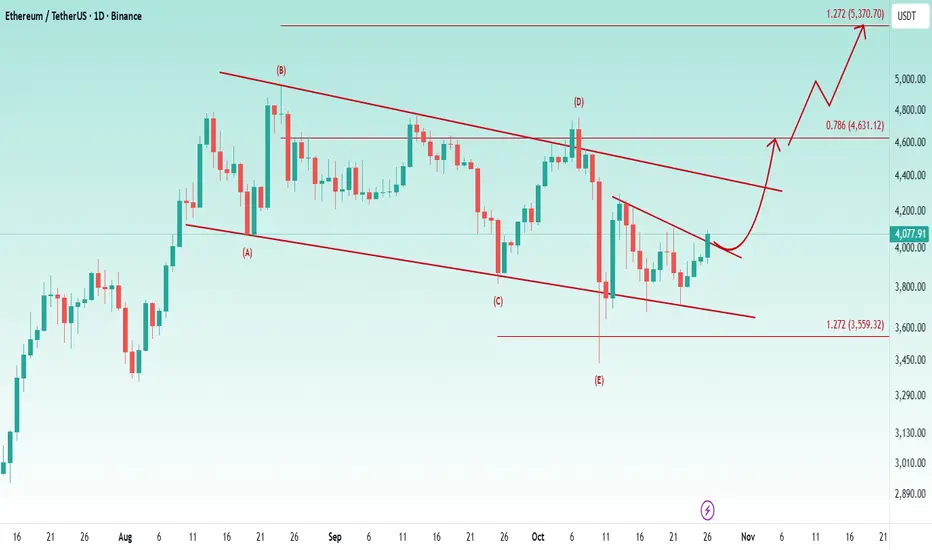
Ethereum is on its way to a new ATH🔘 There’s no change from my previous update
📥 price of Ethereum has tested the bottom of the bullish flag several times and has managed to hold its position well.
👉 Currently, in the lower timeframes, it is breaking the descending trendline.
📈 I expect a bullish move to start from this area toward 4600$, followed by a breakout of the bullish flag and a continuation of the move toward 5370$ as a new ATH.
🔰 Overall, the structure of Ethereum looks strongly bullish to me, and I anticipate a powerful upward trend in the near future.The price remains in a strong demand area and still looks attractive for buying
ETH: Fade the FearTrade Setup
Position: Long (2–3x leverage max)
Entry Zone: 3,741–3,591
Stop Loss: 3,325
Targets:
TP1: 5,190
TP2: 5,561
TP3: 5,836
This setup enters on the completion of Wave 4 and the beginning of a final impulsive Wave 5, with ETH reclaiming prior ATH resistance near 4,868 into a final euphoric Q4.
Macro Context
1. Rate Cuts and End of QT:
The Fed continues to signal a move toward easier policy. As rate cuts proceed and quantitative tightening winds down, risk assets tend to rally. Crypto often lags equities by a few weeks, meaning ETH could soon benefit from these liquidity shifts.
3. Liquidity Flow from Gold:
Crypto will steal liquidity from gold sellers as liquidity rotates.
3. Volatility Positioning:
DVOL data shows implied volatility hovering around 43–44, indicating that institutional players are not aggressively hedging downside. Such volatility compression often precedes a major directional move, typically upward during liquidity expansions
Technical Confluences
1. Wave Structure:
ETH appears to be finalizing Wave 4, setting up for a higher-low structure that leads into Wave 5. The MACD on the 3D timeframe is reversing, supporting bullish continuation.
2. Golden Pocket Retrace:
The current pullback perfectly aligns with the 0.618 Fibonacci retracement zone between 3,741 and 3,591.
4. Bull Market Support Band:
The 20W SMA and 21W EMA continue to hold as dynamic support.
5. Funding Rate Sentiment:
Funding rates across major exchanges remain neutral to slightly negative. This shows that short positions are piling in near support, which is typical during the final stages of a corrective phase before a squeeze higher.
DO NOT BE COMPLACENT.

ETHEREUM ETHUSDT WEEKLY PERSPECTIVE ETHEREUM TECHNICAL INFORMATION.
THE WEEKLY TIME FRAME SHOWS THAT BUYERS REJECTED THE 4998-5000 ZONE AND IT BECOMES OUR NEW BUY LIMUS TEST IN THE FUTURE.THE BREAK AND COSE OF A WEEKLY CANDLE WILL CALL FOR 15MIN SCALP IN SEARCH OF POINT OF ENTRY TO AIM 6000-7000$ IN PROFIT.
THE CURRENT REALITY WITH ETHEREUM SHOWS LACK OF BIUY MOMENTUM AND ITS EVIDENT FROM THE BREAK AND RETEST OF 4200 LEVEL ON WEEKLY TIME FRAME ON THE CHART ,THIS REACTION IS DETAILED ON THE CHART FOR REFERENCE.
THE SELL CONFIRMATION WILL COME FROM THE WEEKLY BREAK AND CLOSE 3780 AND MY SELL TARGET WILL BE 3116$ DEMAND FLOOR AND ALSO 50% FIB LEVEL
TARGET 2 WILL BE 2727.8 DEMAND FLOOR
AND PRICE COULD GO LOWER BEYOUND THIS ZONE ON BEARISH SENTIMENT AND PROLONGED TAKE PROFIT,
ETHEREUM IN CONTEXT
Ethereum remains the second-largest cryptocurrency by market capitalization and continues to be a foundational platform for decentralized finance (DeFi), smart contracts, and tokenized assets.
Ethereum 2025 Overview and Outlook
Ecosystem Growth: Ethereum’s ecosystem is expanding with over 127 million active wallets and total value locked (TVL) in DeFi protocols reaching about $96.86 billion, a 50% increase since mid-2025.
Technology Upgrades: Recent upgrades like Pectra and Fusaka, along with Layer 2 solutions such as Arbitrum, improve scalability, reduce fees, and enhance user experience.
Macro and Regulatory: Institutional inflows via Ethereum ETFs total nearly $24.7 billion, supported by gradual regulatory clarity.
Price Forecast: Despite short-term volatility, Ethereum shows strong fundamental on structure and rally.
Summary
Ethereum remains a dominant blockchain platform with robust adoption and technical advancements, supporting a positive price outlook .currently, with potential to rally toward $5000-6000k if they break and close weekly resistance at 4200
the ecosystem growth, institutional participation, and network upgrades will be its bullish catalyst
.

ETH/USDT 1W🔹 Overall Trend
We are still in an uptrend (trend line maintained from the March low).
However, momentum is weakening—a series of lower highs is forming, suggesting a local correction within the main trend.
🔹 Key Technical Levels
🟢 Resistance:
4,179 USDT – the current level that the price is testing as resistance.
4,407 USDT – the next strong resistance, where previous rejections occurred.
4,877 USDT – the main resistance resulting from the August highs.
🔴 Support:
3,916 USDT – almost identical to the above (demand zone).
3,561 USDT – key structural support; loss of this level = possible trend change.
🔹 Formation and Structure
The current pattern could form a potential ascending triangle, with the trendline (black) connecting the lows and the horizontal resistance lines marking the upper boundary of the consolidation.
If a breakout occurs above 4,180–4,400, a move to 4,800+ is possible.
However, if we break the trendline and 3,900, a move to 3,560–3,400 could occur, or even a test of 3,000 with significant selling pressure.
🔹 Volume
Volume is decreasing during consolidation → typical of an accumulation or distribution phase.
No clear breakout signal – the market is waiting for a trigger (e.g., macroeconomic data, ETFs, news about ETH 2.0).
🔹 Stochastic RSI (Bottom of the chart)
Located in the oversold zone (<20).
The %K line (blue) is attempting to cross the %D line (orange) from below – a signal of an early rebound.
If confirmed next week, a local rebound from the 3,900–4,000 zone could occur.
🔹 Scenarios:
✅ Bullish:
Breakout from the trendline + breakout above 4,180 → target 4,400, then 4,880.
Confirmation by increasing volume and the Stoch RSI emerging from oversold territory.
❌ Bearish:
Breakout of the trendline and 3,900 → target 3,560, then 3,200.
Increasing downward volume + no bullish reaction at the support levels.

[SeoVereign] ETHEREUM BEARISH Outlook – October 27, 2025Hello everyone,
Currently, Ethereum has re-entered a major resistance zone,
and there is a high probability of a short-term corrective movement emerging.
First Basis — FIBONACCI 1.13~1.272
Ethereum is positioned within the 1.13–1.272 range relative to the upper structure.
This zone is generally recognized as an overheated area of an upward wave,
where selling pressure tends to emerge following the formation of a short-term high.
Second Basis — WAVE.M = WAVE.N × 1.618
The ongoing M-wave shows an extension ratio of approximately 1.618 relative to the previous N-wave.
This represents an overextended structure in wave theory,
which is typically interpreted as a sign of trend exhaustion and potential reversal.
Accordingly, the average target price is set around 3,864 USDT.
This perspective is based on data as of October 26,
and further updates will be provided to refine this outlook as the market develops.
Thank you for reading.

ETHUSDT-LONG IDEAETHUSDT has broken its trendline toward upside and formed the first internal higher high the retracement to 0.5 fib is done. The overall market structure is bullish So mark your buy stop order here at the given point. do your own research before taking any trade.

ETHCRYPTOCAP:ETH is showing two clear setups right now, one being a symmetrical triangle and the other an ascending channel. Both point to strong bullish momentum building. I’m leaning toward a breakout scenario where ETH surges and taps $9000 with ease once momentum kicks in.

Possible Ethereum Scenario in the Week AheadPossible Ethereum Scenario in the Week Ahead
Possible Ethereum Scenario in the Week Ahead Given the price of Bitcoin, which doesn't seem very interesting, you should monitor the movement and volatility of Bitcoin.

ETH Sell/Short Setup (4H)After a strong bearish move, the price has made a solid recovery and is approaching a good supply zone.
At this level, it’s better to look for sell/short positions, as there are strong order blocks in this area that could push the price downward.
We’ve considered a 1:2 risk-to-reward ratio, and you can see the targets and stop-loss levels on the chart.
For risk management, please don't forget stop loss and capital management
When we reach the first target, save some profit and then change the stop to entry
Comment if you have any questions
Thank You

ETH 1h chartCRYPTOCAP:ETH 1H Chart
Ethereum showing a clear market structure shift.
After a liquidity grab and CHoCH, price respected the 1H FVG and confirmed a bullish BOS, signaling potential continuation to the upside.
If price maintains above the FVG zone, ETH could look for higher targets in the short term.
#ETH #Ethereum #Crypto #PriceAction

It looks like the market is about to move in a continuation trenIt seems the economy may not undergo a “bubble reset” anytime soon. If that’s the case, the value of money will continue to depreciate, making investment channels such as stocks and cryptocurrencies increasingly attractive to investors. Although the core purpose of crypto is to promote balance and decentralization, when ownership becomes concentrated in the hands of a small group or a single entity, it exposes a structural weakness in the digital asset market — particularly for BTC and ETH.
