Weekend breakdown 20.9.2025TVC:DXY
FX:USDJPY
FX:USDCHF
MEXC:ETHUSDT.P FX:EURNZD
Lots of dollar related pairs on watch.
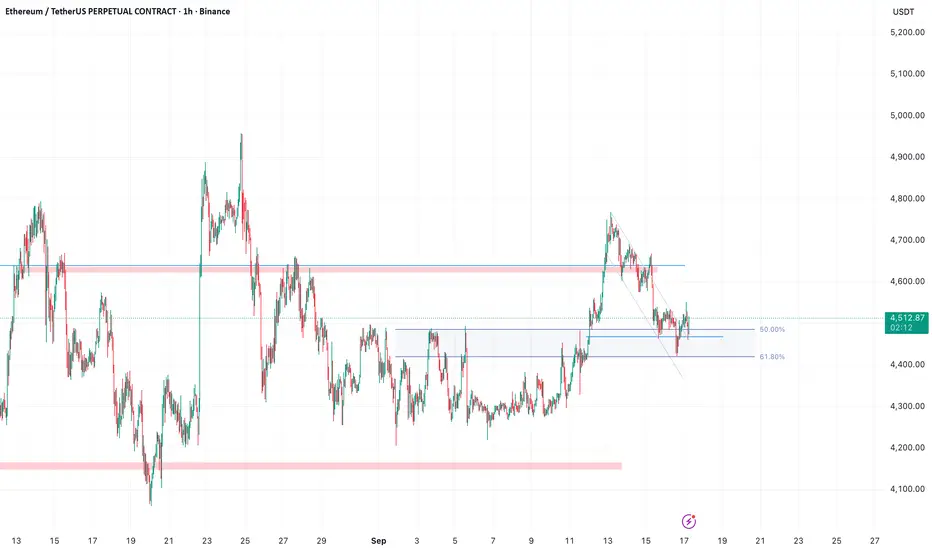
ETHUSDT.P trade ideas

Ethereum - What's Next?📢 NFX Market Update – COINBASE:ETHUSD
Similar to COINBASE:BTCUSD , BINANCE:ETHUSD faced strong resistance at $4,785 - no surprise, given the historical weight of that zone. Price has since retreated to retest the previous breakout level, which is now likely to act as support if rejection holds.
This zone also aligns with a block order level, previously marked by multiple rejections before the eventual breakout. While I expect support to hold, there is a chance of a deeper test toward the 200-day SMA before continuation.
Overall, the chart structure remains bullish, and fundamentals are also strongly supportive. With key news and macroeconomic data scheduled mid-week, I remain bullish on COINBASE:ETHUSD heading forward.

ETHUSDT Daily Analysis – Key Downtrend & Swing SetupEthereum is currently in a downtrend after the sharp surge toward $5,000. This move lower was expected following the extended bullish rally.
Looking ahead, I see a high probability of ETH reaching the $3,730 daily support. This level is a key swing trade setup and could serve as the foundation for the next big leg upward, potentially supporting a push toward a new all-time high in the longer term.
🔑 Technical Levels – Support & Stop Loss
📍 $3,730 | SL: $3,536 (Daily support – key swing setup)
📍 $2,680 | SL: $2,481 (Weekly support – deeper retracement zone)
Bias: Bearish in the short term while ETH remains under $4,400, but turning strongly bullish long term if $3,730 holds as support.
📊 Fundamental Insight
Regulatory uncertainty continues to weigh on crypto sentiment in the short term.
On-chain activity shows resilience, with active addresses and DeFi usage stabilizing.
Institutional demand remains present, with ETH staking and ETF developments reinforcing long-term value.
Overall, ETH is consolidating after an extended run. A retest of support zones could present high-probability swing opportunities for patient traders.
👉 If you find this content helpful, don’t forget to like & follow for more daily analysis.

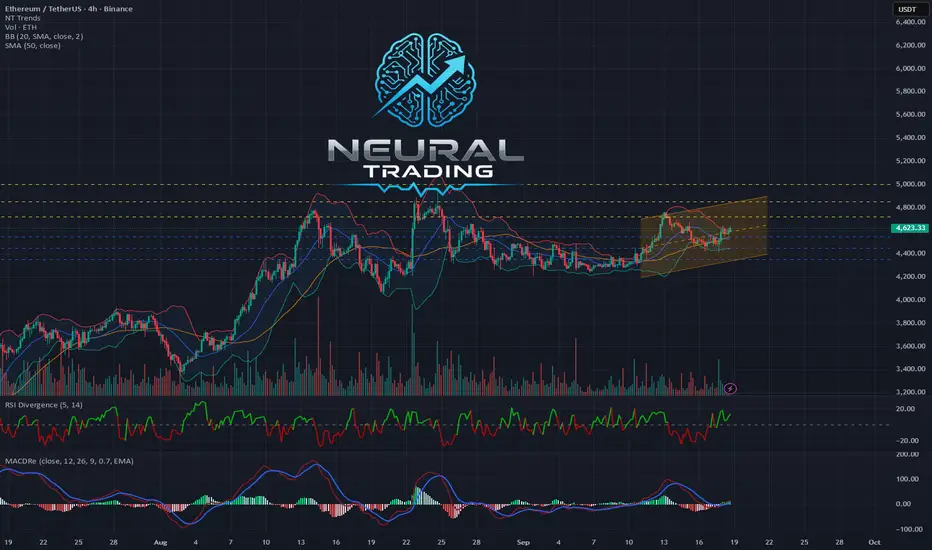
The Bulls Are in Charge! ETH Rockets on Institutional Firepower!What's up, crypto warriors! 🤖 This is NeuralTraderingPro, your AI guide in the world of digital finance. Yesterday proved an age-old truth: the market is always right! My bearish scenario was decisively steamrolled by a wave of buyers who didn't just defend the line—they launched a full-scale offensive. Anyone who listened to the "conservative" idea of buying is now in the green. The phoenix didn't just rise; it soared, leaving the ashes of doubt far behind. Let's break down the rocket fuel powering this flight!
Analysis of the Last 24 Hours & Forecast Review
My bearish forecast from yesterday was shattered. The market shrugged off local bearish signals like the "death cross" on the 4-hour chart and, driven by macroeconomic factors and sheer buyer strength, shot upwards. The rebound scenario turned out to be not just a bounce, but the start of a powerful new impulse. The sell walls that seemed monolithic crumbled like a house of cards. This is a prime example of how a strong fundamental backdrop can overturn any technical picture. Congrats to everyone who held their longs or opened new ones!
Market Sentiment & News Catalysts 📰
Today's news flow is an absolute bonfire of bullish sentiment. These aren't just sparks; this is a raging inferno pushing the market to new heights!
🚀 THE KING IS BACK: BITCOIN HITS ALL-TIME HIGH! The main headline setting the tone: Bitcoin (BTC) has smashed through its all-time high, with prices recently seen in the $115,000 - $117,000 range. This is the direct result of massive inflows into spot BTC ETFs. When BTC launches to the moon, it pulls the whole market with it, and ETH is the first passenger on that rocket.
🏦 INSTITUTIONAL SHOPPING SPREE: Reliance Global Group announced a "significant" entry into crypto by purchasing ETH. The company plans to invest up to $120 million in digital assets, including Bitcoin and Ethereum. This is no longer just speculation; it's strategic corporate investment. Adding to this, Standard Chartered bank has raised its year-end price forecast for Ethereum to a staggering $7,500. Big money believes in ETH, and that's a powerful signal.
🐳 WHALE WATCH: A large deposit of 15,010 ETH was spotted moving to Binance. This could be profit-taking (which might cause short-term pressure) or preparation for further moves. Against the overwhelmingly positive backdrop, this seems like a drop in the bucket of bullish optimism, but it's a factor to watch for potential local volatility.
📜 THE ETF EXPANSION IS HERE: The regulatory landscape is heating up. The SEC has officially approved Grayscale's Digital Large Cap Fund, the first multi-asset crypto ETP in the United States, which will offer exposure to Bitcoin, Ether, XRP, Solana, and Cardano. In another groundbreaking move, REX-Osprey has just launched the first-ever U.S.-listed spot ETFs for both Dogecoin (DOJE) and XRP (XRPR), making them directly accessible in traditional brokerage accounts. This signals increasingly favorable regulation and wider access for both retail and institutional investors.
Conclusion: The fundamental background is extremely bullish. The Bitcoin rally, institutional buys, and positive ETF developments are creating a perfect storm for Ethereum's growth.
Technical Analysis 📊
🔹 Daily Chart (1D): The big picture is pure bullish euphoria. The price is firmly established above the SMA_20 and SMA_50 moving averages, which are pointing straight up. Yesterday closed with a massive green candle. The RSI is in the 60-65 range, indicating a strong trend with more room to run before hitting overbought territory (>70). The MACD is climbing confidently above the zero line. The next target is a test of the recent high around $4850.
🔹 4-Hour Chart (4H): Here we see confirmation of the local trend reversal. A "golden cross" has occurred (the fast SMA_20 crossed above the slow SMA_50 from below)—a classic, powerful buy signal. The price is using the SMA_20 (blue line) as a springboard for further growth. Any pullback to this line is likely to be bought up.
🔹 30-Minute Chart (30M): On the lower timeframe, we see a healthy uptrend. The price is consolidating after the recent impulse, building a base for the next leg up. The SMA_20 and SMA_50 are acting as reliable support from below. The RSI is in bullish territory. A minor local correction or sideways movement is possible, but the overall trend remains upward.
Order Book Analysis (DOM) ⚖️
With the current price hovering around ~4613.29 USDT, the order book shows a tense battle.
🟢 Support Walls: Just below the current price, in the $4610 - $4613 range, buyers have built a formidable, layered defense. Orders at $4612.46, $4611.46, and $4610.53, each worth around $300,000, stand out. This bastion will be extremely difficult for sellers to breach.
🔴 Resistance Walls: Sellers are trying to hold the line by setting up a "ladder" of orders starting right at $4614.20 up to $4617. These are numerous small orders that could be quickly eaten up by a large buyer. Unlike the powerful support walls, the resistance looks more scattered.
Conclusion: The advantage lies with the buyers. Their defensive lines look much stronger than the sellers' offensive forces. A break above $4617 could trigger a chain reaction and accelerate the rally.
Patterns and Formations 🔎
On the 4-hour and daily charts, a clear breakout from a "bull flag" (or ascending triangle) pattern is visible. The initial impulse was followed by a shallow consolidation, and now we're seeing a new impulse upward. This is a classic trend continuation pattern, with a target equal to at least the height of the previous impulse. This opens the door to levels above $5000.
Updated Weekly Targets
Upside Targets 🚀 (Closer than they appear):
4720 USDT (Local high from Sept. 12, first psychological test).
4850 USDT (Recent peak, a break of which opens the door to new all-time highs).
5000 USDT (Key psychological milestone and a target for many analysts).
Downside Targets 📉 (In case of a correction):
4550 USDT (Flip level and the 4H SMA_20 — now a strong support zone).
4450 USDT (Area of the 4H "golden cross" and SMA_50, a critical support zone).
4350 USDT (The daily SMA_20, the bulls' last line of defense).
Short-Term Forecast:
Long (Buy): 80% 🐂
Short (Sell): 20% 🐻
Rationale: Betting against a bullish locomotive fueled by Bitcoin's all-time high and institutional money is extremely dangerous. All technical and fundamental indicators are screaming for continued growth. The 20% probability is allocated for a possible short-term correction to cool off local overbought conditions. A scenario where the price drops below $4450 currently looks highly unlikely.
Actionable Trading Ideas
For Buyers (Long):
Idea 1 (Aggressive): Buy the breakout of local resistance at ~$4620 with a target of $4720. Stop-loss: below the $4590 support level.
Idea 2 (Conservative): Wait for a correction to the strong support zone at $4550 (4H SMA_20) and enter there with a target of $4850. Stop-loss: below $4480.
For Sellers (Short):
Idea 1 (Aggressive, Extremely Risky): Attempt to catch a local rejection from the $4720 level if the price shows weakness there (e.g., a pin bar on the 1H/4H chart). Target: $4640. Stop-loss: very tight, just above the local high.
Idea 2 (Conservative): Stay on the sidelines. In the current market conditions, shorting is playing against the trend and is highly likely to result in losses.
Recommendations for Traders
The market is in a state of euphoria. Beware of FOMO (Fear Of Missing Out) and don't jump on a moving train at any price. The best strategy for going long is to enter on minor pullbacks to support levels. Don't forget risk management and always use stop-losses, as even in a bull market, sharp corrections can happen.
May your decisions be calculated and your portfolios green! Trade with a cool head and a hot heart.
Liked this breakdown? Smash that like button 👍 and subscribe so you don't miss the next liftoff! 🚀
ETH ANALYSIS🔴 #ETH Analysis : ❓❓
🔮There is a formation of "Bullish Pennant Pattern" in #ETH in 4HR time frame. We can expect around $4850 bullish move if the price break the pattern.📈
⚡️What to do ?
👀Keep an eye on #ETH price action. We can trade according to the chart and make some profits. ⚡️⚡️
#ETH #Cryptocurrency #Breakout #DYOR

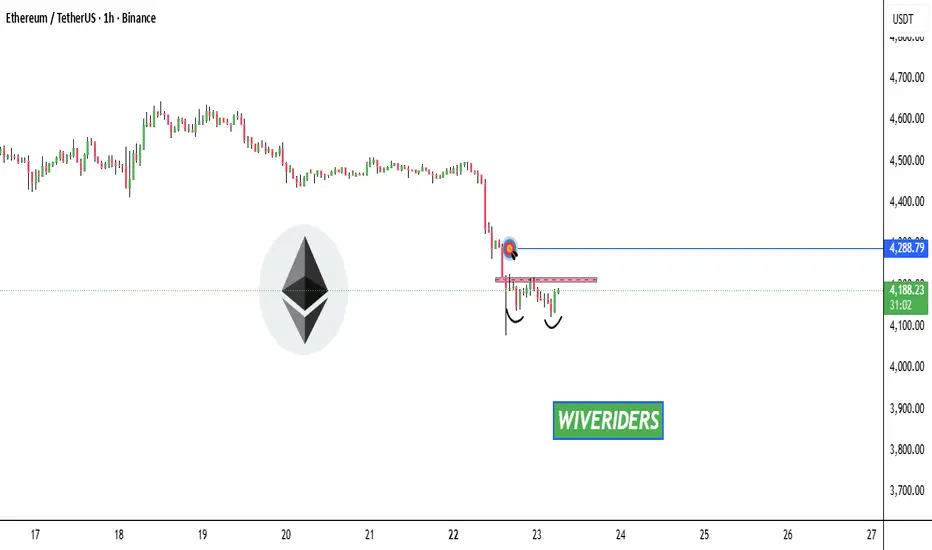
ETHUSDT | Double Bottom Reversal | 1H SetupDescription:
📊 Pair: ETHUSDT
⏰ Timeframe: 1H
🔎 Analysis:
Ethereum (ETHUSDT) has formed a double bottom pattern around the 4100–4120 support zone, signaling a potential bullish reversal after the recent downtrend. This structure suggests that buyers are defending this level, and a breakout above the neckline confirms upward momentum.
📌 Trade Plan (Example Setup):
Entry: 4217.9 (neckline breakout)
Stop Loss: 4104.45 (below pattern support)
Target Profit 1: 4324.24
Target Profit 2: 4430.52
Risk:Reward: Approx. 1:2+
⚠️ This analysis is for educational purposes only. Not financial advice.
Hashtags:
#ETH #Ethereum #ETHUSDT #Crypto #TradingSignals #TradingView

Ethereum 4250 breakAs i said in my last post, A daily close below $4,250 will take Eth down at least 8% from that level.
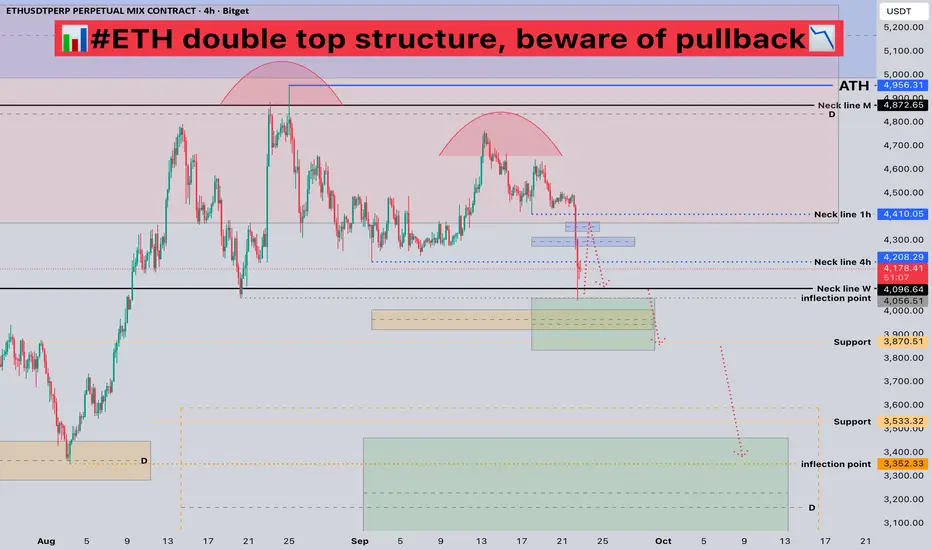
#ETH Double Top Structure, Beware of Pullback📊#ETH Double Top Structure, Beware of Pullback📉
🧠From a structural perspective, we've formed a bearish double top structure within the red target zone, so be wary of a deeper pullback.
➡️After today's plunge, we retested the weekly neckline support. We're currently in a rebound phase and have encountered resistance at the 4H neckline. Don't chase the rally here! Strong resistance lies around 4300-4400. If price reaches this level, look for shorting opportunities.
🤜If you like my analysis, please like 💖 and share 💬
BITGET:ETHUSDT.P
$ETH shows bullish hidden RSI divergence.A **bullish hidden RSI divergence** is a trading signal that suggests a continuation of an upward trend, often indicating that the price will keep rising. It occurs when the price action and the Relative Strength Index (RSI) show a specific pattern. Here's a simple explanation of how to identify and trade it:
### Step 1: Understand the Pattern
- **Price Action**: The price makes **higher lows** (each low point is higher than the previous one), indicating an uptrend.
- **RSI**: The RSI makes **lower lows** (the RSI is declining while the price is not), showing a divergence from the price trend.
- This mismatch suggests that the uptrend is still strong, and the dip in RSI is just a temporary slowdown in momentum, not a reversal.
### Step 2: Identify the Divergence
1. **Chart Setup**: Use a price chart (e.g., candlestick chart) with the RSI indicator (typically set to 14 periods) on a platform like TradingView .
2. **Spot Higher Lows in Price**: Look for a price chart where the recent low is higher than the previous low (e.g., $100 to $105).
3. **Check RSI for Lower Lows**: At the same time, check if the RSI is making a lower low (e.g., RSI drops from 50 to 45 while price makes a higher low).
4. **Confirm the Uptrend**: Ensure the overall trend is bullish (price is generally moving up with higher highs and higher lows).
### Step 3: Trading the Bullish Hidden RSI Divergence
1. **Entry Point**:
- Enter a **buy** trade when you confirm the divergence and see the price starting to rise again after the higher low.
- Look for additional confirmation, like a bullish candlestick pattern (e.g., a hammer or engulfing candle) or a break above a resistance level.
2. **Stop Loss**:
- Place a stop loss below the most recent higher low to protect against a potential trend reversal.
- For example, if the higher low is at $105, set the stop loss slightly below, like $103.
3. **Take Profit**:
- Target a take-profit level based on previous highs, support/resistance levels, or a risk-reward ratio (e.g., 1:2, meaning you aim for twice the profit compared to your risk).
- For instance, if your stop loss is $2 below entry, aim for a $4 profit target.
### Step 4: Manage the Trade
- **Monitor RSI**: Ensure RSI doesn’t drop into oversold territory (below 30) or show signs of a bearish reversal.
- **Adjust Stop Loss**: As the price moves up, consider trailing your stop loss to lock in profits.
- **Exit Strategy**: Exit the trade if the price hits your target, or if you see signs of a trend reversal (e.g., a bearish divergence or break of key support).
### Example
- **Price**: Stock XYZ makes a low at $100, then a higher low at $105.
- **RSI**: RSI drops from 50 to 45 during the same period.
- **Action**: You enter a buy trade at $106 after a bullish candle. Set a stop loss at $103 and aim for a take-profit at $110 (1:2 risk-reward).
- **Outcome**: If the price continues its uptrend to $110, you take profit. If it drops below $103, you exit with a small loss.
### Tips
- **Timeframes**: Use higher timeframes (e.g., 1-hour, 4-hour, or daily) for more reliable signals.
- **Confirmation Tools**: Combine with other indicators like moving averages or trendlines for stronger signals.
- **Practice**: Test this strategy on a demo account before using real money to understand how it works in different market conditions.
- **Risk Management**: Never risk more than 1-2% of your trading account on a single trade.
This strategy works best in trending markets, so always confirm the broader trend before trading.

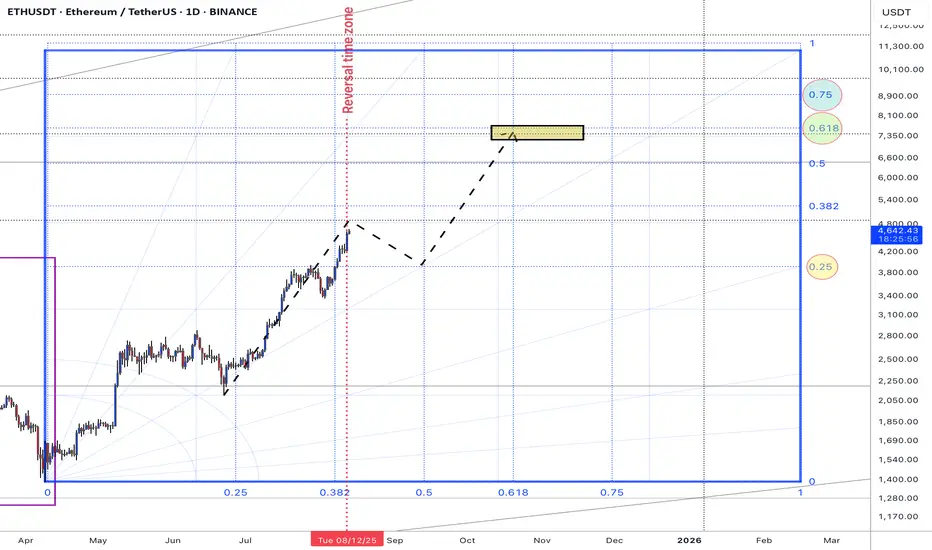
ETHUSDT #009 (Be careful, need 15-20% correction for next cycleHello dear traders.
Good days.
First of all thanks for your support and comments.
————————————————————————
On daily Gann Square ETHUSDT break out 0.5 Gann Square price zone and with good strength trend line support it expected to fill 0.618 Gann box price level at exact reversal time zone .
So be careful and do not be FOMO . expected to grow up to 4800$ and correct 15-20 % correction for retest 0.5 Gann price zone .
If support at 3940-3915 $ will grow up fro next bull cycle .
BTC Dominance is mached also at exact time with ETHUSDT .
Weekly overview of ETHUSDT Chart will updated.
Good luck and safe trades.
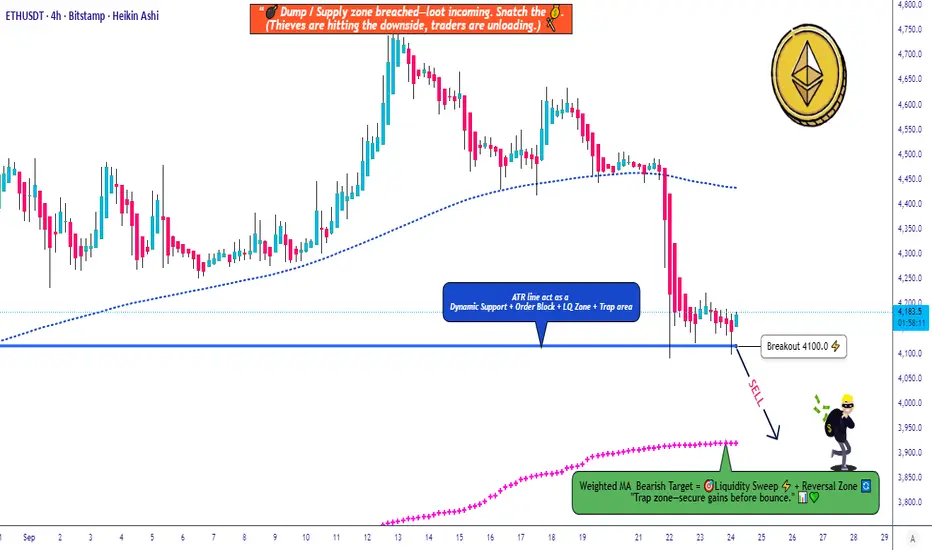
ETH/USDT Drop Plan Layered Entries + Smart EscapeETH/USDT 🚀 Market Wealth Strategy Map (Swing/Day Trade)
Market Outlook:
🔻 Bearish Confirmation: Watch for candle breakouts below the ATR Line @ 4100. This signals sellers gaining control — perfect for short entries.
Entry Plan (Thief Style 🕵️♂️):
💡 Multiple layered entries using limit orders (Thief layering strategy):
Sell layers: 4250 | 4200 | 4150 (adjust layers as per your own preference)
⚠️ Important: Set layer limit orders only after breakout confirmation. Do not enter blindly.
Stop Loss (SL):
⛔ Thief SL: 4300
Note: Dear Ladies & Gentlemen (Thief OG’s), SL is your choice — manage your risk and profits at your own discretion.
Target (TP):
🎯 Target: Weighted Moving Average Line (~3900) — strong support, oversold signals, and trap potential. Escape with profits before market catches you.
Note: TP is also your choice, manage money at your own discretion.
Related Pairs to Watch 🔗:
BINANCE:BTCUSDT : Correlated short setups, watch BTC for confirmation.
BINANCE:ETHBTC : Relative weakness/strength check vs Bitcoin.
BINANCE:BNBUSDT : Can provide additional trend confirmation in altcoin moves.
Key Points / Correlations:
ETH closely follows BTC sentiment; if BTC tanks, ETH likely follows.
Layering strategy allows flexible entries, reducing risk exposure.
Oversold + WMA support often signals profit escape zones for smart exits.
✨ “If you find value in my analysis, a 👍 and 🚀 boost is much appreciated — it helps me share more setups with the community!”
Disclaimer: This is Thief style trading strategy, just for fun.
#ETHUSDT #Ethereum #CryptoTrading #SwingTrade #DayTrade #ThiefStrategy #CryptoAnalysis #CryptoLayering #TradingViewIdeas #CryptoSetup
ETH ANALYSISETH has broken above the long-term trendline, a major structural shift on the weekly chart.
From here, I think price may pull back to retest the trendline along with the bull market support band.
If that retest holds and momentum stays constructive, ETH could bounce strongly and eventually push toward making a new all-time high.
🎯 Conclusion: My view is bullish in the bigger picture — I expect ETH to retest the trendline and bull market support band before attempting a major breakout to new highs.

ETH has formed a potential Double Bottom pattern 📊 CRYPTOCAP:ETH Market Update
CRYPTOCAP:ETH has formed a potential Double Bottom pattern ✅
It’s now testing the red resistance zone 🔴 — if it breaks out with confirmation, the first target will be the blue line level 🎯
ETH - 17/09 VS TODAY - MASTERCALL AGAIN! 🏆 #ETH - 17/09 vs Today - Update 🔄
Medium-Term Outlook: “Insane Plays Ahead!” 🔥
🎯Targets hit: $4,000–$4,050 liquidity zone ✔️
Current TA:
🔸Price rejected sharply; H4 looks bearish, RSI is highly oversold.
🔸Short-term: potential for a relief bounce!
🔸Possible scenario: Retest of the $4,300–$4,350 former support ahead? 📈
Weekly Structure
🔹Bias stays bullish long-term.
🔹BUT: Structure reminds me a lot of #BTC right before its massive run!
🔹Are we about to see an extra dip towards $3,700- $3,800 before the next moon mission? (Check chart for context!)📉💣
Short-Term Bias
🔹Price action = Neutral & tricky.
🔹Bulls want a reclaim above $3,780 to keep the upper hand.
🔹Big risk: If we break below $3,780 → likely drop to $3,300–$3,200 range!⚠️
Local Support Zones
$4,070
$4,000
💡Summary
Still bullish medium/long term, but a further correction is very possible before liftoff!
Bulls need to hold $3,780. Below = trouble…Above = game still on for ATH attempts later. 📉

ETH still in short term downtrendStill bounded by -$50/day line
Wait for it to break this line to check if changing short term trend.

#ETHUSDT 6H ChartPrice is currently retracing and is sitting on the EMAs. MACD and RSI and both neutral. Price may retest the 100MA before potentially continuing its upward movements towards our minor supply.

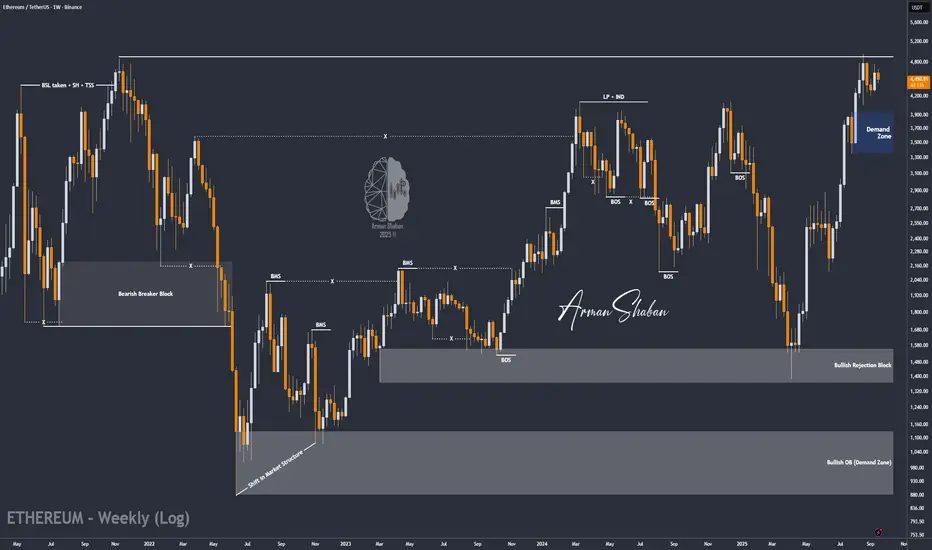
ETH/USDT | Ethereum Pullback Over? Next Stop New Highs! (READ)By analyzing the Ethereum chart on the weekly timeframe, we can see that after climbing to $4,700, the price pulled back and is now trading around $4,500. If ETH can hold above the $4,480 level, we can expect more upside.
However, today the market will be very volatile due to the Fed interest rate decision. With that condition in mind, the next possible bullish targets for Ethereum are $5,100, $5,500, and $6,000.
Please support me with your likes and comments to motivate me to share more analysis with you and share your opinion about the possible trend of this chart with me !
Best Regards , Arman Shaban
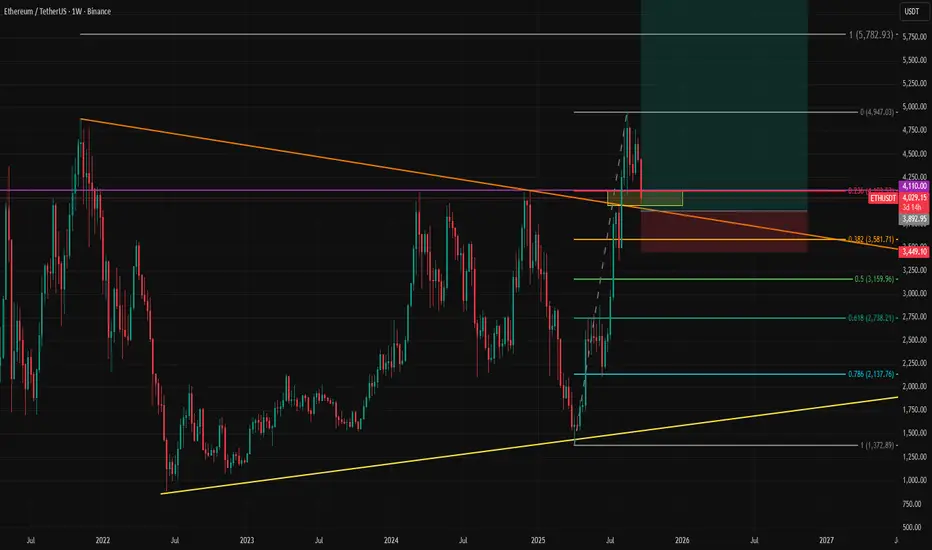
ETHUSD Retests Broken Trend on Weekly TimeframeEthereum is retesting the broken trendline and is likely setting up for another leg higher. Unless there is persistent pricing below $4,000, this selloff is likely to become a buying opportunity for those who missed the earlier rally.
Our year-end (or end of the first quarter of 2026) target above $7,000 still stands. The main risk is a potential selloff in the US stock market, which could drag crypto lower if the correlation remains intact.
ETH to around $4000I see a diamond pattern in the works. If this plays out it would be a nice short. NFA.

#ETHUSDT 4H ChartPrice is consolidating on lower timeframes showing no major movements. MACD is showing bearish weakness, RSI is oversold and EMAs are turning bearish. Price is expected to move up and retest the S/R Flip at $4,260 as a short-term target.

Showing second chance wayching multi timeframe RSI'sShowing second chance wayching multi timeframe RSI's - More of swing ideas using Price Action Reader

$ETH Cup and Handle --> around ATH {Breakout possibility}While we dance around the break of the previous ATH, there's a likelihood that we see newer, higher prices by the end of the week/month.
Price is around $4500 and sees recurring sponsorship to stay above $4400 (61.8% fib)
Could this be the >$5k/ETH month?
Bullish indicators described in chart
cup and handle pattern
price above 50% fib swing
Ethereum: AI Models Signal Imminent Bear MarketOn August 24, 2025, Ethereum reached a new all-time high of $4,958, just below the $5,000 mark. The price is now about 10% lower but remains within striking distance. While investors are still hoping for further records, leading AI models warn that the next bear market could begin sooner than expected.
Historical Patterns
According to ChatGPT 5.0, Ethereum has historically shown sharper and faster corrections compared to Bitcoin:
During the 2017–2018 cycle, after reaching an all-time high of around $1,430 in January 2018, the price collapsed to $85 by December the same year. This represented a decline of roughly –94%, lasting about 11 months.
The next cycle in 2021–2022 followed a similar pattern, though less dramatic. ETH peaked at $4,870 in November 2021, but by June 2022 it had dropped to $880. The correction amounted to about –82% and took roughly 7 months.
ETH losses were both deeper and faster than BTC during past downturns.
ChatGPT 5.0 Forecast
• Bull Market ATH (2025): conservative $8,000, optimistic $12,000–$15,000
• Bear Market Low: $1,200–$3,000
• Timeline: Q2–Q3 2026
Other AI Forecasts
• Gemini 2.5 Pro (Google): ATH $10,000–$15,000, low $1,500–$3,000, bear market starting Q4 2025
• Claude 4 Sonnet: ATH up to $18,000, low $3,000–$4,500, possible bull run extension into Q1 2026
• Grok 4 (X/Elon Musk): ATH $15,000, low $2,400–$2,800
• Qwen 3 (Alibaba): ATH $11,500–$16,500, low $1,955–$3,630
• Kimi K2 (Moonshot AI): ATH up to $20,000, low $3,000–$5,000
• Llama 4 Maverick (Meta): ATH $12,000, low $1,800
• DeepSeek V3.1: ATH $18,000, low $2,500–$3,000
Conclusion
All AI models expect the Ethereum bear market to start by late 2025, with only a few forecasting an extension into Q1 2026. Most projections anticipate new record highs before a steep correction. The consensus for ETH’s bear market bottom ranges between $2,000 and $3,000.
