Ethereum to NEW ALL TIME HIGHBecause Ethereum holds above the critical 4000 support level, the bullish divergence on the daily RSI could drive it to break the 4800 resistance.
ETHUSDT.P trade ideas

Understanding Currency Derivatives: Types and Trading Roles1. Types of Currency Derivatives
Currency derivatives come in several forms, each designed to serve specific purposes. The main types are:
1.1 Currency Forward Contracts
What they are: A forward contract is a private agreement between two parties to exchange a specific amount of currency at a predetermined rate on a future date.
Key features:
Customized terms (amount, rate, settlement date)
Traded over-the-counter (OTC), not on exchanges
Use in trade:
Companies use forwards to hedge against currency fluctuations. For example, an exporter expecting $100,000 in 3 months can lock in a rate today, ensuring revenue stability regardless of market movements.
1.2 Currency Futures
What they are: Futures are standardized contracts to buy or sell a currency at a fixed price on a future date. They are traded on exchanges, unlike forwards.
Key features:
Standard contract sizes
Daily settlement (marked-to-market)
Reduced counterparty risk due to exchange involvement
Use in trade:
Futures allow both hedgers and speculators to manage risk. For example, an importer can lock in costs for future purchases in foreign currency using futures contracts.
1.3 Currency Options
What they are: Options give the holder the right, but not the obligation, to buy or sell a currency at a specific price within a certain period.
Types:
Call option: Right to buy
Put option: Right to sell
Use in trade:
Options are popular for hedging with flexibility. For example, an exporter may buy a put option to protect against a falling foreign currency while still benefiting if the currency rises.
1.4 Currency Swaps
What they are: A swap is a contract to exchange cash flows in one currency for cash flows in another over a period.
Key features:
Can involve both principal and interest
Often used between banks or large corporations
Use in trade:
Swaps help companies obtain foreign currency loans at better rates than borrowing directly in foreign markets.
1.5 Cross-Currency Contracts
What they are: These contracts allow the exchange of currencies without involving a common base currency like the USD.
Use in trade:
Useful for companies trading between countries whose currencies are not widely paired, e.g., INR and JPY.
2. Role of Currency Derivatives in Trade
Currency derivatives serve multiple roles in global commerce:
2.1 Hedging Against Currency Risk
Companies engaging in international trade face unpredictable currency movements.
By locking in exchange rates using derivatives, businesses stabilize revenue and costs.
Example: An Indian IT company exporting to Europe can hedge against the euro weakening against the rupee.
2.2 Speculation
Traders and investors use currency derivatives to bet on currency movements to make profits.
Speculation adds liquidity to the market, which indirectly benefits businesses by making it easier to execute hedging strategies.
Example: A trader may buy USD futures if they anticipate the dollar will rise against the rupee.
2.3 Arbitrage Opportunities
Arbitrage involves exploiting price differences in the same currency across different markets.
Currency derivatives allow arbitrageurs to profit from mismatches while keeping markets efficient.
Example: If EUR/USD is slightly higher in one exchange than another, a trader can simultaneously buy low and sell high.
2.4 Portfolio Diversification
Investors use currency derivatives to diversify their portfolios by gaining exposure to foreign currencies.
This can help mitigate risks from domestic market volatility and improve returns.
Example: A mutual fund in India may use currency options to reduce risk exposure from foreign investments.
3. Market Participants
The main participants in currency derivatives markets include:
Hedgers – Companies or institutions aiming to reduce currency risk.
Speculators – Traders aiming to profit from currency movements.
Arbitrageurs – Market participants exploiting price differences across markets.
Market Makers – Entities providing liquidity, ensuring smoother trading operations.
4. Regulatory Framework
In India, currency derivatives are regulated by:
SEBI (Securities and Exchange Board of India): Ensures transparency and fair trading practices.
RBI (Reserve Bank of India): Ensures participants have genuine foreign currency exposure to prevent excessive speculation.
This regulatory framework ensures the market remains safe, transparent, and reliable.
5. Advantages of Currency Derivatives
Risk Management: Protects businesses against unexpected currency fluctuations.
Flexibility: Especially with options, businesses can choose to benefit from favorable movements while limiting losses.
Liquidity: Standardized contracts in futures and options provide liquidity to the market.
Efficient Global Trade: Reduces uncertainty in cross-border transactions, encouraging international business.
6. Challenges and Risks
Market Risk: Currency values can be volatile; wrong predictions can lead to losses.
Counterparty Risk: In OTC contracts, one party may default.
Complexity: Some derivatives like swaps are complex and require expertise.
Regulatory Constraints: In some countries, rules may limit derivative usage or impose restrictions.
Conclusion
Currency derivatives are indispensable tools for modern international trade. They allow businesses to manage risk, stabilize cash flows, and plan effectively. At the same time, they provide opportunities for traders and investors to profit from currency movements and engage in arbitrage.
By understanding and using these instruments responsibly, companies can reduce uncertainty in global transactions, while financial markets benefit from improved liquidity and efficiency.
With increasing globalization and cross-border trade, the importance of currency derivatives will continue to grow, making them a critical part of financial markets worldwide.
#ETHUSDT 6H ChartPrice retested the 100MA inside our 4h demand zone and moved up exactly as predicted. MACD is turning bullish, RSI is bought and EMAs are bullish. Price is expected to reach the minor supply at $4,730 as a short-term target.

Ethereum Trade Setup📲 NFX Trade Alert – Swing Setup
💹 Instrument: Ethereum COINBASE:ETHUSD
🛒 Trade Type: Swing – Buy at Market
📍 Entry: $4,690
⛔ Stop Loss: $4,624 (tight stop placed just below the S/R breakout level)
✅ Target Profit: $5,050
📊 Trade Setup Analysis – BINANCE:ETHUSD
MARKETSCOM:ETHEREUM Ethereum showed no weakness over the weekend, breaking decisively above the $4,650 resistance and extending toward $4,750. Price has since retested $4,650(23.6% Trend Fib), with strong rejection confirming this former resistance is now acting as solid support.
We’re applying a tight stop loss at $4,624, just below the breakout level, to minimize risk while maintaining bullish exposure.
With this breakout confirmed, there’s no major resistance until the previous ATH around $4,950. The path remains open for continuation higher.
⚖️ Risk management remains key - even strong, high-probability setups demand discipline and protection. 💚

Ethereum Holds $4,500 as Key Support in Market Structure TestEthereum has corrected back to $4,500, a level that once acted as resistance and now flipped into strong support. Holding this zone is crucial for the bullish case.
Following its recent correction, Ethereum is trading at a pivotal level that will determine its next decisive move. Market structure suggests a potential rebound, though risks of deeper correction remain.
Key Technical Points:
$4,500 reclaimed as high-timeframe support.
VWAP sits just below as added confluence.
Point of control lies beneath as fallback support.
Ethereum’s current positioning highlights the importance of historical resistance-turned-support levels. The $4,500 zone, which capped price earlier this year, has now flipped into support and is being tested again. Confluence with VWAP reinforces this as a critical level.
Failure to hold $4,500 would open the door for a move toward the point of control, another high-timeframe support where buyers may step in. Until then, ETH is expected to trade around these technical markers as traders wait for confirmation of direction.
What to Expect in the Coming Price Action:
If Ethereum successfully holds $4,500, continuation toward higher resistance becomes the probable scenario. A breakdown, however, sets the stage for testing the POC before any renewed push higher.
Long ETHUSDTHello traders!
After a succesful break above resistance, I'm looking for this scalp long.
Don’t forget to like and share your thoughts in the comments! ❤️

ETH/USDT 1D chart review🔎 Technical analysis
1. Trend
• You can see a clear growth trend line (orange). The price consistently reflected from her, which means that the buyers defend this level.
• Currently, the price is above trendline, which is a bull signal.
2. Support and resistance
• Support:
• $ 4,429
• USDT $ 4,556
• resistance:
• $ 4.687 USDT (current price fight - this is where the market is testing)
• USD 4,793 (strong resistance)
• USD 4,954 (key psychological resistance - nearly 5K)
3. Candles
• We have a long green up move - the momentum is strong.
• The last candles show a little indecisive at 4.687 (upper shadows), i.e. possible consolidation or back.
4. STOCHASTIC RSI (oscillator at the bottom of the chart)
• enters the purchase zone (> 80).
• This often heralds correction, but in strong trends the indicator can last long.
⸻
📊 Scenarios
• bull (continuation of growth):
If ETH stays above 4.687 and pierces 4.793, the next goal is 4.954 (and then psychological 5,000).
• Bear (correction):
Rejection 4.687 and descent below 4.556 can open the way to the Trendline test around 4.430.
Puncting the trend down is a reversal signal and a possible drop towards 4.200.
⸻
📌 Summary
• Main trend: upward.
• Momentum: Strong, but the indicators show buying.
• Strategy:
• Careful entrances with support (4.556 / 4.430).
• confirmed breaking 4.793 = strong signal for further increases.
• Stop loss below Trendline (~ 4,400), because it will negate the current script of the bull

#ETH is on a mission New ATH#ETH is on a mission to reach its new all-time high (ATH).
First, it may liquidate some long traders, then fill the order blocks of smart buyers before creating a new ATH.
~Namaste~
$ Jai Shree Ram $

Ethereum at a Critical Resistance Zone – Will $4,800 Hold or Bre📝 Analysis:
Ethereum (ETH/USDT, 4H) is testing a critical resistance zone at $4,700–$4,800, where several technical factors converge:
1. Descending Channel:
Price is touching the upper boundary of the long-term descending channel.
2. Fibonacci Extension:
The recent rally has reached the 1.618 Fibonacci extension (~$4,720), which often acts as a potential reversal zone.
3. Resistance Cluster:
The $4,700–$4,800 area combines both static resistance and the channel top, making it a high-risk region for buyers.
4. Wave Structure:
The strong rally from ~$4,050 could be part of a corrective wave (possibly Wave D). If ETH fails here, we may see a sharp pullback.
⸻
📊 Scenarios:
🔸 Bearish Case (more likely):
Rejection from $4,720–$4,800 could trigger a correction toward:
• First support: $4,580–$4,600
• Key support: $4,100–$4,200
🔸 Bullish Case (conditional):
A daily close above $4,800 would confirm a breakout from the channel, opening the door for targets at:
• $4,950–$5,000
⸻
📌 Conclusion:
ETH is at a make-or-break level. Failure to hold above $4,800 could bring a strong correction, but a confirmed breakout may fuel a run toward $5,000.

ETH/USDT: Bullish Rise to 4770?As the previous analysis worked exactly as predicted, BINANCE:ETHUSDT is gearing up for a bullish move on the 4-hour chart , with an entry zone between 4350-4395 near a key support and trendline.
The target range of 4735-4770 aligns with the next resistance, signaling strong upside potential. Set a stop loss on a close below 4228 to manage risk effectively. Watch BTC trends! 💡
📝 Trade Plan:
✅ Entry Zone: 4350 – 4395 (support + trendline area)
❌ Stop Loss: Daily close below 4228 to manage risk
🎯 Target Zone: 4735 – 4770 (next resistance level)
Ready for this lift-off? Drop your take below! 👇

Volatility Period: Around September 18th (September 17th-19th)
Hello, fellow traders!
Follow us to get the latest information quickly.
Have a great day!
-------------------------------------
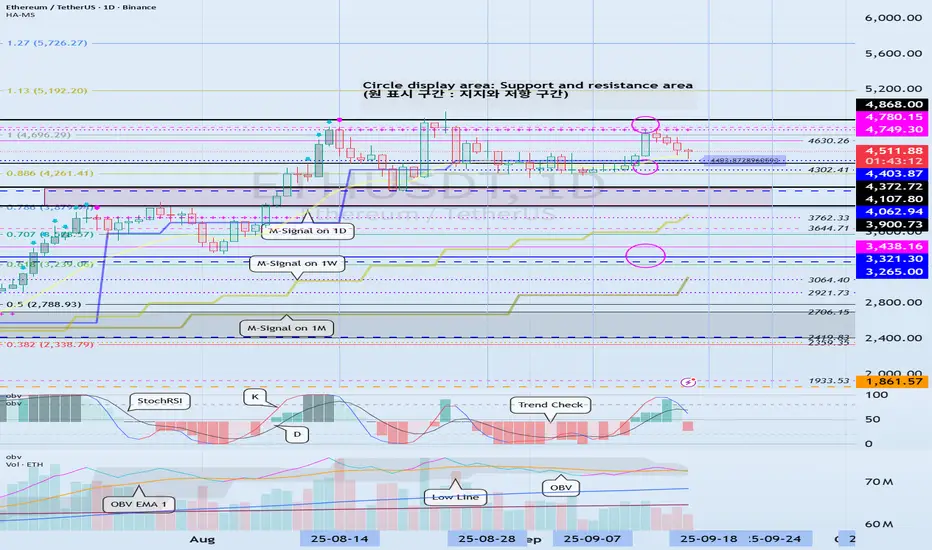
(ETHUSDT 1D Chart)
The 4403.87-4749.30 range, which is the HA-High ~ DOM (60) range, represents a resistance zone.
Therefore, we need to monitor the price movement after the current volatility period, around September 18 (September 17-19).
To sustain the uptrend, the price must remain above the 3900.73-4107.80 range.
From a medium- to long-term perspective, the 3265.0-3321.30 range is a key area.
Considering the above, if it falls below 4403.87,
1st: 4107.80-4372.72
2nd: 3265.0-3321.30
Therefore, it is likely to fall to the first and second levels above.
Therefore, the key question is whether it can find support near 4403.87 after this period of volatility.
-
When trading, it's important to understand the current price level.
I believe there are several ways to determine this.
My basic trading strategy is to determine when to trade.
My basic trading strategy is to buy when support is found in the DOM(-60) ~ HA-Low range and rise, and to sell when it touches the HA-High ~ DOM(60) range.
However, if the price rises in the HA-High ~ DOM(60) range, a step-like upward trend is likely, while if it falls in the DOM(-60) ~ HA-Low range, a step-like downward trend is likely.
Therefore, the basic trading strategy should be a segmented trading strategy.
If you were unable to buy in the DOM(-60) ~ HA-Low range, but the current price is within the DOM(-60) ~ HA-Low range, you should check for support.
Support is determined by checking whether support is found near the HA-Low or DOM(60) indicators.
If you bought when support was found near the HA-Low indicator, the first sell position would be near the DOM(60) indicator.
If you bought when support was found near the DOM(60) indicator, you should execute the trade quickly and effectively.
If the price falls below the purchase price, it would be considered a buy at the high.
To prevent this to some extent, we've utilized several indicators for verification.
First, we utilize the M-Signal indicator on the 1M, 1W, and 1D charts.
That is, if the M-Signal indicator is passing near important support and resistance levels, the presence of support in that area is likely to play a more important role.
Currently, the M-Signal indicator on the 1D chart is passing near 4403.87, so we should consider the area around 4403.87 as a potential important support and resistance level.
Second, we should monitor the movements of auxiliary indicators such as the TC (Trend Check) indicator, the StochRSI indicator, and the On-By-Signal (OBV) indicator.
For the price to continue its upward trend in this important support area,
- the StochRSI indicator must show an upward trend. If possible, it's best to avoid entering the overbought zone.
- The OBV indicator should be showing an upward trend. If possible, it should remain above the High Line.
- The TC (Trend Check) indicator should be showing an upward trend. If possible, it should remain above the 0 level.
By monitoring the movements of the three indicators above, you can determine whether there is support near important support and resistance levels.
However, you should not blindly trust the movements of auxiliary indicators. Even if you have identified the movements of auxiliary indicators, you should always monitor the price movement.
To determine support, you should monitor the price movement for at least 1-3 days.
This is especially important during periods of volatility.
Volatility is a period where you cannot predict the direction of movement, so extra caution is required.
Therefore, if possible, it's better to observe the situation and find a trading opportunity after the volatility period has passed rather than entering a new trade during a volatile period.
-
Thank you for reading to the end. I wish you successful trading.
--------------------------------------------------
- Here's an explanation of the big picture.
(3-year bull market, 1-year bear market pattern)
I'll explain more in detail when the bear market begins.
------------------------------------------------------
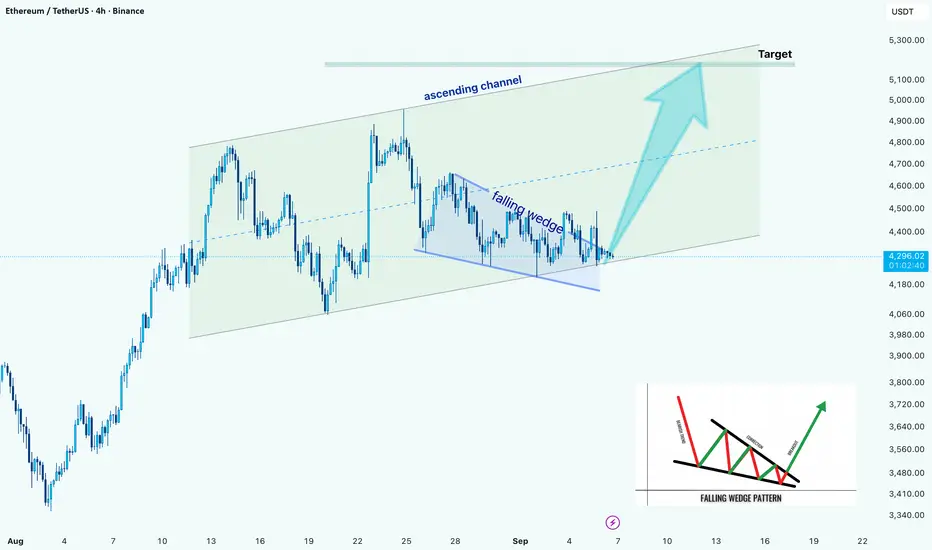
ETH/USD –> Falling Wedge Breakout Within Ascending ChannelHello guys!
Ethereum is showing a strong technical setup on the 4H chart. Price has been respecting an ascending channel since early August, and within this structure, a falling wedge has recently formed.
Right now, ETH is testing the wedge breakout point near the bottom line of the channel. If buyers manage to hold momentum here, we could see price extending toward the channel’s upper boundary, with the next major target sitting around $5,100 – $5,300.
On the downside, failure to sustain above the wedge support may lead to a retest of the lower channel trendline around $4,100 – $4,150, which remains a critical support area for bulls to defend.
ETHUSDT.PHello friends
Given the good growth we had, the price has made a 14% correction. If the specified support is maintained, the price can see the specified targets. If the support is broken, the price can fall by another step. We have identified important support points for you.
*Trade safely with us*

ETH UPDATEHello friends
Well, you can see that due to the bearish market cycle, the downward steps have gradually become smaller and we have hit a higher ceiling at the specified support, which is a sign of a weak trend or price flooring. If this specified price floor is maintained, the price can move to the specified targets.
*Trade safely with us*

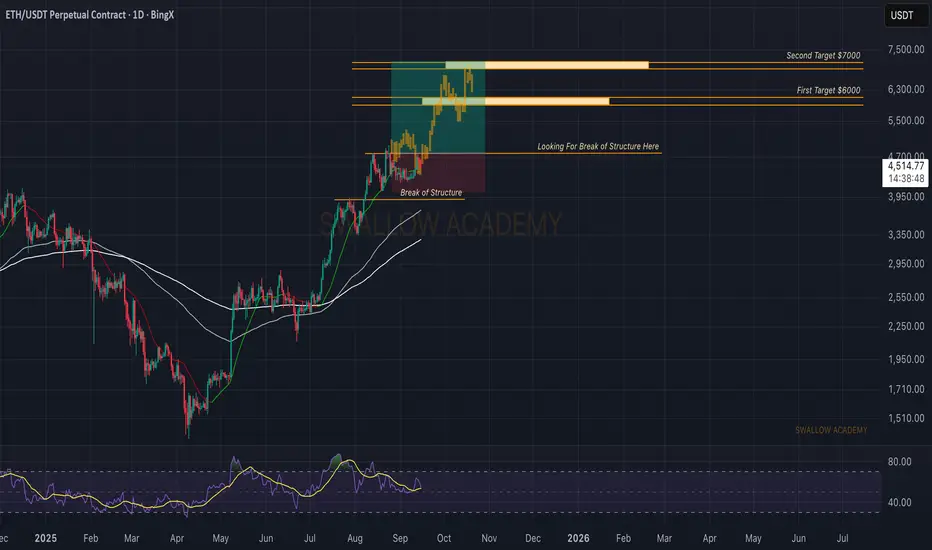
Ethereum (ETH): About To Explode | Very BullishGameplan remains the same, we wait for a break of the local high. Buyers keep the momentum, and once that breakout happens, we look for a strong move to the upside. First target sits at $7K, with $9K as the major one.
Swallow Academy

ETHUSDT – The “BIG” Wave Is Coming ?Hello everyone, glad to see you again as we dive into BINANCE:ETHUSDT !
Today, Ethereum continues to show strong accumulation as it consolidates tightly around the 4,200 USDT support zone. This area is being strongly defended and also aligns with key retracement levels on higher timeframes, suggesting that the bulls are far from giving up.
At the moment, ETH is in a “compressed spring” state – the longer it moves sideways, the stronger the breakout potential. If the support holds, we could see a powerful bullish wave emerge, with the potential to test resistance and even break higher. Smart traders know: accumulation equals opportunity!
What about you – do you think ETH will break through or bounce back from the 4,800 USDT resistance? Share your thoughts in the comments below!

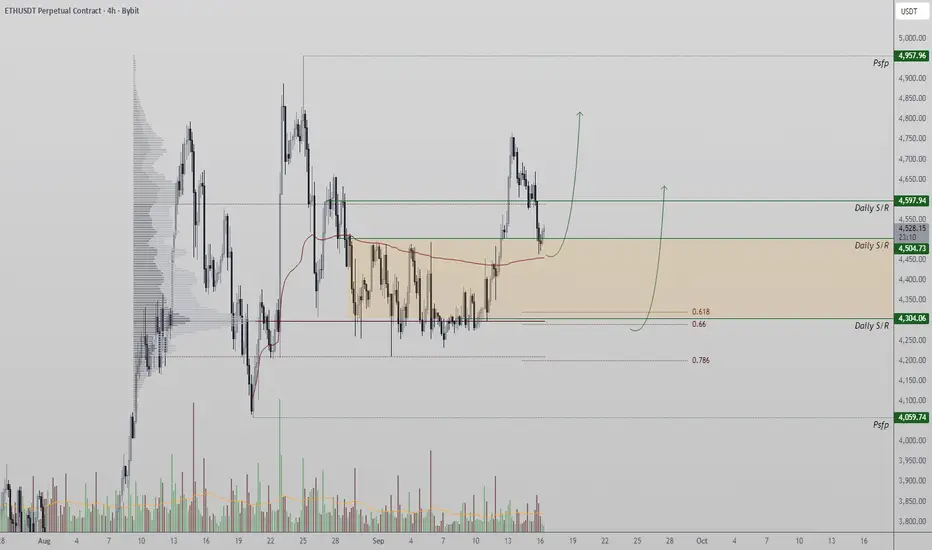
ETHUSDT → Correction and hunt for liquidity ahead of growth BINANCE:ETHUSD is showing positive dynamics and breaking through the resistance conglomerate (consolidation boundary and downward correction line). The fundamental background is positive, and bulls are generally quite confident...
The cryptocurrency market, Bitcoin, and altcoins are awaiting a batch of positive news. Traders are waiting for interest rates to fall, which could attract additional capital to the cryptocurrency market, especially ETH.
The breakout of the correction resistance and consolidation resistance gives the market hope for growth. The global trend is bullish, and the fundamental background is positive. If the bulls hold their defense above 4488-4450, ETH may strengthen.
Resistance levels: 4661, 4783
Support levels: 4488, 4450
Technically, I expect a false breakdown of support (retest of the liquidity zone). If this maneuver ends with the price closing above 4488 and the formation of a confirming bullish pattern, then in this case, we can consider the continuation of growth.
Sincerely, R. Linda!

Ethereum (ETH): Price Still Above EMAsETH has been holding well above the EMA support zone, where buyers continue to step in. Price is still consolidating around the breakout area, but as long as the support holds, we expect momentum to kick back in with $5,555 remaining the next target.
Swallow Academy

ETHEREUM ETHUSDT ,WE are watching the price action for next possible trade direction. The right direction is to allow the weekly time frame form a double top and aim the break of the neckline and sell down.
break above will be open for long position.
trading is probability
RISK MANAGEMENT IS KEY.
#ETHUSDT #ETHEREUM.

ETHUSDT Long Trade SetupETHUSDT is showing bullish divergence at LLs, to make sure that divergence is effective we will take long entry at LH breakout, follow the below trade Plan
Trend: Bearish
Divergance: Bullish
Bias: Neutral
Scenario: Make Entry at LH breakout
Trade Plan
Stop Loss :4400
Entry Level: 4562
TP1: 4724


ETH/USDTI think wave B is in the form of a completed triangle for wave C, so I will open a short position with this setup.

Ethereum (ETH): Looking For That Break of Structure | Bullish AFETH is still waiting for that break of structure, and once it happens we are going to be looking for a push into new ATH levels. Monday came with a bloody move, but for now it looks nothing more than a shakeout before buyers step back in and take control.
Swallow Academy