DeGRAM | ETHUSD will retest the support level📊 Technical Analysis
● ETH/USD bounced from the 4,000 support zone after a false break, confirming strong demand and the validity of the long-term ascending channel.
● Price structure suggests potential upside with targets toward 4,950 resistance, supported by rejection wicks and consolidation above 3,920.
💡 Fundamental Analysis
● Ethereum’s momentum is fueled by rising institutional flows and expectations of ETH ETF approvals, strengthening medium-term bullish sentiment.
✨ Summary
ETH/USD holds above 4,000 with bullish recovery signals. Key support lies at 3,920, while upside targets remain 4,950. Momentum favors buyers in the medium term.
-------------------
Share your opinion in the comments and support the idea with a like. Thanks for your support!
ETHUSDT.P trade ideas

ETH Elliott Wave - WXY Correction Complete soon!This chart analyzes Ethereum (ETHUSD) at the conclusion phase of a major WXY corrective structure, highlighting the technical environment for a new impulsive wave sequence. Price action is assessed using multiple technical indicators:
Elliott Wave Structure: The chart maps a completed 1-2-3-4-5 impulse, followed by W–X–Y corrective waves. The final Y leg approaches the critical Point 4 support, maintaining overall cycle validity and setting the stage for significant trend reversal once completed.
Ichimoku Cloud: ETH price is currently testing the lower bounds of the Ichimoku cloud, reinforcing a major support zone. A close above the cloud would further validate trend reversal; a breakdown would signal extended bearish pressure.
Volume Profile: Recent sessions show a spike in trading volume as price approaches historical support levels, indicating potential capitulation and increased probability of trend exhaustion.
Fibonacci Retracement: Key supports are identified at the 38.2%, 50%, and 61.8% levels, with the 38.2% zone (around $3,600) as a strong candidate for final Y wave completion based on confluence with cloud and momentum indicators.
RSI and Stochastic RSI: Both relative strength oscillators are in oversold territory, consistent with the final stages of a corrective structure. A bullish crossover or RSI divergence would strengthen the reversal thesis.
CVO/OBV: Volume-based momentum indicators confirm heavy participation during the latter stages of the sell-off, validating the probability of a strong bounce once buyers re-enter.
Scenario Outlook:
The analysis anticipates that, upon completion of the WXY correction—ideally above the Point 4 support (roughly $3,350)—Ethereum is set for a new impulsive uptrend as part of the final bull market rally. The setup favors strategic accumulation in the defined support zones, with projected upside targets ranging from previous all-time highs (~$4,950) to extended Fibonacci projections should the market move through a classical 1-2-3-4-5 impulsive wave.

ETH 6K to 8K !? My analysis atm for ETH
Possible to bounce right back to ATH and price discovery mode to 6K hopefully 8K+
What ya all think, drop it bellow ?

Ethereum (ETH): Nothing Is Lost Yet | Double Bottom | Bullish!The game plan remains the same; we are looking for a smaller MSB and then a reclaim of $4,400 before a new ATH.
Yesterday we had another smaller sell-side dominance wave, but buyers took back control pretty quickly, which resulted in a long wick and established a solid support zone (just like Bitcoin did).
Swallow Academy

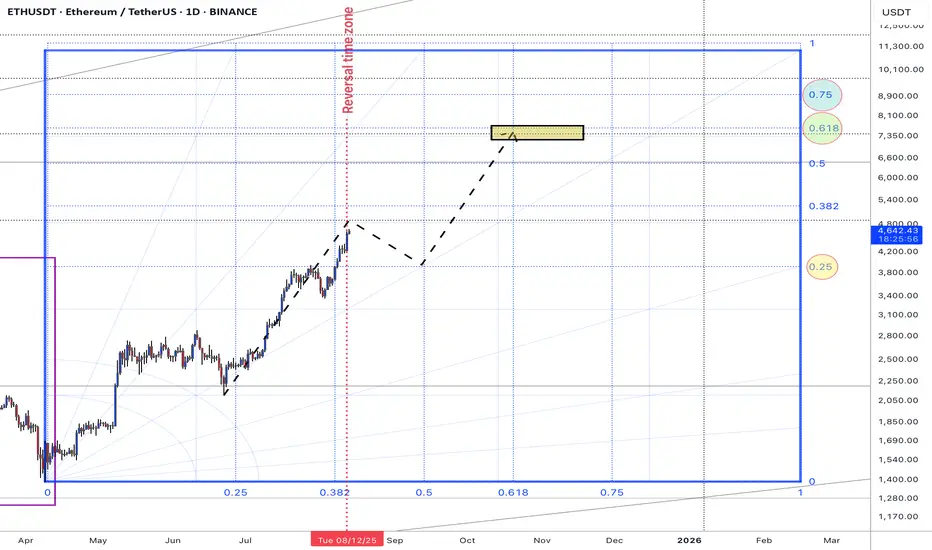
ETHUSDT #009 (Be careful, need 15-20% correction for next cycleHello dear traders.
Good days.
First of all thanks for your support and comments.
————————————————————————
On daily Gann Square ETHUSDT break out 0.5 Gann Square price zone and with good strength trend line support it expected to fill 0.618 Gann box price level at exact reversal time zone .
So be careful and do not be FOMO . expected to grow up to 4800$ and correct 15-20 % correction for retest 0.5 Gann price zone .
If support at 3940-3915 $ will grow up fro next bull cycle .
BTC Dominance is mached also at exact time with ETHUSDT .
Weekly overview of ETHUSDT Chart will updated.
Good luck and safe trades.
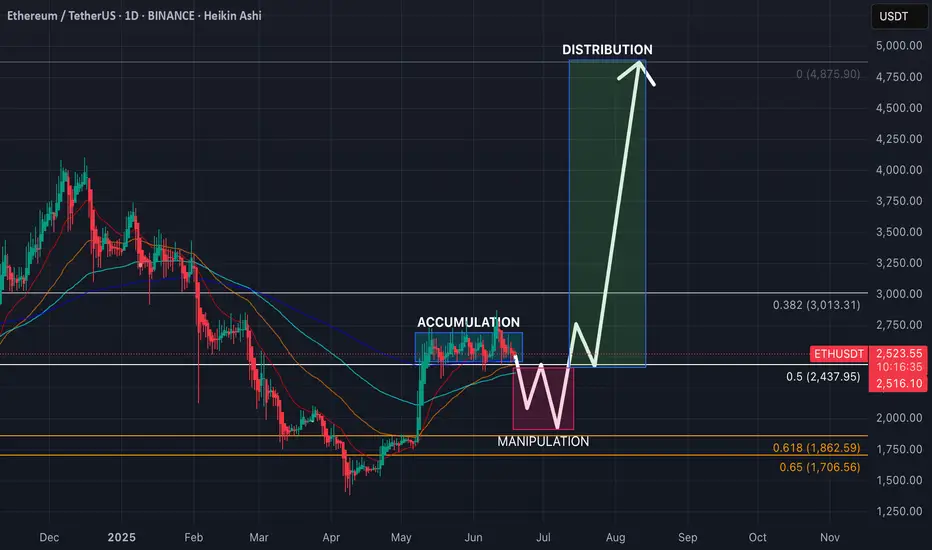
ETH: 6th consolidation week, AMD!?Ethereum is super slow these days, ranging tightly between $2430 and $2800 for weeks after a recovery. Current price action shows signs of preparation for the next BIG move, but in what side!?!!
Let’s break this down using the AMD model:
🔸 Accumulation
We saw ETH bottoming out in April after a deep correction. Since then, price reclaimed the 200 EMA and consolidated just above the 0.5 Fib level at $2437. This horizontal zone has been the accumulation range base.
🔸 Manipulation
Currently, ETH is testing the lower part of this range. Based on the chart structure, a possible liquidity squeeze breaking $2437 (mid-level) so we expect bearish trap for late sellers and non-believers before a viiolent reversal. This would be the classic “spring” move often seen in Wyckoff chart structures.
🔸 Distribution (later stage)**
If (or when) ETH breaks above $2800 and gets new attention with strong volume, this can lead to a mind blown fuses expansion — targeting the psychological $3000 and after recovery to previous ATH zone. Previous ATH at $4875 is the main target. Reasonably, this would be the final stage of distribution before a probable pump and altseason madness starts. But we are far for that right now, expect it not earlier than mid-autumn.
🧠 Key Technicals:
Okay, my Heikin Ashi candles show weakening — which means that we are close to the start of the Manipulation phase.
RSI pulling back, resetting momentum for the next move.
Fibonacci zones:
0.5 = $2437
0.618 = $1862
0.65 = $1706
🔮 Trade Idea (not financial advice):
A fake move below $2437 followed by fast and immediate recovery would be an ideal long entry.
Cancel trade if daily close below $1860, we can get lower this time.
TP? Well, depends on your belief. If btc made almost 2x from previous high, $3000 / $3500 / $4000 / $4500 / $5000 could be good? ETH could see even 8-8.5k this cycle, but its super positive outlook on current market structure.
📊 Summary:
ETH is showing classic AMD structure:
Accumulation (in progress for 6 weeks, 6 fn weeks!) ⏳
Manipulation (going down) 📉
Distribution (recovery + growth) 🚀
Some while ago, ETH was already playing simillar games, so why it should be different this time?
Breakout will come only after weak hands are shaken out, only after retail traders will sh*t their pants we will see growth.
Hopefully we will see immediate growth from current levels, but I'm more realist this time.
Ciao!
Will we see Ethereum rise at the end of this week?I think Ethereum, with a bad start this week, needs a strong price correction to climb back up to $5,000 and exit this multi-day range. If the $4,000 channel is lost, the price will drop to $3,370 and will start its climb from the bottom of the channel next week. Of course, this week, you can open small buy or sell trades, depending on the market risk, according to capital management.

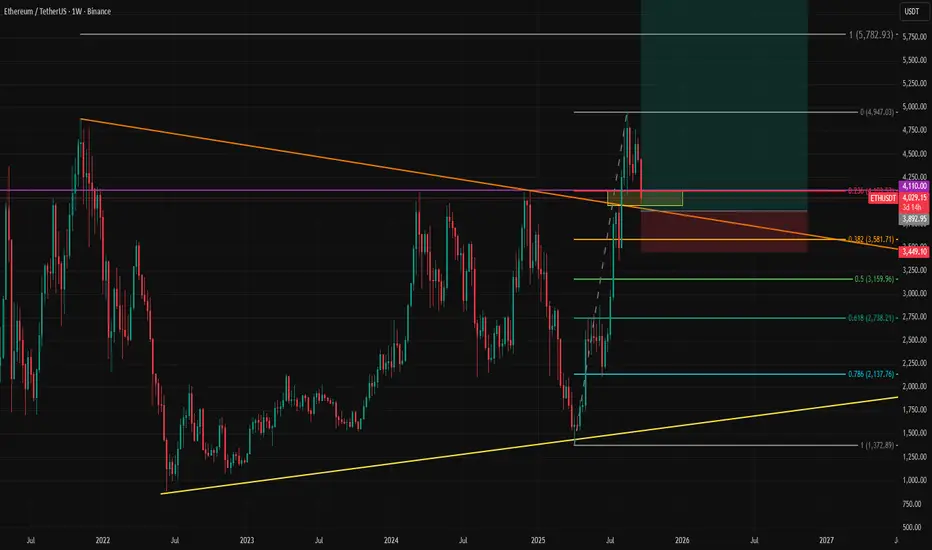
ETHUSD Retests Broken Trend on Weekly TimeframeEthereum is retesting the broken trendline and is likely setting up for another leg higher. Unless there is persistent pricing below $4,000, this selloff is likely to become a buying opportunity for those who missed the earlier rally.
Our year-end (or end of the first quarter of 2026) target above $7,000 still stands. The main risk is a potential selloff in the US stock market, which could drag crypto lower if the correlation remains intact.
ETH Check-In📊 Current Setup
ETH just slipped outta the box and is cruisin’ down toward that $3750 zone 🩸. That spot’s stacked with weight — if it holds, we might see the tide flip from bull vibes to bear mode 🐻.
🚦 Scenarios
👉 If $3750 catches and sticks, could be a minor pivot point worth watchin’.
👉 If it cracks clean, ETH might surf lower before bulls even think about comin’ back.
🧭 My Take
Right now? No clean setup. Best play is to sit tight, let the dust settle, and wait for the next wave 🌊. Patience prints 💯.
❓ What’s Your Read?
Does $3750 hold the line, or are we about to see ETH dive deeper? Drop your vibe below 👇

Ethereum (ETH): EMAs Have Been Broken | RSI Oversold | Bullish!ETH has broken the lines of EMAs, which have been long-time trend holders, yet this has to be done one way or another to sweep the liquidity from the markets.
Now that is past us,. We are seeing some signs of recovery, where candles are forming some kind of market structure break and taking into consideration that RSI is oversold, EMAs had a sharp breakdown without any retest, and the fact that we are in a bull market overall is a strong sign of potential recovery to happen so that's what we are looking for—the game plan remains the same!
Swallow Academy

Ethereum. Watching the 3,880–4,060 Zone: Setup for a New ATH?Hi traders and investors!
This analysis is based on the Initiative Analysis concept (IA).
The price has entered the 3,880–4,060 range — the scenario I was waiting for in the related post.
The September 25 seller candle is an IC candle and shows the highest volume since August 22.
And with September — typically a weak month for asset growth — coming to an end, we watch closely.
On the daily timeframe, the price is in a sideways range. The black lines mark the boundaries of this range. We’re waiting for the price to return back inside, absorb the seller’s candle that broke the lower boundary, and then it will be possible to look for buy setups targeting a new local ATH.
Wishing you profitable trades!

Ethereum (ETH): Bloody Hell, What a Sharp Start of MondayEthereum is showing similarities to the earlier push where we saw a shakeout (marked in the previous circled zone) before continuation to the upside. Currently, we’re seeing another break of structure, but as long as price holds above EMAs, the setup remains bullish. This could very well be another trap before the next leg up. First target stays $6,000, with the second target at $7,000 if buyers maintain control and secure higher levels.
Swallow Academy
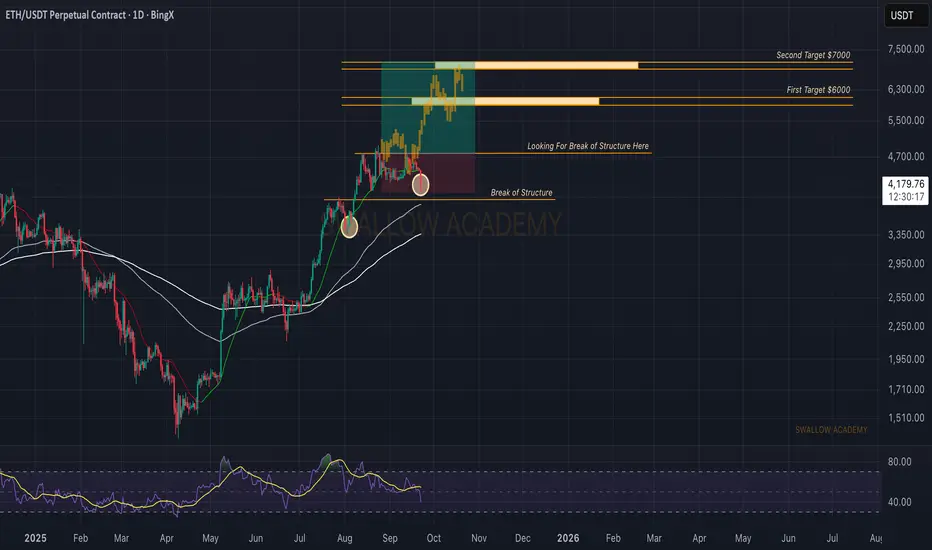
Ethereum (ETH): Failed To Breakout | Waiting For MomentumEthereum is still pressing right against the breakout zone, but buyers haven’t secured it yet. We’re seeing rejection wicks near resistance, showing clear hesitation in the market. As long as the price holds above the lower channel and EMAs, the structure remains bullish. A confirmed breakout here could open the path toward $7,000 first, with $9,000 as the major target.
Swallow Academy

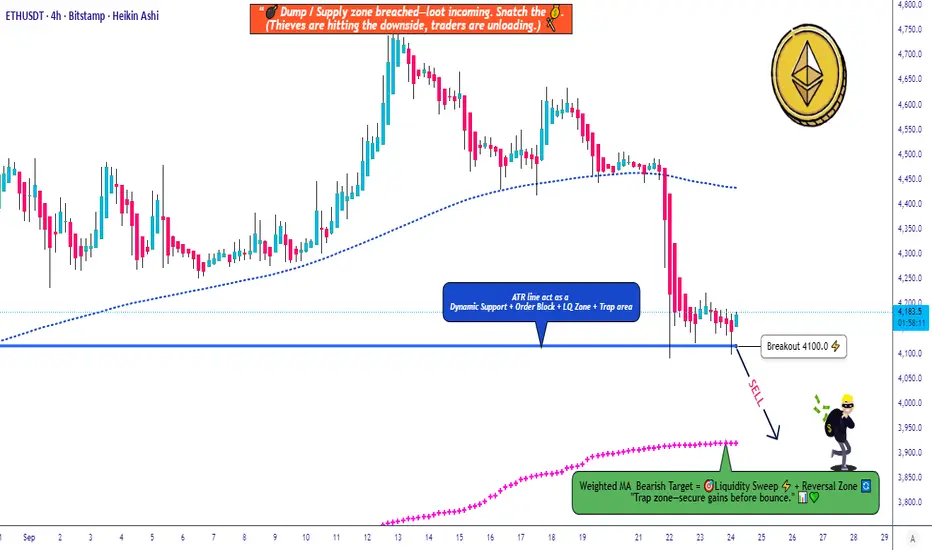
ETH/USDT Drop Plan Layered Entries + Smart EscapeETH/USDT 🚀 Market Wealth Strategy Map (Swing/Day Trade)
Market Outlook:
🔻 Bearish Confirmation: Watch for candle breakouts below the ATR Line @ 4100. This signals sellers gaining control — perfect for short entries.
Entry Plan (Thief Style 🕵️♂️):
💡 Multiple layered entries using limit orders (Thief layering strategy):
Sell layers: 4250 | 4200 | 4150 (adjust layers as per your own preference)
⚠️ Important: Set layer limit orders only after breakout confirmation. Do not enter blindly.
Stop Loss (SL):
⛔ Thief SL: 4300
Note: Dear Ladies & Gentlemen (Thief OG’s), SL is your choice — manage your risk and profits at your own discretion.
Target (TP):
🎯 Target: Weighted Moving Average Line (~3900) — strong support, oversold signals, and trap potential. Escape with profits before market catches you.
Note: TP is also your choice, manage money at your own discretion.
Related Pairs to Watch 🔗:
BINANCE:BTCUSDT : Correlated short setups, watch BTC for confirmation.
BINANCE:ETHBTC : Relative weakness/strength check vs Bitcoin.
BINANCE:BNBUSDT : Can provide additional trend confirmation in altcoin moves.
Key Points / Correlations:
ETH closely follows BTC sentiment; if BTC tanks, ETH likely follows.
Layering strategy allows flexible entries, reducing risk exposure.
Oversold + WMA support often signals profit escape zones for smart exits.
✨ “If you find value in my analysis, a 👍 and 🚀 boost is much appreciated — it helps me share more setups with the community!”
Disclaimer: This is Thief style trading strategy, just for fun.
#ETHUSDT #Ethereum #CryptoTrading #SwingTrade #DayTrade #ThiefStrategy #CryptoAnalysis #CryptoLayering #TradingViewIdeas #CryptoSetup
ETH Pullback before ATH and AltseasonOver the past few months, ETH has been a beast. Now it needs to cool off before it can push to higher highs, igniting the broader altcoin market and the long-awaited "altseason."
Coinciding with an oversold RSI, I anticipate that we will see a "sell the news" event for next week's FOMC announcement on 9/17. This aligns with historic seasonality of September being a bearish month.
My forecast is that we pull back to the $3,900-$3,500 zone (.618 fib and 21 week EMA confluence) before pushing to higher highs.
IF ETH holds above $5k with volume, this will allow the broader altcoin market to pump, attracting massive liquidity to close out Q4 in euphoria.
Happy trading,
Melonfarmer

ETH - First Key TestHere is a link to our last post:
We were seeing some market structure be build with three different bottoms come in around the $4,060 level.
However, last night those lows were breached which lead us to our first test of the macro support range.
This area ranges from about $3,700 to $3,950. It is very important as it was a level of resistance for many years and we would like to see the market establish this area as a new level of support. If this is established the trend will be intact to push toward highs.
We just saw the first test and bounce from the top of the box at $3,950. Will be key to monitor how the market reacts to this price action and will be looking for any further bottom developments in this macro support range.

This Volatility Period:Around September 24th(September 23rd-25)
Hello, traders!
Follow us to get the latest information quickly.
Have a great day!
-------------------------------------
(ETHUSDT 1D Chart)
This Volatility Period: Around September 24th (September 23rd-25th)
Before this volatility period began, the price fell below 4403.87 and then fell to the 3900.73-4107.80 range.
The 4403.87-1749.30 range, which corresponds to the HA-High ~ DOM (60) range, is likely to act as resistance, as it represents a high point.
The 3900.73-4107.80 range represents the previous all-time high (ATH). If the price remains above this range, the uptrend is likely to continue.
Therefore, the key question is whether the price can find support in the 3900.73-4107.80 range and rise above the 4403.87-4749.30 range.
After this volatility period, we should examine whether the price can find support in the 3900.73-4107.80 range.
If not, support around 3265.0-3438.16 is crucial.
-
If the OBV indicator falls below the Low Line, the price is likely to decline again.
Therefore, support around 3900.73-4107.80 is crucial.
-
The basic trading strategy is to buy in the DOM(-60) ~ HA-Low range and sell in the HA-High ~ DOM(60) range.
Considering this basic trading strategy, it may be natural for the price to decline since it failed to rise above 4403.87-4749.30.
Since it fell in the HA-High ~ DOM(60) range, it is likely to decline until it meets the DOM(-60) or HA-Low indicator.
However, since important support and resistance points or zones have formed, the trend can reverse at any time depending on whether support is found at those points or zones.
In this sense, the K value of the StochRSI indicator is in the oversold zone, suggesting a potential uptrend in the near future.
While the K value of the StochRSI indicator is in the oversold zone, the possibility of further decline is high. However, the established support and resistance zones increase the likelihood of turning this crisis into an opportunity.
In this situation, what we can do is confirm the signs of an uptrend.
Otherwise, if we anticipate a new trade in advance, we may face another crisis as the volatility period progresses.
-
If you are currently trading, there is an opportunity to sell in the first installment when resistance is encountered in the 4403.87-4749.30 zone.
As mentioned earlier, this is based on the basic trading strategy.
Depending on whether support is found in the 3900.73-4107.72 range, you'll decide whether to sell in two installments or buy.
Since the stock market trades in single-share increments, selling before the price has more than doubled from the purchase price makes it difficult to buy again.
However, the coin market allows for decimal trading, making trading easier than in the stock market.
This freedom of buying and selling is the biggest advantage of the coin market.
If your buy price is below 3900.73, buying when the 3900.73-4107.80 range shows signs of support will increase your average buy price, potentially putting you under psychological pressure.
However, as mentioned earlier, the coin market allows for decimal trading, making it possible to separate your buy price into separate trades.
Therefore, you can record the purchase price and purchase amount separately, differentiating them from the existing average purchase price, and then trade them separately.
If you understand this principle, you'll find the coin market much easier to trade than the stock market.
This is one of the reasons why even those who have successfully traded in the stock market often fail in their initial trading in the coin market.
-
Thank you for reading to the end.
I wish you successful trading.
--------------------------------------------------
- Here's an explanation of the big picture.
(3-year bull market, 1-year bear market pattern)
I'll explain more in detail when the bear market begins.
------------------------------------------------------

ETH to around $4000I see a diamond pattern in the works. If this plays out it would be a nice short. NFA.


ETH Charts ETH Charts
POI: it is at 3745, worst to comes to worst it will bounce from 3745. It looks like it has to retest 4100 - 4200 zone.
Everything is good, It has to stay above 3750!
Best Buy;
1. 3875
2. 3750

$ETH Bearish Short-Term (September 24, 2025)BINANCE:ETHUSDT
Summary of Price Action:
Recent Movement: In the last 24 hours, ETH has dropped by about 1.12%, reaching around $4,133 - $4,175 this morning (UTC). This follows a slight recovery from lows near $4,092 on September 22, but it's now retesting support at $4,100 amid strong institutional redemptions. In your 2H chart, we see a series of red candles (bearish) indicating selling pressure, with trading volume increasing during the decline, confirming seller interest.
Key Levels:
Support: $4,100 (immediate level, tested today) and $4,000 - $4,092 as a stronger lower zone. If $4,100 breaks, we could see a drop toward $3,900.
Resistance: $4,180 - $4,200 (strong level with recent rejections). A break above $4,200 would signal recovery toward $4,300.
Volume and Liquidity: 24-hour volume is around $34.8 billion, with large liquidations tied to $141 million in spot ETF outflows over the past day, mostly from institutional longs. This shows smaller traders suffering from bearish pressure.
MACD Indicator Analysis :In the chart you sent, the MACD line (blue) is crossing below the signal line (orange), with the histogram turning more negative (red bars growing). This indicates a bearish divergence – the price is weakening while momentum is losing strength. MACD is below the zero line, confirming a weak short-term trend. RSI (at similar levels) is around 40-50, signaling lightly oversold, but still without strong buy signals.
Overall Trend:
Bearish Short-Term, Bullish Long-TermShort-Term (Today/Next Day): Bearish.
The price is consolidating in a bearish channel, with predictions for further downside toward $4,000 - $4,092 today or tomorrow, due to fear sentiment and pressure from ETF outflows. This matches your chart, where we see a potential descending triangle pattern (but still uncertain). Avoid immediate buys – wait for confirmation below $4,100 for shorts or above $4,180 for longs.

Showing second chance wayching multi timeframe RSI'sShowing second chance wayching multi timeframe RSI's - More of swing ideas using Price Action Reader

ETH$ in uptrend ch ?!Ethereum is in an ascending channel, but it's undergoing a correction. The bottom of the channel, marked in orange, is an important point. Additionally, the green box indicates a key area that aligns with the weekly Fibonacci zone, as well as the 200 EMA. This is very significant and could lead to a price increase.
