Ethereum (ETH): Buyers Secured The EMAs | Mega BullishCRYPTOCAP:ETH showing strong signs as momentum starts kicking in right above the EMAs. Buyers have defended these zones multiple times, and now we’re finally seeing that push we’ve been waiting for.
As long as price holds above this area, the target at $5,555 stays active. This bounce near EMAs could be the key driver for continuation in the coming sessions.
Swallow Academy
ETHUSDT.P trade ideas

#ETHUSDT 4H ChartPrice is still moving upwards after liquidating the equal highs. MACD is starting to show some bullish weakness, RSI is bought and EMAs are turning bullish. Price is expected to keep pushing upwards aiming towards the 4h supply zone at around $4,800.

ETHUSDT Aiming Recent HighsHi there,
ETHUSDT has the potential to increase from the support zone of 4285.01 and reach between 4417 and 4459, with a bias toward 4560. It will take time, and monitoring will be required.
Happy trading,
K.
Not trading advice

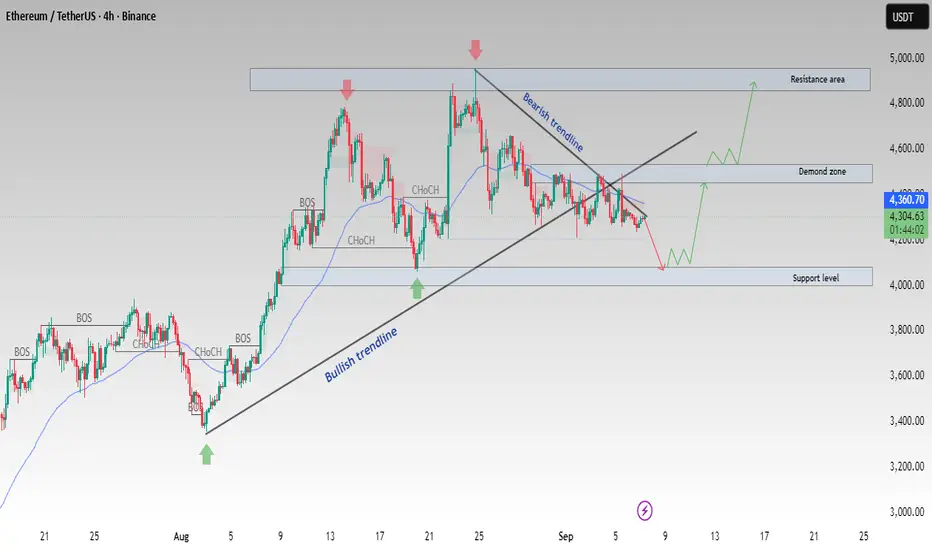
ETH/USDT at Key Demand Zone–Bullish Reversal or Deeper Pullback?Ethereum (ETH/USDT) on the 4H timeframe is trading near a critical demand zone after pulling back from resistance.
Key technical notes:
Bullish trendline supported recent upward moves
Bearish trendline currently limiting upside momentum
Price is consolidating between demand zone (4,200 – 4,300) and resistance (4,600 – 4,800)
If demand holds, ETH could rally back toward 4,600 – 4,800 resistance
A breakdown below demand may lead to a retest of the 4,000 support level
📌 The structure suggests a potential bullish reversal, but confirmation is required with a break of the bearish trendline and demand reaction.
This analysis is for educational purposes only. Always use proper risk management and do your own research before trading.

Peter Schiff bearish posting about Ethereum at S/R levelInteresting to see FUD at S/R levels
Short support & sell the bottom
Trade your charts not others opinions

ETH Charts ETH Charts
POI: it is at 3745, worst to comes to worst it will bounce from 3745. It looks like it has to retest 4100 - 4200 zone.
Everything is good, It has to stay above 3750!
Best Buy;
1. 3875
2. 3750

Ethereum ShortAs U.S. Treasury yields and the U.S. dollar continue to strengthen, The crypto market continues its selloff. I have outlined some key areas where bulls will start to nibble on longs. Shorts are still open for at least another 2% down.

$ETH Bearish Short-Term (September 24, 2025)BINANCE:ETHUSDT
Summary of Price Action:
Recent Movement: In the last 24 hours, ETH has dropped by about 1.12%, reaching around $4,133 - $4,175 this morning (UTC). This follows a slight recovery from lows near $4,092 on September 22, but it's now retesting support at $4,100 amid strong institutional redemptions. In your 2H chart, we see a series of red candles (bearish) indicating selling pressure, with trading volume increasing during the decline, confirming seller interest.
Key Levels:
Support: $4,100 (immediate level, tested today) and $4,000 - $4,092 as a stronger lower zone. If $4,100 breaks, we could see a drop toward $3,900.
Resistance: $4,180 - $4,200 (strong level with recent rejections). A break above $4,200 would signal recovery toward $4,300.
Volume and Liquidity: 24-hour volume is around $34.8 billion, with large liquidations tied to $141 million in spot ETF outflows over the past day, mostly from institutional longs. This shows smaller traders suffering from bearish pressure.
MACD Indicator Analysis :In the chart you sent, the MACD line (blue) is crossing below the signal line (orange), with the histogram turning more negative (red bars growing). This indicates a bearish divergence – the price is weakening while momentum is losing strength. MACD is below the zero line, confirming a weak short-term trend. RSI (at similar levels) is around 40-50, signaling lightly oversold, but still without strong buy signals.
Overall Trend:
Bearish Short-Term, Bullish Long-TermShort-Term (Today/Next Day): Bearish.
The price is consolidating in a bearish channel, with predictions for further downside toward $4,000 - $4,092 today or tomorrow, due to fear sentiment and pressure from ETF outflows. This matches your chart, where we see a potential descending triangle pattern (but still uncertain). Avoid immediate buys – wait for confirmation below $4,100 for shorts or above $4,180 for longs.

ETH Crash or Bounce? The Critical Level Everyone Is WatchingEthereum (ETH/USDT) – Critical Support Test Ahead
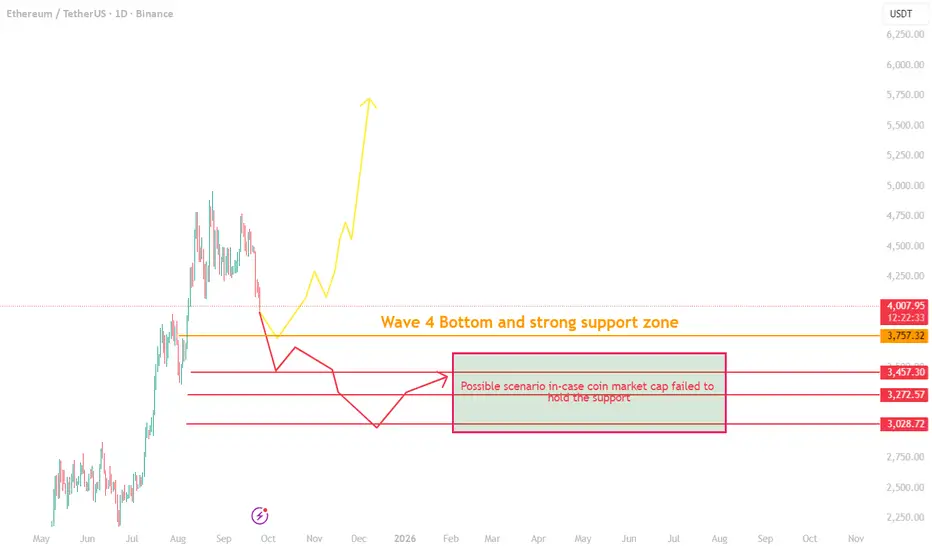
Ethereum is currently under pressure after breaking below the $4,000 support. The next significant level to watch is the $3,760 zone, which is not only a strong technical support but also aligns with the Elliott Wave 4 bottom as well as a key Fibonacci retracement area.
Key Scenarios
1. Bullish Recovery (Primary Expectation)
If ETH holds above the $3,760 support, we can expect consolidation in the range of $4,000 – $4,350.
This zone is likely to act as a base for Ethereum until broader market conditions stabilize.
Once momentum returns, ETH has the potential to resume its upward trend.
2. Bearish Breakdown
If ETH fails to defend $3,760, then deeper downside levels may come into play:
$3,450
$3,270
$3,000
This would represent a sharp and aggressive downturn. While possible, this remains weak scenario, given how violent the move would be.
Why the Answer Lies Outside ETH’s Chart
The real driver here isn’t just Ethereum—it’s the total "crypto market cap excluding BTC" as I have warned 2 days ago that's it's falling into a correction
The altcoin market cap is currently in correction as capital flows back into Bitcoin dominance, which has already broken its downtrend line and reached today 59%.
If the altcoin market cap holds its critical support and BTC dominance starts dropping, we can expect a broader bullish recovery across altcoins, with Ethereum following.
If that support breaks, then the weaker bearish scenario may unfold.
Conclusion
For now, the $3,760 support remains the critical line in the sand. Holding it keeps Ethereum within a bullish recovery path. Breaking it could open the door to deeper corrections.
Critical Moment for ETH – Support or Breakdown?Ethereum is sitting on the key $4,000 level with strong downward momentum. The big question: will this support hold or break? I’ve been saying for a while that $3,500 is still on the table.

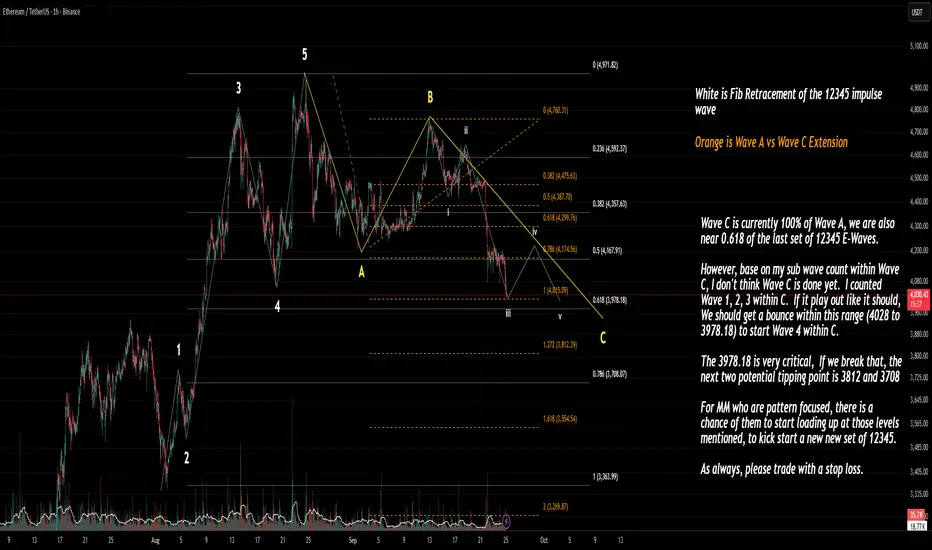
Elliott Wave Ethereum / Fibonacci LevelWave C Progress:
Wave C has already reached 100% of Wave A.
Price is sitting near the 0.618 retracement of the previous 12345 impulse wave.
Subwave Count Inside Wave C:
I have counted Waves 1, 2, 3 inside C.
If this sub-count is correct, a Wave 4 bounce is expected soon in the 4028 – 3978 zone.
Critical Levels
4028 – 3978.18: Expected bounce range (Wave 4 inside C).
3978.18: Key level — breaking it opens the door to deeper downside.
If broken, the next supports are:
3812 (1.272 extension)
3708 (0.786 retracement of entire impulse)
Implications
If 3978 holds, ETH may stage a corrective bounce (Wave 4) before a possible Wave 5 inside C.
If 3978 fails, 3812 and 3708 are the next tipping points where market makers/pattern traders might start accumulating for a new 12345 impulse set.
Watch for a bounce between 4028–3978.
Lose 3978, and 3812/3708 become the big decision zones for the next move.
ETHUSDT 1D chart Review1. Trendline (orange) - was clearly pierced down → it is a signal of weakening the growth moment.
2. Horizers of support / resistance:
• Resistance: $ 4,604 (strong), above $ 4,960.
• Support: $ 4 150 (currently tested), next $ 3,958 and $ 3,696.
3. Price - currently ~ 4 169 $, i.e. right with the support of $ 4 150.
4. Candles - a strong inheritance candle after piercing the trend → weakness signal.
5. STOCHASTIC RSI - in the sales zone (<20), which may suggest the possibility of short -term reflection.
⸻
🔹 Application:
• Short date: possible reflection from $ 4 150 thanks to the sale (technical bounce).
• average date: If level $ 4 150 breaks and the candle closes below → the road opens to $ 3,958 and even $ 3,696.
• Only a return above $ 4 272 and a retest trendline from below would give a signal of buyers.
⸻
👉 To sum up: The market is in the critical zone - support $ 4 150 decides.
• Bull: keeping the defense of this level + reflection from the sale.
• Bear: loss $ 4 150 = greater correction in the direction of $ 3 950–3 700.

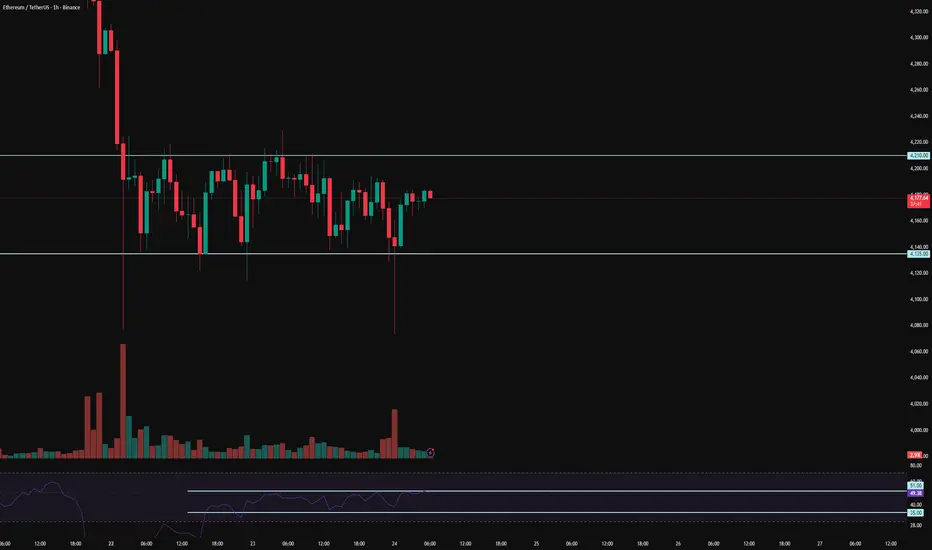
ETH 1H Analysis - Key Triggers Ahead | Day 26❄️ Welcome to the cryptos winter , I hope you’ve started your day well.
⏰ We’re analyzing ETH on the 1-Hour timeframe.
👀 On the 1-hour timeframe, Ethereum is currently ranging after its recent drop, sitting in a decision-making zone. It already faked the range low once and bounced back up, creating a clean trading structure. If ETH breaks above the $4,210 resistance, it could complete its correction and push higher. On the other hand, if ETH continues its deeper correction, a break and confirmation below the $4,135 support would open the way to lower levels.
🧮 Looking at the RSI oscillator, it’s now hovering around the 50 zone. A cross above 51 could trigger a bullish breakout, while a cross below 35 would suggest Ethereum is heading for a deeper correction.
🕯 Candle size and volume have shrunk inside this range, showing clear consolidation. Buyers and sellers are in a tug-of-war, and we’d prefer not to trade in these tight squeezes with heavy volume until a clear winner emerges. A breakout of the range will likely need strong “whale candles” to confirm direction.
💸 The ETH/BTC pair also shows a similar structure — after its recent drop, it has entered a tight consolidation pattern that mirrors the price action seen against USDT.
🧠 For trading ETH, patience is key. Wait to see which side Ethereum chooses to break out from. Once the range high or low (outlined above) is taken out with confirmation, we can look for a position in that direction.
❤️ Disclaimer : This analysis is purely based on my personal opinion and I only trade if the stated triggers are activated .
Eth max pain on this Friday is 3600This Friday :
Btc option max pain 110k
Eth option max pain 3600
We are noticed that 3966 is the 0.382 fibo support for the past 3 weeks uptrend wave. But,
Please don't long at 3966 in this week.
This week trading strategy should be short at 4400. Eth need to test STR (support turn resistance) area before drop. and short it all the way to 3600.
If u like mine trading idea. Please hit me a like, rocket and leave a comment for me.

ETH/USDTCurrently trading in a local consolidation, moving within its range expansion.
After a deviation below the range low, long setups can be considered — but only if confirmation conditions are met.
Potential short opportunities may appear in the 4400–4500 zone, again only with proper confirmations.

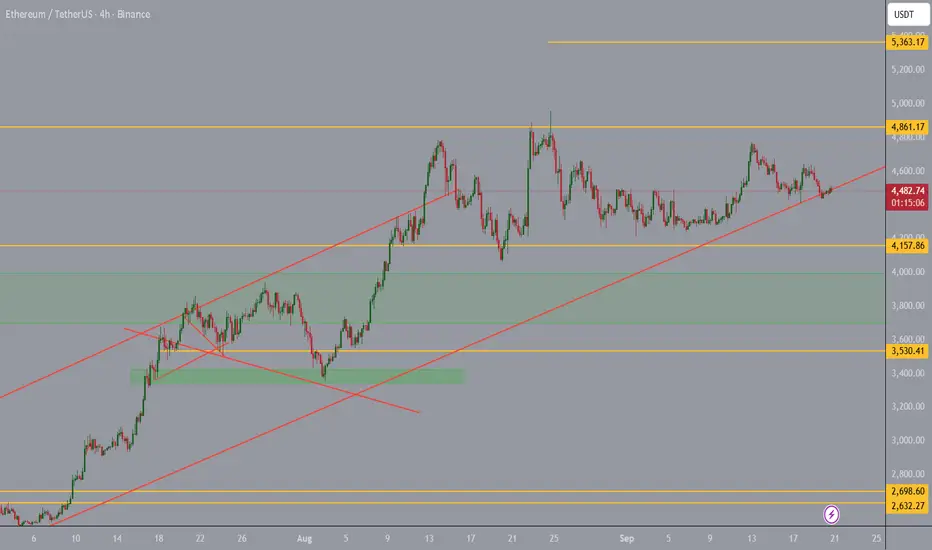
ETH/USD: Correction Continues, Key Support at 4062.50ETH/USD trades within a long-term bullish trend, but after the Fed’s recent rate cut the pair moved into a correction. Price is testing the lower boundary of the short-term range 4687.50–4062.50 (Murray – , Fibo 23.6%).
• A breakout below 4062.50 could extend the decline toward 3540.00 (Fibo 38.2%) and 3125.00 (Murray , Fibo 50.0%).
• A breakout above 4687.50 would confirm bullish continuation to 5000.00, 5312.50, and 5625.00.
⸻
🔎 Indicators
• Bollinger Bands: flat, range-bound trading.
• MACD: preparing to cross into negative.
• Stochastic: oversold, possible upward reversal.
• Weekly trend remains bullish, but correction toward 3540.00 is possible.
⸻
🏷️ Key Levels
• Resistance: 4687.50, 5000.00, 5312.50, 5625.00
• Support: 4062.50, 3540.00, 3125.00
⸻
📈 Trading Plan
Scenario 1 – SELL STOP
• Entry: 4062.45
• TP: 3540.00, 3125.00
• SL: 4500.00
• Timeframe: 1W
Scenario 2 – BUY STOP
• Entry: 4687.55
• TP: 5000.00, 5312.50, 5625.00
• SL: 4490.00

AI Trading Future in Global TradeChapter 1: Evolution of Trading in the Global Economy
To understand the role of AI in global trade, it’s important to trace the evolution of trading systems:
Manual Trade Era (Pre-20th Century):
Trade was conducted through physical exchanges, manual record-keeping, and human negotiation. Market knowledge was limited, and trading was highly localized.
Industrial Trade Era (19th–20th Century):
The rise of banks, stock exchanges, and global shipping allowed trade to scale. Telegraphs and later telephones enabled faster communication, but human decision-making still dominated.
Digital Trade Era (Late 20th Century):
Computers, internet, and digital platforms enabled electronic trading. Global trade volumes multiplied, and finance became increasingly algorithm-driven.
AI-Driven Trade Era (21st Century Onwards):
AI introduced self-learning systems capable of analyzing global data, predicting risks, and automating trades at lightning speed. AI isn’t just helping human traders—it is becoming a trader in its own right.
Chapter 2: AI in Global Trade – Key Dimensions
AI’s role in global trade is multi-dimensional. Let’s break it down into areas where it is most impactful:
2.1 AI in Financial Trading
Algorithmic Trading: AI algorithms execute stock, currency, and commodity trades within milliseconds, capturing opportunities humans would miss.
Risk Management: AI models analyze geopolitical risks, currency fluctuations, and commodity price swings to protect investments.
Prediction Models: Machine learning tools predict demand and price trends based on historical patterns, news, and even social media sentiment.
2.2 AI in Supply Chain & Logistics
Predicting demand and inventory needs across borders.
Optimizing shipping routes using AI-powered logistics systems.
Detecting disruptions such as port delays, natural disasters, or conflicts.
Automating customs and compliance checks with AI-driven platforms.
2.3 AI in Trade Finance
Credit Assessment: AI evaluates the financial health of buyers/sellers faster than banks traditionally do.
Fraud Detection: Machine learning spots suspicious trade transactions to reduce global trade fraud.
Smart Contracts: Blockchain combined with AI automates payments once shipment conditions are met.
2.4 AI in Policy and Regulation
Governments and international organizations are adopting AI to:
Monitor illegal trade and smuggling.
Predict economic impact of tariffs and sanctions.
Strengthen cybersecurity in financial systems.
Chapter 3: Opportunities Created by AI Trading in Global Trade
The fusion of AI and trade opens up massive opportunities:
Efficiency Gains
Faster decision-making in trading.
Reduced human error and biases.
Optimized global logistics saving billions in costs.
Wider Market Access
Small businesses in developing nations can use AI platforms to connect with global buyers.
AI-powered marketplaces lower barriers to entry.
Risk Reduction
AI predicts financial and political risks, reducing trade shocks.
Helps governments stabilize currency and commodity markets.
Personalization in Trade
AI allows companies to customize global offerings based on regional consumer preferences.
Green & Sustainable Trade
AI helps optimize energy-efficient shipping and sustainable sourcing.
Chapter 4: Risks and Challenges
No revolution comes without challenges. AI in global trade has its share of risks:
4.1 Economic Risks
Market Manipulation: Powerful AI trading systems could manipulate markets for unfair advantage.
Job Displacement: Traditional roles in trade, logistics, and banking may be automated.
4.2 Ethical Risks
Bias in AI Models: Trade finance models may disadvantage certain countries or small players.
Transparency Issues: Black-box AI models make it hard to explain why certain trade decisions were made.
4.3 Geopolitical Risks
AI Arms Race: Nations may compete in developing the most powerful AI for trade dominance.
Cybersecurity: AI-driven trade platforms may become targets for hackers.
4.4 Regulatory Challenges
Lack of global standards for AI in trade.
Difficulty in monitoring cross-border AI trading platforms.
Chapter 5: Case Studies of AI in Global Trade
Alibaba’s AI-Powered Logistics (China):
Alibaba uses AI to predict demand and optimize shipping routes for global e-commerce.
IBM Watson in Trade Finance:
IBM Watson is helping banks automate trade finance document verification, reducing fraud.
AI in Shipping (Maersk):
Maersk deploys AI to optimize container routes and predict shipping delays.
Stock Market AI (Wall Street & NSE):
High-frequency trading firms deploy AI to trade currencies, equities, and commodities at scale.
Chapter 6: The Regulatory Landscape
The future of AI in global trade also depends heavily on how it is regulated.
World Trade Organization (WTO): exploring frameworks for AI-driven trade.
National Governments: building AI ethics laws and data protection rules.
Global Cooperation: need for cross-border agreements to regulate AI-driven trading.
Chapter 7: The Future of AI Trading in Global Trade
Looking ahead, AI trading will evolve along these lines:
Hyper-Automation of Global Markets
AI will handle most cross-border transactions with minimal human intervention.
Decentralized AI Trading Platforms
Blockchain + AI will power decentralized global trade, reducing dependence on intermediaries.
Digital Currencies & CBDCs
Central Bank Digital Currencies (CBDCs) combined with AI will redefine cross-border payments.
AI as a Trade Negotiator
Future AI systems may simulate global economic outcomes to guide tariff and trade negotiations.
Sustainable Global Trade
AI will optimize carbon-neutral logistics and eco-friendly sourcing.
Inclusive Trade
AI will help SMEs from developing nations gain global visibility, narrowing inequality gaps.
Chapter 8: Balancing Innovation and Responsibility
The key challenge lies in balancing AI-driven innovation with responsibility. Stakeholders must:
Build transparent AI systems.
Create fair trade algorithms.
Ensure inclusivity in access.
Develop strong cyber-defense systems.
Foster international cooperation.
Conclusion
AI trading is not just a technological shift—it is an economic revolution that will reshape the foundations of global trade. From stock exchanges in New York to shipping ports in Singapore, from small e-commerce sellers in Africa to regulators in Geneva, every actor in global trade will feel the impact.
The future is promising: faster, more efficient, and more inclusive trade powered by AI. But it also demands vigilance, regulation, and global collaboration to prevent misuse. If harnessed wisely, AI could become the great equalizer in global trade, bridging gaps, reducing risks, and creating a sustainable, interconnected world economy.

ETH Short Trade Trend: Bearish
Divergence: None
Continuation Pattern: Bearish Flag
Harmonics : AB=CD
Bias: Bearish
Scenario: Sell Stop entry at B point Breakout
*Trade Plan*
Stop Loss: 4220
Entry Level: 4040
TP1: 3860

Etherium ETH usdt daily analysis
Time frame 4hours
Risk rewards ratio >4.3 👈👌
Target 5.748$
I think this target is final target for this bullrun .
The 5th wave.

ETH/USDT SHORTBSL taken now its time for SSL to be taken, targeting POC of volume profile, could turn into a swing short if market continues drop this coming week.

Weekly Insights EUR USD AUD NZD BTC ETH (22nd-25th septemer2025)Get ready for the week ahead — in this video we break down the technical outlook and key levels for major currencies and markets including EUR/USD, AUD, NZD, as well as S&P 500 and Bitcoin (BTC). We analyze recent price action, highlight important support & resistance zones, and discuss possible scenarios you’ll want to watch from September 22–26, 2025. Whether you trade forex, crypto, or equities, these insights will help you stay informed and better positioned for whatever the markets throw next.
If you want, I can give you a more detailed summary (key levels, possible trades, etc.) of the video.