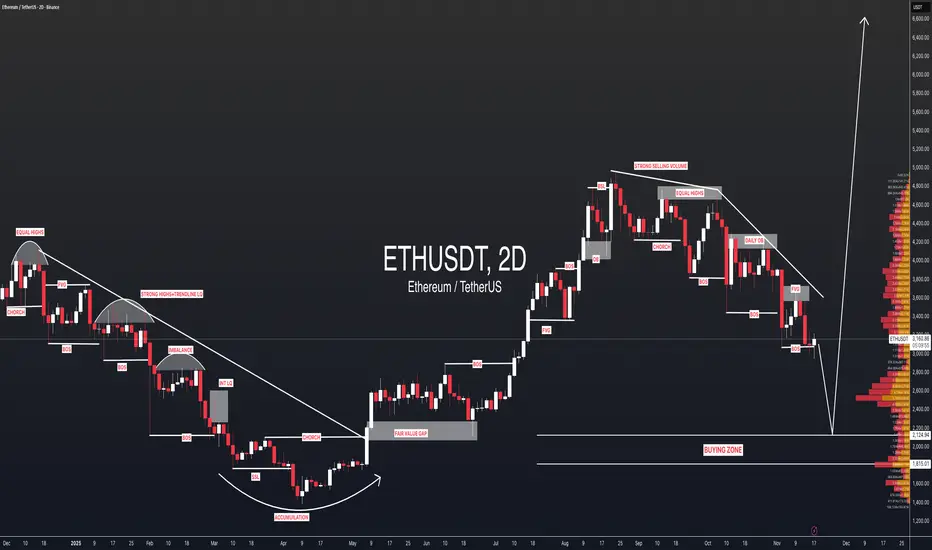
ETHUSDT: First Drop To $2100 And Bounce Up To $6500ETHUSDT is dropping nicely and we expect a smooth reversal around $2200. This area looks promising due to the significant volume sitting there. We just need to avoid liquidation. Once the entry is active, you can enter with strict risk management and set multiple take profit levels. This analysis is suitable for all traders from intraday to swing.
Good luck and feel free to like and comment for more!
Team Setupsfx_
Trade ideas
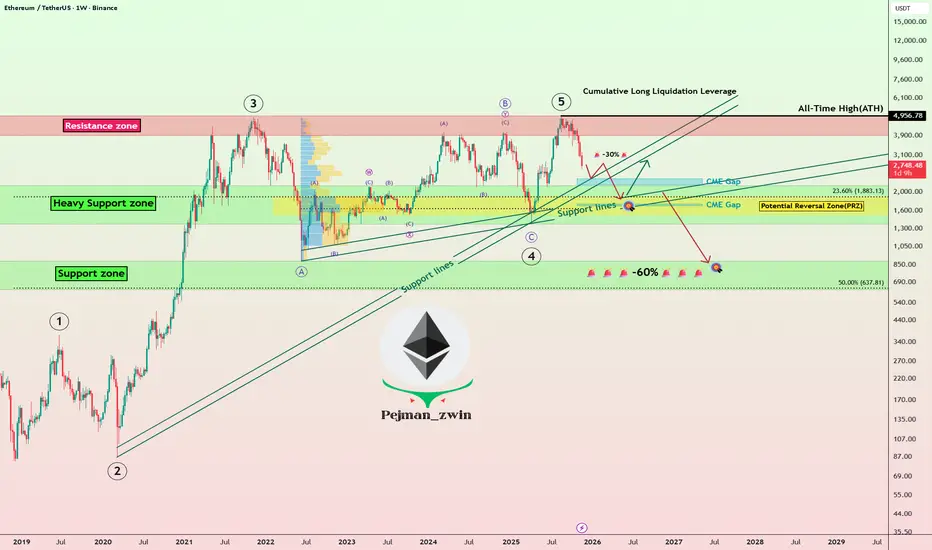
Ethereum Roadmap: Will ETH Bounce or Begin a Deeper Correction!?Today, I’d like to dive into an analysis of Ethereum ( BINANCE:ETHUSDT ). Given that over 80% of tokens in the crypto market are built on the Ethereum blockchain, Ethereum’s performance can serve as a roadmap for other tokens on the network.
So, stay tuned!
In recent times, Ethereum hasn’t been able to keep pace with Bitcoin’s growth and struggled to set a new All-Time High(ATH=$4,956). After Bitcoin’s decline, Ethereum also started to drop and is currently moving near the Heavy Support zone($2,160-$1,370), Support lines, Cumulative Long Liquidation Leverage($1,745-$1,629), and Potential Reversal Zone(PRZ) .
From an Elliott Wave perspective, it seems that Ethereum has completed its main five-wave impulsive. This suggests that we might now be entering a corrective phase. The extent of this correction will depend on multiple factors, and technical analysis alone won’t predict the exact magnitude of Ethereum’s decline in the coming days or weeks. Nonetheless, I’ll keep you updated step-by-step.
Looking at the USDT.D%( CRYPTOCAP:USDT.D ), it’s currently on an upward trend. This rising dominance can lead to further declines in Ethereum, reinforcing the bearish outlook.
Another important index is the US 10-Year Government Bond Yield ( TVC:US10 ). If the US 10-Year Government Bond Yield continues its upward movement, it can put additional pressure on risk assets like Bitcoin( BINANCE:BTCUSDT ) and Ethereum, leading to further declines.
Now, the question is: where might we see Ethereum resume its upward trajectory?
It’s likely that Ethereum will continue its downward movement(-30%), potentially filling the CME Gap($2,344-$2,186), CME Gap($1,745-$1,629) near the $2,000(Round Number). Once it stabilizes around that zone, we could look for signs of a recovery.
However, if Ethereum breaks below its Heavy Support zone($2,160-$1,370), we might face even more significant declines, potentially exceeding -60%.
Where do you think Ethereum will start to rise again? Or are more red days ahead?
💡 Please respect each other's opinions and express agreement or disagreement politely.
📌Ethereum Analyze (ETHUSDT), Weekly time frame.
🛑 Always set a Stop Loss(SL) for every position you open.
✅ This is just my idea; I’d love to see your thoughts too!
🔥 If you find it helpful, please BOOST this post and share it with your friends.
ETHEREUM | THE MATH IS COMPLETE | SHORT SQUEEZE LOADING?Traders,
ETH is setting up for a potential big short squeeze that can rip price up hard. Let me walk you through the math, the order flow and the volume profile that are all pointing in the same direction.
1. The Fib math: 0.5 retrace into 2.0 extension
At point A ETH printed the last impulsive wave up before the dump. After point B the market sold off and then retraced exactly to the 0.5 retracement at point C.
Why 0.5 rotates into 2.0 from a math perspective :
A 0.5 retracement means price has pulled back 50 percent of the prior leg.
-> If AB is 1000 points, a 0.5 retrace gives a 500 point pullback.
In my Fibonacci Rotation table, 0.5 is paired with 2.0 because they are exact reciprocals.
-> 1 divided by 0.5 equals 2.
So when the market respects the 0.5 retrace, the natural projection is the 2.0 extension in the opposite direction.
-> You are effectively rotating the same structure: halve in the pullback, double in the extension.
On this chart that 2.0 extension lands right into the $2880 to $2890 area. From C that 0.5 retrace is not random. It is the anchor that mathematically rotates into the 2.0 target and defines the first major squeeze zone above.
2. HTF Fibonacci extension confluence
From there we step out to the higher timeframe structure.
We take a Fibonacci Extension and draw it:
From the highest point on the chart (X)
Down to the first big swing low (Y)
Then up to the next swing high (Z)
This measures the high to low structure and then projects extensions of that full swing.
On that HTF extension, the 1.618 level sits right in the same area as the 2.0 from the 0.5 rotation.
Why the 1.618 and 2.0 together are strong confluence :
1.618 is the classic golden ratio extension.
-> A lot of systems, harmonics and algos respond around 1.272 and 1.618.
2.0 is the clean reciprocal extension of the 0.5 retrace from the internal leg.
-> These two levels are calculated from two different swings.
One comes from the internal retracement structure.
-> The other comes from the higher timeframe swing.
When independent measurements give almost the same price area, that zone is not made up. It is where different groups of traders and different models will naturally cluster orders, targets and stops.
So $2880 to $2890 is a real Fib confluence, not a guess. It is a logical first destination for a short squeeze and it sits exactly inside the current FVG.
3. Fixed Range Volume Profile and the LVN at $2880
Now we bring in volume.
When we draw a Fixed Range Volume Profile from the swing low of 9 April to the swing high of 24 August, we see a very clean Low Volume Node (LVN) at roughly $2880. That LVN sits inside the same Fair Value Gap that price is currently exactly trading in.
What this actually means :
A Low Volume Node is an area where historically the market did not trade much.
-> Very few contracts changed hands there.
-> The auction basically skipped through that price zone.
In an auction model, high volume areas are where the market is comfortable.
-> Price spends time there, value is accepted, big rotations happen.
Low volume areas are the opposite.
The market rejected that area before.
-> Price moved through it quickly because either buyers or sellers completely dominated and there was no real back and forth.
So when price comes back down into an LVN inside an FVG like this, it tells me:
Price has moved back into an old inefficiency where previously there was no interest in building value.
If buyers are absorbing there (which we see from spot metrics), then the LVN can act as a springboard.
Either price slices straight through the LVN to the next high volume area.
Or price tags it, rejects sharply and uses it as the launch zone for the next leg.
In this case the LVN at $2880 is aligned with:
The 2.0 extension from the 0.5 rotation
The HTF 1.618 extension zone
The current FVG
That is a triple confluence of math, volume and inefficiency. Price did not randomly land here.
4. Spot A/D: hidden bullish accumulation
Now we go under the candles and look at order flow.
First is the A/D (Accumulation / Distribution) indicator, applied on spot and mainly on the 4H and higher.
Why A/D on spot and why on 4H plus :
Spot represents real ETH being bought and sold.
-> No funding games, less synthetic noise.
-> It shows where true demand is stepping in.
Futures can be distorted by hedging, arbing and leverage rotation.
On low timeframes there is a lot of noise from scalpers and short term spoofing.
-> 4H and higher smooth out that noise and reveal the bigger players.
What we see now:
On the spot A/D line both highs and lows have been trending higher.
Price, in the same window, is trending lower.
So price is making lower lows, A/D is making higher lows and higher highs.
This means:
On down moves, there is more volume being absorbed by buyers than being pushed by sellers.
Sellers are getting absorbed.
Smart money is accumulating spot while the chart still looks bearish to the average viewer.
That is textbook hidden bullish accumulation.
5. CVD and OI: shorts are loading into that accumulation
Now it gets even more interesting when we bring in CVD and OI.
5.1 Aggregated Spot CVD vs price
On 13 November:
Aggregated Spot CVD sat around -31.61k.
From that point it started trending up, forming higher highs and higher lows.
Today it is around 100.91k.
Change in Spot CVD:
100.91k minus -31.61k = +132.52k
So net buying on spot increased by about 132.5k units while:
Price moved from roughly $3150 down to about $2988
That is a drop of 162 dollars
162 divided by 3150 is about 5.1 percent
So we have:
A big positive flip in net spot demand
Only a small net drop in price
If bears were truly in control, that amount of spot absorption would not allow price to stay this close. You would see a much heavier breakdown earlier in the move. Instead buyers have quietly soaked up the selling and then pushed net CVD positive while price is only down around 5 percent.
This fits perfectly with the bullish accumulation narrative.
5.2 Futures CVD and OI
On the futures side:
Aggregated Stablecoin Margined Futures CVD dropped from about -408k to about -1.34M.
-> Roughly -932k more net selling.
Aggregated Coin Margined Contracts CVD dropped from about -88M to about -807M.
-> Roughly -719M more net selling.
At the same time:
Stablecoin Margined OI increased from 4.39M to 4.88M.
-> Increase of about 0.49M which is around 11 percent.
Coin Margined OI increased from 1.81B to 1.91B.
-> Increase of about 0.10B which is around 5.5 percent.
So futures traders are:
Aggressively hitting into the bid
Increasing net short pressure (CVD more negative)
Keeping positions open and even adding more (OI going up)
All of this while:
Spot is quietly buying
Spot CVD is strongly positive
Price is sitting in a triple confluence zone around $2880 inside an LVN and FVG
A simple way to think about it:
Spot is the strong hand slowly loading.
Futures is the weak hand aggressively shorting into that demand.
Price is held in a relatively tight range compared to the amount of futures selling.
Once that selling slows or some catalyst hits, all of those shorts are fuel. They will have to cover into a thin LVN zone, through a Fib confluence and into areas where there was previously low participation. That is exactly how you get fast vertical moves.
6. USDT.D confluence
Now, when looking at the USDT.D chart on the HTF, we can see that it has rejected from the 0.886 retracement, broke structure and is now respecting a descending trendline, while RSI is showing heavy bearish divergence. This means that even though USDT.D tried to push higher, each push had less and less momentum behind it, and buyers of dominance are getting weaker. For crypto, that is important, because a topping and rolling over USDT.D often signals capital rotating out of stablecoins back into risk assets. In confluence with everything discussed before, this adds another layer to the thesis. Spot is accumulating, futures are overcrowded on the short side, ETH is sitting in a strong Fib and volume confluence zone, and at the same time USDT.D is showing signs of distribution and potential downside. If USDT.D continues to bleed down from this 0.886 rejection, it structurally supports a scenario where ETH squeezes higher into the targets discussed.
7. Targets and the bigger picture
Based on this structure and the order flow, the upside targets I am watching are:
$3800
$4400
And if crypto gets proper momentum, a final Swing Fail Pattern around $5100
The logic behind these levels:
$3800 and $4400 are not random numbers. They line up with higher timeframe Fib extensions and prior structural pivots and volume distribution levels. Think of them as natural waypoints where bigger players will take profit, hedge or reposition.
$5100 is where I can see a classic SFP scenario:
We push into a new high.
Late buyers chase the breakout.
Existing shorts get squeezed.
Then once liquidity above the prior highs is taken, a sharp reversal becomes very likely.
So my roadmap is:
First we reclaim and rotate out of this $2880 confluence zone. Then $3800 and $4400 become realistic magnets. If the whole crypto complex catches momentum, $5100 as an SFP high is very much on the table.
Invalidation:
Invalidation for this specific bullish accumulation and squeeze thesis comes only if ETH starts trading below $2470. As long as we hold above that level, every dump is still in quiet bullish accumulation territory for me, unless order flow starts telling another story.
7. Conclusion
Fib structure points to $2880 as a key confluence level.
Fixed Range Volume Profile confirms this with a clean LVN inside an FVG.
Spot A/D and Spot CVD are showing bullish accumulation while price grinds down.
Futures CVD and OI show shorts loading into that spot absorption.
Upside roadmap: 3800, then $4400, with a possible SFP (Swing Fail Pattern) around $5100 if the trend extends.
Invalidation only if ETH starts trading below $2470. Until that happens, every dump for me stays in quiet bullish accumulation territory, unless order flow flips.
USDT.D confluence.
Same as always. This is not financial advice. Trade your own plan, size your own risk. I am just laying out the math, volume and order flow that I see behind this potential short squeeze on ETH.
Markets do not whisper without reason. When math, volume and flow all hum the same melody, I prefer to listen before the crowd hears the drop.
-------
If this spoke to the part of you that loves clean math and dirty squeezes, drop a like, leave a comment, and bookmark it. When the candles start to sprint, you will want to remember where the story was already written.
- ThetaNomad

Ethereum (ETHUSDT): Approaching a Major Turning PointHI!
Trend Structure
Since mid-October 2025, ETH has been trending inside a well-defined descending channel, forming consistent lower highs and lower lows. The break of the previous bullish trendline back in July 2025 confirmed the shift into a corrective phase.
Key Support Zone (S&D)
Price is now around $2,730 (Nov 2025) and heading toward the crucial $2,450–$2,300 S&D zone, a strong support area that held the market firmly between May and July 2025.
Expected Price Behavior
A final liquidity sweep toward $2,300–$2,200 is possible before any sustainable upside move. This aligns with the lower boundary of the descending channel.
Deeper Support (DP)
If this level fails, the next major demand sits at $1,950–$1,800, last touched in March 2025.

Ethereum (ETH): Expecting $3,650 as First Target | BullishThe recent dip we had on ETH has shown the bullish strength, where buyers did not let sellers take control over that zone. What it means for us is an opportunity for a bullish trade that can be taken here.
The main focus is the $3,650 zone, which is acting as a local resistance area where the 200 EMA is also sitting. If we see a proper MSB form near the current area, we might be in a decent bullish movement (short term for sure).
Swallow Academy

A classic analysis of Ethereum.A classic analysis of Ethereum. Support areas are marked with a green line. The main and valid support area for this currency is at the bottom of the hypothetical and valid channel. The box at the bottom of the channel indicates the approximate time.

eth short plan according HTF strucutreBTC and ETH shows complete selling from last one month so i planned accordingly on HTF.
#tradingplan #eth BINANCE:ETHUSDT

ETH Extreme Cadence 2026 PredictionAs I see it, it might be possible that we are about to witness this huge movement down and up. It has occured three times in a similar cadence and same highs trend line so...
It also makes sence that we retest the All Time POC .
Anyway I´m buying as much ETH as I can next March/ April 2026 at that price...
Hope it´s usefull for some of you.

Ethereum Bearish Price Action Suggests Lower to Come Ethereum’s price action is weakening as downside pressure accelerates. ETH has broken through several major support levels and is now trading below the $3,500 zone, which has flipped into a high-time-frame resistance area. This region also aligns with the 200-day moving average, adding to the bearish confluence.
The correction has pushed price toward the $2,600 area, where an oversold bounce may occur. However, any rebound from this level would likely form a lower high within the broader downtrend, as Ethereum continues to print consecutive lower lows.
From a structural perspective, the key downside target remains the $2,100 range low, which serves as the next major support zone. With ETH now finding acceptance within a lower trading range, the probability of price rotating toward this level has increased.
While a short-term bounce is possible, market structure currently favors continued bearish movement unless Ethereum can reclaim former support levels with strong momentum.

ETHUSDT Last support zones now are touching As previously outlined in our technical analysis, the price zone between $2,400 and $2,500 represents the final major support level for the current market structure. A decisive breakdown below this critical support confluence would signal a transition into a confirmed bear market, potentially triggering an additional decline of 40% or more.
Conversely, a strong defensive reaction at this level—preferably with bullish reversal patterns and increasing volume—could initiate a sustained recovery. The key confirmation for a bullish scenario would be a reclaim of the $4,000 level, which would indicate a restoration of underlying demand and potentially mark the resumption of the primary uptrend.
DISCLAIMER: ((trade based on your own decision))
<<press like👍 if you enjoy💚

ETHUSDT last support zones are fighting bears now As observed on the ETHUSDT chart, the asset is undergoing a substantial corrective phase, approaching what may be characterized as a decisive bearish momentum. However, price is now testing critical Fibonacci support levels at the 0.618 retracement zone—a key technical confluence area that historically serves as a potential reversal zone.
The breach of the 0.5 level has now shifted focus to the 0.618 Fibonacci level as the last major defensive support. A strong rejection from this level, particularly with corresponding bullish volume confirmation, could catalyze a trend reversal and initiate a new upward impulse toward recovery targets.
DISCLAIMER: ((trade based on your own decision))
<<press like👍 if you enjoy💚

ETH READY TO REBOUNDLooks like ETH just experienced healthy bull run correction on HTF and currently sitting on strong demand liquidity zone. Use Proper Risk Management

ETHUSDT _ Daily Timeframe
Support Zone: A reasonable support area may lie in the $2,700 – $3,000 USDT range (rounded estimate) given current sentiment and how far price has fallen.
Resistance Zone: The cluster of moving averages (50-200 day) now overhead likely acts as a resistance zone, roughly in the $3,000 – $3,300 range (exact values depend on your chart).
Pivot Price: According to one pivot calculation, a daily pivot is around ~$3,013.83 USDT.
Volatility: ATR (average true range) remains elevated — implying larger daily moves are still possible.
🎯 Market Bias & What It Suggests
Overall bias: Bearish in the short to medium term based on the indicators and moving averages.
Turning point potential: Oversold conditions indicate a potential for bounce or consolidation, but for a meaningful trend reversal, price needs to:
Break above the key moving-average resistance zone
Form higher lows and higher highs on daily chart
See improving momentum (e.g., RSI diverging, MACD turning).
Risk / Reward: Given how far the move has gone down, aggressive downside is somewhat limited (support will likely be tested). However, reward for upside is also limited until resistance is broken.
🧭 Possible Scenarios
Bearish continuation scenario: If price fails support (~$2,700-3,000 zone) and breaks down, next leg lower could test deeper support, perhaps ~$2,000-2,500 depending on broader crypto market.
Neutral / consolidation scenario: Price holds the support zone, ranges sideways between ~$2,700 and ~$3,300 for several days/weeks until momentum rebuilds.
Bullish reversal scenario: Price breaks above resistance zone, establishes support above it, momentum metrics turn bullish — then a move to new highs becomes possible.
✅ What to Monitor (If You’re Following This)
Daily close relative to the resistance cluster of moving averages.
RSI/MACD for signs of divergence (e.g., price makes a new low but RSI doesn’t) — could hint at exhaustion of bears.
Volume spikes on any reversal attempt — looking for strong buying interest.
Broader crypto market sentiment (since ETH often moves with the market).
Any fundamental / news catalyst (hard fork, regulation, macro-economics) that might shift sentiment.

Check if the price remains above 2887.66
Hello, fellow traders.
If you "Follow" me, you'll always receive the latest information quickly.
Have a great day.
-------------------------------------
(ETHUSDT 1D Chart)
The HA-Low indicator on the 1D chart is showing signs of forming at 2887.66.
Since the HA-Low indicator previously formed at 3472.96 and is showing signs of forming again, determining whether support at 2887.66 is crucial.
Furthermore, since the indicator is located near the M-Signal indicator on the 1M chart, we need to see if the price can maintain its upward momentum above the M-Signal indicator on the 1M chart.
In this sense, a rise above the previous HA-Low indicator level of 3472.96 is expected to trigger an uptrend.
Therefore, to ensure that the uptrend continues after breaking above a key point or range, we need to monitor whether the StochRSI, TC, and OBV indicators remain in an upward trend.
Since the OBV indicator has fallen below the EMA 3, it must rise above and remain above the EMA 3 level.
We need to confirm whether the price can rise above the M-Signal indicator on the 1M chart after passing through this volatility period around November 27th (November 26th-28th).
-
Thank you for reading.
We wish you successful trading.
--------------------------------------------------

Spot idea for Ethereum (Nov 9, 2025)CRYPTOCAP:ETH / #Ethereum Spot idea for Ethereum (Nov 9, 2025)
On October 29, 2025, I posted an update saying it's worth waiting for Ethereum to drop into the $3,100 - $3,400 range, since that's where the nearest long trader liquidations are sitting, along with some big limit orders on exchanges like Binance and Coinbase.
We've hit those levels now.
Update:
So, it's time for a new update aimed at traders hunting for a better entry point on Spot (no leverage involved).
There are fresh large limit orders set by market makers and major whales.
➖ On Binance: $3,055, $3,000, $2,900, $2,800, $2,700, $2,500.
➖ On Coinbase: $3,000, $2,500.
If you check the Liquidation Heatmap on the Bybit crypto exchange through the Coinglass platform, the biggest pain point for traders is around $2,500 - $2,700, where big players will scoop up Ethereum more cheaply after those liquidations hit.
To sum it up:
The crypto market and the US stock market are both in correction mode right now, so you need to be extra cautious when looking for entry points and try to avoid using leverage on futures positions—otherwise, you could wipe out your trading deposit.
I think it's smart to hold off a bit longer and enter positions right where the big players are waiting, and where those trader liquidations are clustered.
That way, you'll have an edge on your entry and can hold the trade through Ethereum's distribution zone all the way up to $10,000.
Charts:
Looks like 2026–2027 could hit peak cycle vibes, right alongside the highs for stocks and crypto.
Altseason on deck?

ETH Downtrend Strengthens as Sellers Keep Full ControlHello everyone, let’s take a closer look at ETH in the current market context.
ETH is moving in a clearly defined downtrend, where every bounce only manages to reach a Fair Value Gap before being rejected almost instantly. The Lower High – Lower Low structure remains intact, showing that sellers still maintain complete dominance over the market.
On the news side, the picture isn’t any brighter. Bitcoin is stalling at key resistance, weakening flows into altcoins. The ETH spot ETF has offered no fresh catalysts, and the Fed continues reinforcing its “higher for longer” stance. In other words, there’s nothing in the current environment that supports meaningful buying momentum.
Technically, ETH is trading below a thick, downward-sloping Ichimoku cloud. Red FVG zones continue to reject price, and the Volume Profile reveals significant liquidity resting lower — effectively “pulling” price back towards previous trading regions. Every signal is aligning in the same direction.
From my perspective, ETH is likely to slide further into the 2,720–2,740 USDT zone to fill the remaining green FVG. If selling pressure continues at the recent pace, price could even extend toward 2,650 USDT — a high-liquidity area and the nearest structural low.
What do you expect next — a deeper drop or a surprise reversal?

Ethereum | 3 hrs | Long | +15%This technical analysis is for informational and educational purposes only. It does not constitute financial advice. Remember to always research and consult with a professional before making investment decisions. Good luck! 📈💼🚀

$ETH Possible Scenario (Read Caption)If Ethereum fails to make a strong comeback above $4,200 and a strong weekly candle closes above this level, then this scenario is highly likely to occur.
Pay attention, this is just a possible scenario. In this case, the target will be under $1400.
ETHUSDT: Pullback to 2,900 Before the Next DropLooking at the current price action, ETH is showing the classic signs of a weak market : shallow pullbacks, weak buying pressure , and repeated rejections at key resistance zones. Everything suggests ETH is simply taking a short pause before the next leg down.
On the H4 timeframe, price remains firmly inside the descending channel drawn on the chart. Every time ETH touches the upper boundary of the channel, it gets sold off aggressively — a pattern that has repeated consistently. The 2,900 USDT area above now acts as a confluence resistance zone: it aligns with the channel’s upper boundary and a corrective structure — the perfect place for sellers to step in.
At the moment, ETH is making a minor pullback to retest the 2,900 region, but buying momentum is fading and candles are being pushed down repeatedly. This indicates that a bearish reversal is likely forming. Once rejection confirms, the nearest target is the 2,650 support zone. If bearish momentum accelerates, ETH could slide further toward 2,550.
Reference Scenario
Main Trend: Bearish
Strategy: Wait for ETH to retest 2,900 and SELL
Targets: 2,650 – 2,780 → deeper target: 2,550

Ethereum 1st Spot Buy Target has been reachedMarkets like to reverse at low volume nodes or fair value gaps, so as you can see, we have reached one of the lowest volume areas of this year so this can act as my personal buy target for Ethereum.
2nd and 3rd are noted as well.
Wish you all the best trading.

#Ethereum (Higher Time Frame Analysis)We can see Volume Areas and BQM levels.
I am watching these levels for a Spot Buy Trade.
It is better to DCA #ETH for now
ETHUSDT at major support , holds or not??#ETHUSDT... market just reached near to his major supporting area for today,
That is around 3002-04
Keep close and buy above .
NOTE: we will go for cut n reverse below that in confirmation .
Good luck
Trade wisley

ETH/USDT – Weekly Analysis (W1)Price is around $2,730 after a strong weekly sell-off (–11.8%).
ETH has broken below the 0.618 retracement of the previous impulse, showing loss of bullish momentum.
Price is retracing toward a major multi-year demand zone.
