Ethereum (ETH): Chart Looks Very Healthy & BullishDespite the fact that the ideal entry for long on ETH would be after that break of local highs, we decided to go in from the current market price, where the price is still inside the bullish trend that has been keeping the price in a healthy trend run.
That being said, I would suggest going long here with a smaller position size, and once we see the price get that BOS near ATH, we would top up with a position twice as big.
Stop-loss would be considered once a weekly candle would close below the EMAs.
Swallow Academy
Trade ideas

ETH: Another Attempt To Resume Upward Movement
Ethereum is showing strong bullish momentum after forming a bullish flag pattern on the chart. The price has broken above the flag, confirming the potential for further upside movement.
As long as ETH stays above the breakout zone, the next target levels are around $4,125 and $4,285.
If the price fails to hold above the breakout area, a short pullback could occur before another attempt to move higher.

ETH 4H Analysis | Day 4🥳 Hey everyone! Hope you’re doing great! Welcome to SatoshiFrame channel .
✨ Today we’re diving into the 4-Hour Ethereum analysis. Stay tuned and follow along!
👀 Ethereum, the best and largest altcoin in our market, has also broken its descending trendline just like Bitcoin, and the long position scenario we discussed earlier has pretty much played out — I hope you took advantage of it.
🔍 After breaking through its previous resistances, Ethereum is now facing a new resistance area where some sellers have stepped in and some buyers are taking profits. There’s a possibility of a short-term pause in price movement. This zone has created a trigger for us, and the next, more logical long triggers for Ethereum are at $4,252 and $4,723. A breakout above these levels could kick off a strong upward move.
🧮 Looking at the RSI oscillator, it’s approaching the 70 zone but has been rejected near that level. For a confirmed breakout above $4,078, RSI needs to enter the overbought region. There’s also a support zone around 50, which could act as a rebound area for oscillatory movement. Right now, RSI has two key zones — 50 and 70 — that define its structure.
🕯 Notice the Ethereum volume behavior: to break through both static and dynamic resistance zones, the volume increased — this happened because a large number of sell orders were stacked in that area, and those orders needed to be filled before price could move upward smoothly. After that breakout, buying volume started to decline slightly, meaning both price and volume are now resting. For Ethereum to break this resistance zone, we either need sell orders to be absorbed or short positions to get squeezed by trapped traders.
🧠 We can outline a few possible scenarios for Ethereum’s position — some of them might be slightly more complex to manage:
🟢 Long Position Scenario 1
We need patience and a price cooldown. Wait for Ethereum to touch its nearest support zone, then rise with increasing volume. If during this move we see setup candles along with a resistance breakout, we can enter the position with a tight stop size.
🟢 Long Position Scenario 2
We can use an order-book stop-buy setup at Ethereum’s resistance and place a wider stop to catch any breakout spike. This allows participation in a potential price surge and can yield solid profit — though these setups usually take longer to reach an ideal risk-to-reward ratio.
🟢 Long Position Scenario 3
This one’s less likely but still worth noting: Ethereum could break its resistance with rising volume, then pull back to retest that same resistance (now turned support). Afterward, if we see volume increase, setup candles, and a confirmed pullback breakout, we can enter with a small stop size.
🔴 Short Position Scenario
A short setup would only make sense if the micro-buyer zone fails, accompanied by heavy whale candles, strong selling pressure, and an overall market crash.
❤️ Disclaimer : This analysis is purely based on my personal opinion and I only trade if the stated triggers are activated .

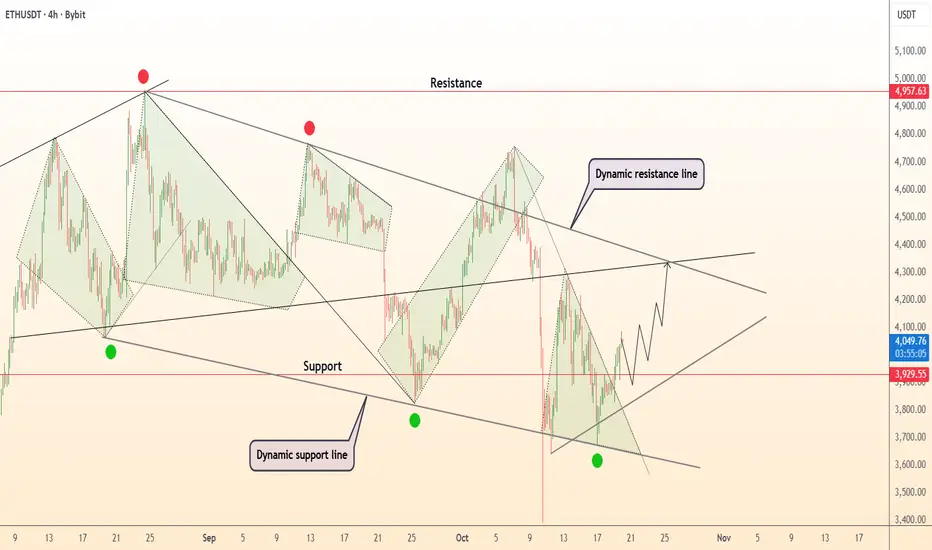
ETHUSDTETH is making LH/LL within certain boundaries, where support ranges from 3663 to 3821 and resistance is at 4091 may take entry while breaking the resistance, but it is better to take entry with 2nd BoS in 1H TF. There is no divergence .

ETH Local Uptrend — Watching 3,817 and 4,292 LevelsLast week, the price also continued its downward movement, but on the Binance chart, it received a positive reaction from the support zone. At the moment, the price is in a local uptrend.
The risk level for this week is 3,817 — if it breaks and the price fails to recover quickly, we could see a drop toward the 3,365 target. As long as the price remains above this level, the goal is to reach and break the previous high at 4,292 .

DeGRAM | ETHUSD fixed above the support line📊 Technical Analysis
● ETH/USD is forming a recovery structure after rebounding from the dynamic support near 3,930, showing higher lows that confirm renewed buyer control.
● Price is expected to advance toward 4,350–4,400, where the dynamic resistance line intersects, marking the next key breakout zone for continuation.
💡 Fundamental Analysis
● Ethereum gains support as network activity and L2 adoption rise, while investor sentiment improves following a decline in gas fees and strong DeFi flows.
✨ Summary
● Long bias above 3,930; objectives 4,350–4,400. Technical recovery aligns with improving network fundamentals and risk-on crypto sentiment.
-------------------
Share your opinion in the comments and support the idea with a like. Thanks for your support!
ETH Range Ride – Bulls Still Holding the Line 🌊 🏄♂️
ETH’s still vibin’ inside that downward trendline, just bouncing between 4K and 3.75K like it’s riding the tide 🌊. This range has been soakin’ up liquidity for a while now — and it’s starting to look like a solid support zone where midterm bulls might wanna start stacking up for the next leg 📈.
Even with that sharp push down we saw a few days back, structure hasn’t flipped bearish yet. As long as price keeps holdin’ this base, the chart still leaves room for ETH to reclaim momentum and maybe even hunt new ATHs when the next big wave hits 🚀🤙.
Until then, it’s a patience game — wait for confirmation before paddling in. Let the move come to you, not the other way around ⚡
💬 What do you think about this scenario? Only share your idea if you’ve got another opinion — otherwise just hit that button 👍

The #1 Reason For The Recovering Crypto CrashI was pursing this girl and yesterday
i saw her with other men pursuing her as well.
Its all my fault...next time she goes
public while i pursue her i have to make sure
i propose fast and get the answer.
People use tricks to test us, sometimes
they test us to declare in the public that we want
them so that they have proof
in-case you turn out to be a fake friend.
I have to say the best time to buy BINANCE:ETHUSD
is when its between the moving averages
because you want to buy it after the market crash.
Look at the price pattern
This crypto crash has wiped out
so many traders.
And its because of this i have decided to only
buy this crypto CRYPTO:ETHUSD
after a market crash
Look at the price pattern...
do you see the double bottom?
This double bottom has appeared between
the 50 EMA and the 200 EMA
this is pure market psychology at its best.
Rocket boost this content to learn more.
Disclaimer: Trading is risky please use
risk management and profit taking
strategies.
Also fee free to use a simulation trading account
before you trad with real money.
Ethusdt - dragon longIf you like the idea, please put a ‘like’. It's the best ‘Thank you!’ 😊 P.S. Always do your own analysis before a trade. Set a stop loss. Capture profits in instalments. Withdraw profits in fiat and make yourself and your friends happy.

eth 5293 on 30 min chartall chart indicator on 30 minutes chart
with fibo extension
with stochastics
all the way up

ETHUSDT/BUYThis is my analysis, not a signal.
"Ethereum is currently in a bullish phase. Analyzing the daily chart, we can observe a series of higher highs and higher lows, confirming the uptrend. The RSI is in positive territory without being overbought, and trading volume supports the upward move. The next key resistance to watch is around the $ mark. #Ethereum #ETH #TechnicalAnalysis #CryptoTrader"

ETH: Another Attempt To Resume Upward MovementETH: Another Attempt To Resume Upward Movement
Ethereum is showing strong bullish momentum after forming a bullish flag pattern on the chart. The price has broken above the flag, confirming the potential for further upside movement.
As long as ETH stays above the breakout zone, the next target levels are around $4,125 and $4,285.
If the price fails to hold above the breakout area, a short pullback could occur before another attempt to move higher.
Overall, the structure remains bullish while ETH trades above the $3,900 support zone.
You may find more details in the chart!
Thank you and Good Luck!
❤️PS: Please support with a like or comment if you find this analysis useful for your trading day❤️

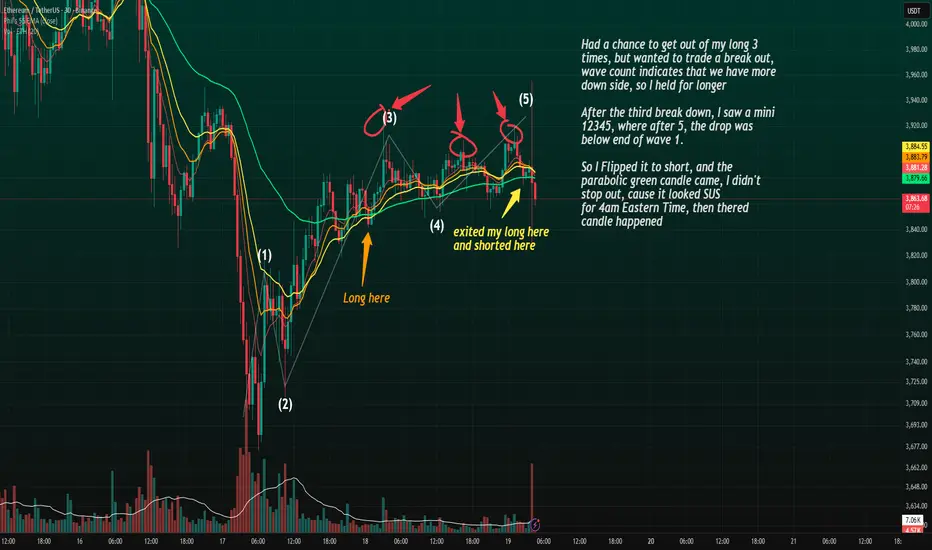
I trusted my wave count dispite volatilityI originally went long after seeing a potential breakout setup, expecting a higher time frame Wave 5 to unfold.
I had multiple chances to take profit on the way up (marked with red circles), but decided to hold since my wave count suggested there was more upside ahead.
After the third rejection, I spotted a clean mini 1-2-3-4-5 structure, and once Wave 5 completed, price broke below the end of Wave 1 — which confirmed weakness.
I flipped short right after exiting my long.
Almost immediately, a parabolic green candle appeared around 4 AM EST, which looked suspicious to me.
I held through it instead of panic-stopping, because the structure still looked like a completed impulse followed by a correction.
Zooming into lower time frames gave further confidence in the five-wave completion, supporting the short setup.
ETH breaks descending channel, forms bullish flagETH broke through the descending channel boundary we mentioned in the previous post and formed a bullish flag pattern
It's also clear that the price bounced off the pattern's upper boundary twice after breaking through, indicating that this boundary has formed a support level
Also, according to the wave theory, Elliott wave 3 is currently forming
Current price: $3,983
According to the wave theory and the bullish flag pattern, movement is possible to $4,100 , $4,300 and higher is possible...
If the price reaches the pattern's upper boundary and enters its boundaries, the movement will continue in the descending channel, at $3,740 and below
More detailed analysis, additional charts, and key levels to watch are available on our site

Ethereum Testing a Critical ZoneThe crypto market has entered a volatile phase as Bitcoin dips below key support levels and Ethereum struggles to hold its ground. Beyond the technicals, Ethereum continues to stand out both fundamentally and structurally. With institutional inflows returning and CRYPTOCAP:ETH maintaining its leadership in the Layer-1 narrative.
Ethereum is currently trading around $3960, with $3600 firmly holding as the value area low. In the near term, price action suggests that ETH may continue to range between $3,600 and $4,200 before making its next significant move.
However, a decisive break below the $3,600 support would confirm a momentum shift to the downside, potentially opening the door to deeper retracements into $3000 region.
This raises the question: Is this a moment for caution, or a strategic opportunity ahead of a rebound?

ETHUSDT: Possible Minor to Major Corrections May HappenETHUSDT has a higher chance of experiencing a minor or major correction in the coming days, although we haven’t confirmed this yet. We need more confirmation before we can be certain about the future of ETH. However, if the price decides to undergo a major correction, it’s likely to drop to our second area, where it’s expected to fill the liquidity gap and then reverse, continuing towards our three targets.
Please use this analysis as secondary bias only or even only for educational purposes. Always conduct your own analysis and risk management before trading or investing in cryptocurrencies, as they carry significant financial risk. Good luck and trade safely.
If you want to support us, you can do so by liking the idea, commenting with your views, or sharing it.
Much love ❤️
Have a great weekend
Team Setupsfx_

BTC Reign Pauses. Can ETH Lead the Charge Temporarily?A Tale of Two Titans: Divergence in the Making
Following the market-wide drop on October 10th, 2025, a significant divergence in character has emerged between the two crypto titans, Bitcoin and Ethereum. While Bitcoin's bullish structure appears compromised, Ethereum is exhibiting remarkable resilience, tenaciously holding key support and potentially setting the stage for a period of ETH-led market action.
This analysis explores the possibility of a temporary decoupling, where Ethereum takes the reins while Bitcoin enters a period of consolidation.
Bitcoin: Structure Compromised
From my perspective, the recent crash has severely compromised the prior bullish structure on Bitcoin's daily and weekly charts. The upward momentum has been invalidated, leaving BTC in a state of structural weakness. The most probable path forward for BTC appears to be a prolonged period of sideways consolidation, likely forming a complex flat correction. For now, the king seems to be resting in its coffin.
Ethereum: The Resilient Contender
In stark contrast, Ethereum’s chart tells a very different story. Here's why ETH is capturing our full attention:
Crucial Support Holds Firm: ETH is impressively defending the critical support zone around $3,756. Its refusal to follow BTC into a deeper decline is a powerful statement of relative strength.
Intact Market Structure: Unlike Bitcoin, Ethereum’s weekly and daily upward structures remain intact. The long-term bullish thesis is not yet broken (Weekly chart upward structures & Elliot are still holding targeting around 5900 USDT)
Emerging Elliott Wave Count: As illustrated on the daily chart, a weak but valid Elliott Wave count is taking shape. We appear to have completed a Wave (2) correction right at this key support. If this level holds, it paves the way for a powerful Wave (3) impulse to the upside.
Confluence of Bullish Divergences: Adding significant weight to this outlook are the strong bullish divergences flashing on both the Daily and 4-Hour charts. Around the $3,756 support, both the RSI and MACD are showing higher lows while price has tested lower lows — a textbook signal of waning bearish momentum and a potential reversal. Should this scenario materialize, we can expect a notable increase in weekly and monthly volatility as momentum shifts.
RSI divergence on 1D chart
MACD Divergence
OBV (4H chart) note that obv always making higher lows around the current support
BBWP contraction on 4H chart
The Big Question: A Changing of the Guard?
This brings us to a fascinating and potentially market-defining question: Can Ethereum lead the crypto market to new all-time highs while Bitcoin moves sideways?
We may be witnessing a temporary 'changing of the guard,' where ETH's fundamental strength and resilient technicals allow it to become the market's temporary primary driver. While Bitcoin's gravity is undeniable, the current situation suggests that Ethereum might be carving its own path.
The confirmation of this thesis rests on the $3,756 support. A sustained hold above this level could be the opening act for the next major bull run, led by an unexpected protagonist.
Share your thoughts in the comments

ETH bottomed at 3825, 1st Target 422522025-10-19 EST 5:39 AM
ETH Bottomed at 3825
1st Target 4200 to 4225

The Next Crypto Winter or Just a Cold PauseThe past few months in the crypto market feel strangely quiet.
Volatility has slowed down, emotions are swinging between fear and confusion, and trading volume has dropped noticeably.
But is this just a calm pause before the next bull runor the early whisper of another crypto winter?
Hello✌️
Spend 2 minutes ⏰ reading this educational material.
🎯 Analytical Insight on Ethereum:
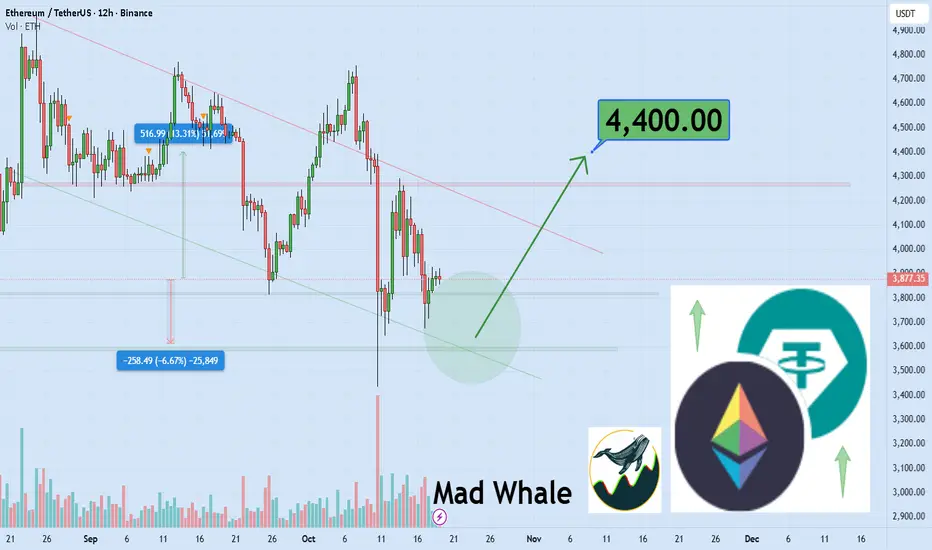
Ethereum is testing the lower boundary of its bullish channel and key daily support 📉.
If this level holds, a potential 13% upside could target $4,400$🚀.
Now , let's dive into the educational section,
❄️ What Does “Crypto Winter” Really Mean?
A Crypto Winter is not just a price drop. It’s a long period when market excitement fades, liquidity dries up, and investors lose confidence.
During this phase, traders turn cautious, smaller projects disappear, and overall volume falls sharply.
We’ve seen this before most notably in 2018 and 2022 when Bitcoin crashed from all-time highs and stayed frozen for months.
📉 Current Signals: Are the Cold Nights Coming Back?
Recent data shows patterns that can’t be ignored.
Massive leveraged positions have been liquidated, exchange volumes are shrinking, and activity in DeFi projects is fading.
Many traders complain about the lack of momentum. In short, the engine of the market seems to be cooling down.
🧠 Market Psychology: When Fear Overpowers Greed
The Fear & Greed Index is once again leaning toward “Extreme Fear.”
This is when inexperienced traders panic and pull out their funds—while the smart money starts to accumulate quietly.
In these phases, separating logic from emotion becomes the trader’s greatest skill.
Fear blinds, but data reveals opportunity.
🧭 Educational Section: Using TradingView Tools to Spot Market Winters
If you want to visualize this on your charts, TradingView offers everything you need.
Start with the Volume Profile Visible Range indicator—it helps identify zones where the most trading activity occurred, showing where “smart money” might be hiding.
Next, try the Fear & Greed Index Indicator by searching it in the Indicators tab.
Then add the Moving Average Ribbon; when multiple averages compress or align downward on higher timeframes like Daily or Weekly, it’s often a sign of market exhaustion.
Finally, keep an eye on RSI (Relative Strength Index). If RSI stays below 40 for an extended period, buyers are losing control.
Combining these tools gives a realistic view of whether the market is cooling down.
Traders who master these indicators can stay objective and confident while others are led by noise—exactly the kind of analysis TradingView editors love to highlight.
🔍 Do the Data Confirm a Real Winter?
According to sources like Fool, CoinTracker, and BankRate, the signs are cautious but not final.
Bitcoin remains above key support levels in some timeframes, and on-chain data doesn’t show a complete capitulation of long-term holders.
So right now, we’re standing at a crossroads—one that could lead to either a deeper freeze or a quiet recovery.
💡 Final Advice for Traders
In times like this, your most powerful tools aren’t indicators or news—they’re your mindset and risk control.
If the market feels cold, slow down your trading, tighten your stops, and keep your liquidity flexible.
Sometimes, a winter is not a punishment—it’s an invitation to rest, learn, and prepare for the next move.
🪶 Summary
The crypto market is balancing on a fine line.
The cold signs are visible, yet hope still breathes beneath the surface.
Focus on data, emotion control, and TradingView tools to stay ahead of the crowd.
Don’t fear the frost sometimes, opportunity is hidden in the ice.
💡golden recommendations
Always define your exit and stop loss before entering.
Enter trades only when your mind is calm, not emotional.
✨ Need a little love!
We pour love into every post your support keeps us inspired! 💛 Don’t be shy, we’d love to hear from you on comments. Big thanks, Mad Whale 🐋
📜Please make sure to do your own research before investing, and review the disclaimer provided at the end of each post.
Dealers Were in Short Gamma. No Surprise We DroppedA massive flip zone just showed up on the GEX map and dealers were positioned deep in short gamma.
That means every downward move in spot forced them to sell even more to hedge, amplifying the pressure.
So it’s not a random sell-off , it’s a mechanical reaction from the dealer flow itself.
When the market enters negative gamma territory, volatility feeds on itself.


ETH-USDT Forecasting based on my analysis we have correction up to 2/3 NOV2025
THEN CONTIUNE DOWN TREND

ETHEREUM ETHUSDTETHEREUM ,sell confirmation will be on retest ,the Ethereum price action from the structure broke weekly demand floor on retest we sell.
key demand floor
@3864.70
@3074.65
@2096.51 my choice
@1509.62 my choice
@871- @900 my choice
Ethereum continues to be central to smart contracts, DeFi, and NFT ecosystems.
Price drivers include technological improvements, regulatory developments, and macroeconomic factors affecting crypto markets globally.
#ethusdt #bitcoin #crypto
