ETHUSD SELL NOW TO 3,650!!!!!ETHUSD run liquidity on the 30min time frame after a minor pull back at the rc point which is my poi for a short sell point am looking forward to see price revisit 3,650 for a liquidity sweep to continue the bullish move
Lets know what your thoughts on this.......
Trade ideas

ETH 4H Analysis | Ethereum price squeeze is reaching its limit🥳 Hey everyone! Hope you’re doing great! Welcome to SatoshiFrame channel .
✨ Today we’re diving into the 4-Hour Ethereum analysis. Stay tuned and follow along!
😅 Yesterday I didn’t get the chance to post Ethereum’s analysis the way I wanted to — but today, I’ve prepared a full 4-hour analysis of Ethereum, and I’d be glad to have you follow along.
👀 Looking at Ethereum on the 4-hour timeframe: after the recent flash crash, ETH formed a support zone around $3,747, then bounced with a strong +10% pump upward. It was later rejected near $4,268 and moved back down, creating a double-bottom structure aligned with the previous support zone — now forming our valid static support.
A descending trendline has been drawn from the rejection points at $4,723 → $3,969, acting as our dynamic resistance. Ethereum is now nearing the apex of this triangle, and we’re waiting for a breakout. Note that this dynamic resistance overlaps with a static resistance zone at $3,969, so a confirmed breakout above that could serve as strong confirmation for a bullish reversal.
🧮 The RSI oscillator shows two key oscillation zones — around 50 and 30, acting as our momentum boundaries. A clean break beyond these zones could bring strong multi-timeframe momentum to Ethereum’s next move and trigger an earlier price breakout.
🕯 In terms of volume, ETH showed heavy selling pressure during the crash, but now, with the formation of a double bottom and clear compression in price, we’re waiting for a volume expansion to confirm direction.
It’s important to note that Ethereum remains the most watched altcoin in the crypto market — if the broader market shifts bullish, ETH could attract significant new buyers and drive capital inflow.
🧠 Based on this analysis, we’ve outlined two high-probability trading scenarios to match Ethereum’s potential reactions:
🟢 Long Scenario: A breakout above both the dynamic resistance and the static resistance at $3,969, combined with rising buying volume and an RSI breakout above 50, would provide a strong signal for opening a long position on Ethereum.
🔴 Short Scenario: A breakdown below the $3,747 support zone, with a strong bearish candle (whale activity) confirming the break of the micro-buyer zone, and an RSI dip into oversold territory, could trigger another wave of selling, presenting a short opportunity on Ethereum.
❤️ Disclaimer : This analysis is purely based on my personal opinion and I only trade if the stated triggers are activated .

ETH Struggles Below Resistance – Bears Still in ControlHello traders, I want share with you my opinion about ETH. Ethereum continues to move within a descending channel, showing a clear bearish market structure on the 1H timeframe. After an attempt to break higher, ETH once again faced strong resistance near $4,280, which previously acted as a major support level before the breakdown. Following that rejection, the price failed to maintain upward momentum and started forming a short-term support line, staying within the boundaries of the current downtrend channel. I expect that upon breaking the support line, the price will reach the target of $3770. The $4,280 Resistance Level remains the key zone that limits any bullish momentum. As long as the price trades below it, the market structure stays bearish. Please share this idea with your friends and click Boost 🚀

Eth Bullish Thesis Bottom In Monday RangeAlthough longs aren't being bought up, still added two more ETH entries. 7 entries so far spread over 3 weeks. Buy the dip^3

ETH Double Top Breakdown
#Ethereum facing rejection from the $4,083.61 key resistance zone.
Bearish structure forming — potential for lower lows ahead 📉
🟥 Scenario Outlook:
🔁 Possible retest of broken support as resistance
🎯 Major target zone: $2,200 – $2,400
🕳 Mid-term bearish if weekly candle closes below $3,800

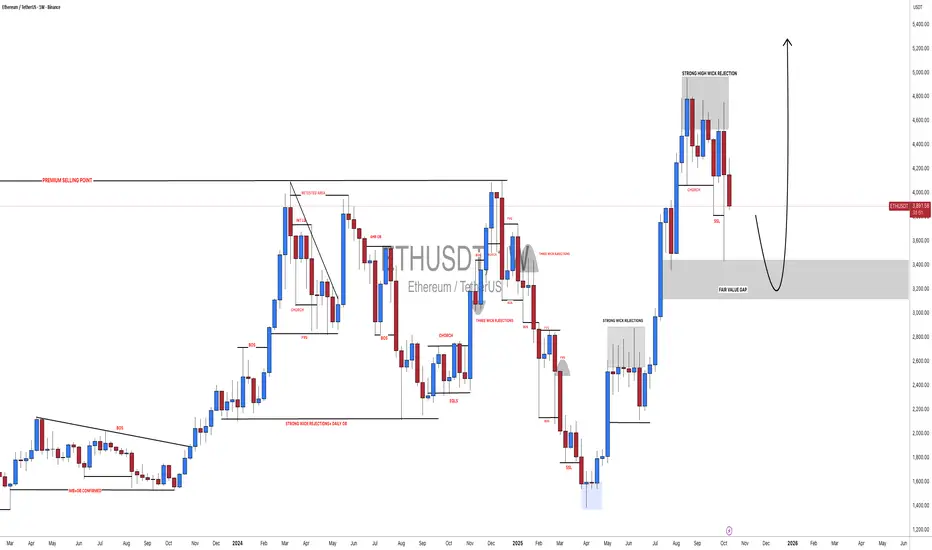
Next Stop: 8K? Ethereum’s Big Breakout LoadingEthereum has been building a clean bullish structure for years and right now it’s standing right at the edge of a major breakout.
If ETH manages to hold above the 4K zone, the 6K–8K targets are just the beginning.
Above that, we enter the FOMO Zone, and a move toward 13K is totally on the table.
As long as price stays above 2.75K, the bullish structure remains solid.

ETHUSDT 18 oct 2025am confident that in the long term, Ethereum will reach a price of $8,000. Despite experiencing a significant correction due to yesterday's crash, the price has rebounded and is now showing bullish signs with a bullish flag pattern, indicating a short-term target of $5,500 to $6,000.


ETH to where ?Good afternoon traders we all knows and see what happened to the market last few days and we saw the correction after that but today is a big day as we can see the liquidation still happening so we have a weak support for the price at this prices 3747.04$-3642.28$ once he break this area we will see the price on 3000$ so hold you money and wait until the market give you a good profit.
P.S: Not a financial advice
See you✌️
The Bear 🐻.

Ethereum Falls Below $4,000—But A Price Rebound Could Be NearEthereum’s price currently sits at $3,727, having fallen from $4,000 in the past 48 hours. However, technical indicators suggest that the altcoin may soon see a reversal, with investors preparing to defend key support levels.
If Ethereum bounces off the $3,742 support line, it could climb back toward $4,000. A successful breach of that barrier would likely push ETH higher, targeting the $4,221 level once again. This movement would align with historical recovery trends seen after periods of capitulation.
Still, a failure by investors to sustain momentum could trigger a deeper correction. Should the market sentiment turn bearish, Ethereum may decline toward $3,489. A drop below this level would invalidate the short-term bullish outlook, delaying any potential rebound.

ETH USDTEthereum, considering the loss of $3875.69, can continue its decline to $3300-$2900, which I think is the last area for support.
We have to wait and see how it reacts.
If the daily candle closes below $2800, the analysis will be invalid.
No analysis is 100% accurate.

ETH 1 month timeframe is downtrend can be pullback to $2100ETH 1 month timeframe is under downtrend the price can be pullback to between $1800 ~ $2100

ETH-USDTEthereum has not yet managed to break its major downtrend line ⚠️
✔️ and is moving towards its support at $3600, which if not broken, could signal a turnaround in Ethereum.

EthusdtI believe that it should be for fear, and a few candles should close below the area, and then we will go for a higher target, I am sure of that.

ETHEREUM TO NEW ATHHow many bullish divergences Ethereum needs to break 4800?
daily RSI
daily MACD
daily STOCHASTIC RSI

Approaching Apex of Equilibrium Structure Ethereum price action is trading within an equilibrium structure, where dynamic support and resistance are converging toward an apex point. This compression typically precedes a strong directional breakout once liquidity builds up.
Key Technical Points:
- Dynamic Support: ~$3,700
- Dynamic Resistance: ~$3,800
- Bias: Breakout-dependent
Price has bounced from the lower boundary of dynamic support, showing buyers defending key structure. The next test lies at the dynamic resistance, which will determine whether momentum breaks higher or rejects back into consolidation.
A breakout above $3,800 would trigger bullish expansion, targeting higher liquidity regions toward $3,950–$4,000. Conversely, rejection here could form another rotation back toward $3,700 to extend equilibrium behavior.
ETH remains balanced for now, awaiting confirmation of breakout direction from the narrowing range apex.

ETH | Short | 6 HrsThis technical analysis is for informational and educational purposes only. It does not constitute financial advice. Remember to always research and consult with a professional before making investment decisions. Good luck! 📈💼🚀

ETH: News May Determine the Tipping Point Before Technical BreakMarket Structure Outlook
If you zoom out to a 4-hour time frame, the current structure resembles a corrective Wave 4 within a larger 1-2-3-4-5 impulsive wave.
Based on the recent price behavior, it looks like we are forming Wave E within that corrective Wave 4.
This is one of the most unpredictable parts of an Elliott Wave structure. To make things trickier, ongoing geopolitical tensions could easily push the market in either direction, amplifying volatility.
From a structural standpoint:
We may be in an incomplete Wave E that is trending downward. If any positive or neutral news (e.g., tariff or rate-related) comes out before the pattern finishes, it could push the price upward, breaking through the upper resistance and potentially initiating Wave 5.
Alternatively, what appears to be Wave E could actually be the first subwave (1) of a larger Wave 3 or Wave 5, which would confirm a new impulsive leg starting soon.
Keep in mind, this is a theoretical framework based on Fibonacci levels, trendline support/resistance, and typical wave structure behavior.
It is not a prediction, but a scenario map that allows for:
Bullish breakout (green path) if market sentiment improves or news provides a catalyst.
Continuation to the downside (red path) if no significant positive catalyst appears.
Use this framework as a conditional roadmap — adjust your positioning and risk accordingly, based on how price reacts to these key levels and structure boundaries.

ETH bottom Hi everyone
ETH had a dip 3800 2 weeks ago and reacted suddenly up to 4700!
Last week crash had 2 meanings
1) Push hopes down towards ETH bullrun
2) accumulation of liquidity below 3800
So for now again 3800 is the best bottom which would launch the next moving
The blue tag shows a weak dip from 4300 to 3800 with buying pressure slowing its bearish momentum
Here we hope a good bounce

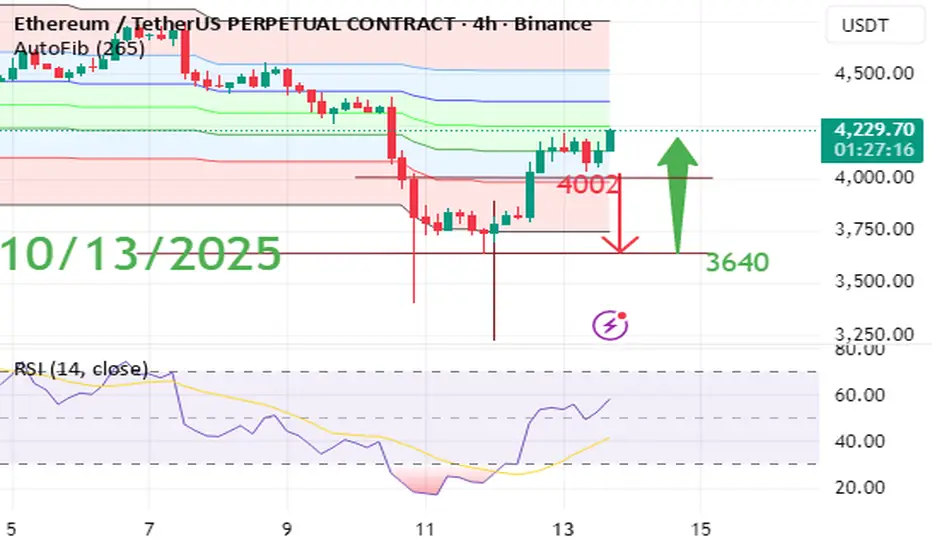
Possible Ethereum scenario considering Bitcoin price instabilityPossible Ethereum scenario considering Bitcoin price volatility next week.
In my opinion, given the global political and economic events, the renewed US government shutdown, and the market’s lack of confidence in Bitcoin’s price stabilization, Ethereum price will correct to $3,640 after rejecting and breaking $4,000.
#ETHUSDT: Fill The Gap At $3200, Target At $6000 The significant price gap has been closed and the market is now in correction mode. We anticipate a further decline of approximately $3200 which remains a key support level for buyers. Our next step is to observe the market’s reaction and remain patient.
Please note that this is not a guarantee and you should always conduct your own research before making any significant investment decisions.
Best regards,
Team Setupsfx
ETH - Potential Bullish Reversal towards PDHETHUSD – Potential Bullish Reversal Scenario 🐂
We’ve observed a strong bullish reaction following a sweep of the previous day’s low (PDL) within our identified Point of Interest (POI), aligned with a 1-hour Bullish Imbalance (BISI).
This reaction suggests a possible shift in market structure, and we are now anticipating a reversal to the upside, potentially targeting resting sell-side liquidity. There is also a chance we may see a Symmetrical Movement Theory (SMT) divergence forming relative to BTC, which could further validate bullish intent.
From my perspective, the liquidity engineered below the recent sweep presents a strategic area where institutional participants may look to accumulate long positions for a more sustained move upward.
We also have favorable draw on liquidity (DOL) to the buy side, including the previous day’s high (PDH) and visible engineered liquidity levels above.
Let’s now monitor price action following this bullish reaction to assess whether confirmation for a higher move develops.
