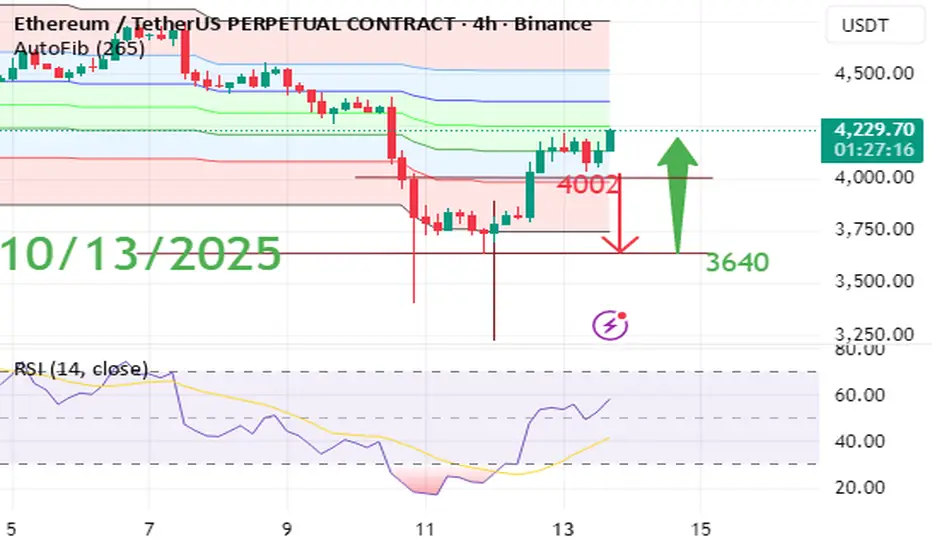
Possible Ethereum scenario considering Bitcoin price instabilityPossible Ethereum scenario considering Bitcoin price volatility next week.
In my opinion, given the global political and economic events, the renewed US government shutdown, and the market’s lack of confidence in Bitcoin’s price stabilization, Ethereum price will correct to $3,640 after rejecting and breaking $4,000.
Trade ideas
#ETHUSDT: Fill The Gap At $3200, Target At $6000 The significant price gap has been closed and the market is now in correction mode. We anticipate a further decline of approximately $3200 which remains a key support level for buyers. Our next step is to observe the market’s reaction and remain patient.
Please note that this is not a guarantee and you should always conduct your own research before making any significant investment decisions.
Best regards,
Team Setupsfx
ETH - Potential Bullish Reversal towards PDHETHUSD – Potential Bullish Reversal Scenario 🐂
We’ve observed a strong bullish reaction following a sweep of the previous day’s low (PDL) within our identified Point of Interest (POI), aligned with a 1-hour Bullish Imbalance (BISI).
This reaction suggests a possible shift in market structure, and we are now anticipating a reversal to the upside, potentially targeting resting sell-side liquidity. There is also a chance we may see a Symmetrical Movement Theory (SMT) divergence forming relative to BTC, which could further validate bullish intent.
From my perspective, the liquidity engineered below the recent sweep presents a strategic area where institutional participants may look to accumulate long positions for a more sustained move upward.
We also have favorable draw on liquidity (DOL) to the buy side, including the previous day’s high (PDH) and visible engineered liquidity levels above.
Let’s now monitor price action following this bullish reaction to assess whether confirmation for a higher move develops.

ETH Daily – High Volume, Rising OI, and a Fight for StructureETH Daily – Volume King Leading the Rebound
At this moment, ETH shows the highest trading volume across major assets.
After the sharp crash that dragged price down to 3435$, under the 0.236 Fib level, ETH found strong support near 3738$,the 0.236Fib level.
From that level, price has now reclaimed the 4000$ mark, a psychological and technical milestone.
If momentum continues, the next resistance sits at the 0.5 Fib level around 4321$.
From a system perspective, structure remains technically bearish for now:
SMA < MLR < Price < BB Center, with PSAR still bearish (above price).
To flip structure bullish, ETH would need a daily close above the BB Center with PSAR reversal confirmation.
OI Analysis:
ETH OI +7.70% growth confirms new leveraged exposure entering during this rebound: a positive sign showing traders are adding risk rather than de-risking.
This increase in OI, combined with strong spot volume (74.6B in 24h), suggests conviction behind the recovery rather than a mere short-covering bounce.
However, elevated OI also means volatility risk is rising: if ETH fails to close above 4000$ or BB Center, liquidations could amplify the next pullback.
Bias:
Cautiously bullish, short-term momentum improving, structure still lagging. Watching daily close above 4k today and BBcenter for future confirmation.
High volume and rising OI often mark the start of a structural shift, but confirmation always comes from the daily close.
In moments like this, patience is what separates the trader reacting to price from the one anticipating the next move.
Always take profits and manage risk.
Interaction is welcome.
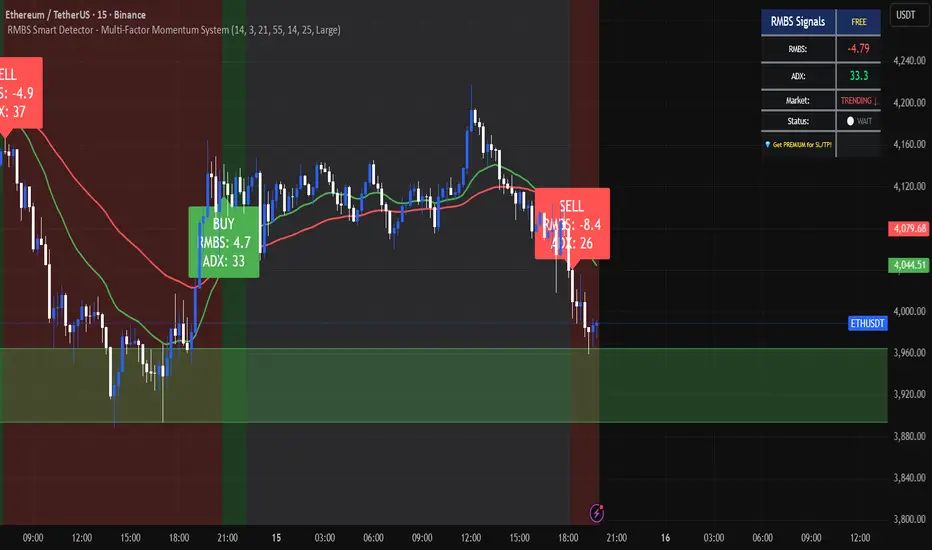
RMBS Smart Detector – Multi-Factor Momentum System update:The previous BUY signal on Ethereum resulted in about a +2% rise.
Now the indicator flashes a SELL signal — trend turning bearish, with $3,900 acting as a strong resistance zone.
💡 Click below to get the indicator and follow upcoming IDEA!
#Ethereum #TradingView #CryptoAnalysis #Indicator #ETH
ETH – Wave 5 Projection (Fibonacci Targets) 16.10.2025Ethereum is entering the final wave 5 of the current impulsive cycle.
Wave 4 correction held strong above the 0.382–0.5 Fibonacci zone, keeping the bullish structure intact.
#ETH #Ethereum #ElliottWave #Fibonacci #Crypto #Wave5
Ethereum Accumulation Before BreakoutEthereum has regained bullish momentum after a recent correction phase, supported by improving sentiment in the broader crypto market. The asset is displaying early signs of stabilization as traders begin accumulating around value zones, indicating renewed confidence among market participants.
From a macro perspective, Ethereum continues to benefit from increasing network activity, particularly within the DeFi and Layer-2 ecosystems. The sustained growth in on-chain transactions and staking participation reflects long-term investor interest, adding strength to the current recovery phase.
Market data also shows that institutional inflows into major crypto assets are on the rise, with Ethereum standing out due to its strong fundamentals and ecosystem resilience. This inflow supports the likelihood of a continued price rebound, as liquidity and trading volume remain consistent.
Overall, ETHUSDT is showing a constructive recovery setup. The combination of improving sentiment, strong fundamentals, and gradual accumulation suggests a potential medium-term bullish continuation, provided global market conditions remain favorable.

ETH/USDT the Final Push Before the Parabolic Run!Ethereum has completed Waves 1–4 and is now coiling for the explosive Wave 5 breakout. After breaking out of a Descending Broadening Wedge, price is retesting the structure a decisive moment that could define the next major leg up.
Holding above $3,430 keeps the bullish setup valid, while a confirmed bounce could ignite a rally toward $12,100+, marking ETH’s potential move into five digits.
Momentum is building the next breakout may not wait long.
Like, share & follow for precise, high probability setups!

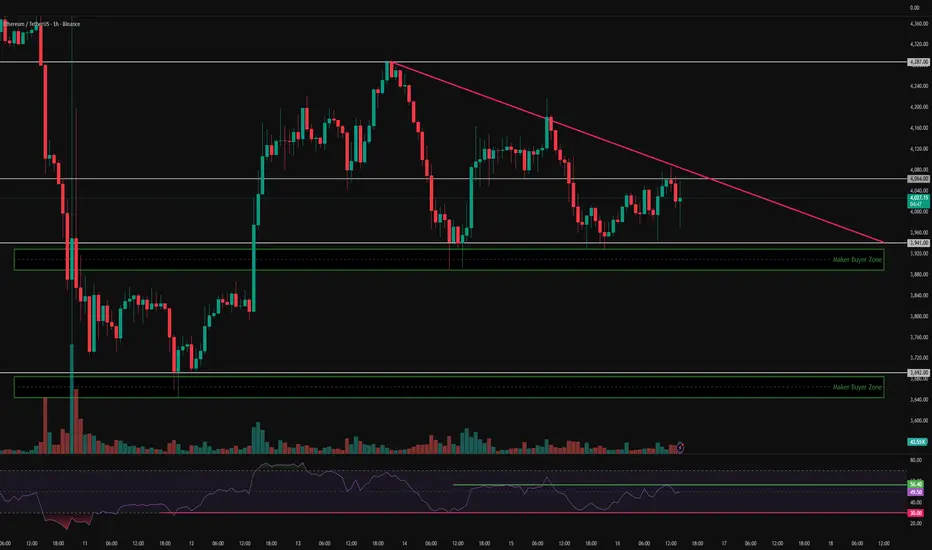
Possible Next Moves for Ethereum | ETH 1H Analysis D2👋 Hey everyone! Hope you’re doing great! - ❤️ Welcome to Satoshi Frame .
📅 Today we’re diving into the 1-hour Ethereum analysis. Stay tuned and follow along!
👀 On the 1-hour timeframe of Ethereum (ETH), we can see that ETH is currently moving inside a triangle compression structure, and it has now reached the final third of that triangle — meaning we’re waiting for a breakout to trigger a trade. The red trendline, which forms the upper edge of the triangle, acts as a dynamic resistance and overlaps with the $4064 resistance zone — creating a strong Long trigger setup. The bottom of the triangle acts as our Short trigger, where a confirmed break below it, combined with a Maker Buyer zone breakdown, could start ETH’s next move and break it out of this compression phase.
🧮 Looking at the RSI oscillator, ETH is currently fluctuating between 56.4 and 30. A breakout beyond either side of this range could enhance trading volatility and increase ETH’s momentum in the upcoming move.
🕯 Analyzing ETH’s volume, we can see that upon reaching the Maker Buyer zone, buying volume has increased — causing a noticeable reversal reaction from that level. If ETH continues to see increased buying pressure, it can break through resistance; otherwise, if it faces selling pressure, a large whale candle will be needed to break the Maker Buyer zone to the downside.
🧠 For Ethereum positioning, we can define two clear scenarios — since the price is near the end of its compression, these setups are relatively simple and well-defined:
🟢 Long Scenario: A breakout above the static + dynamic resistance at $4064, combined with RSI moving above 56.4 and increasing buying volume, could push ETH toward higher resistance levels.
🔴 Short Scenario: A break below the key Low at $3692, accompanied by a large whale candle cutting through the Maker Buyer zone and RSI dropping below 30 to enter its 1-hour OverSell area, would confirm bearish momentum. Note that if ETH dips slightly these days, many major projects, institutions, and even government-linked entities have been accumulating heavily within this identified Maker Buyer zone — so it’s wise to approach short positions with reduced risk exposure.
❤️ Disclaimer : This analysis is purely based on my personal opinion and I only trade if the stated triggers are activated .
ETHUSDTETHUSDT
The green lines are the area that can hit and bounce back up.
This could be the direction Ethereum is going in the long term, but be aware that a lot of novelties are needed.

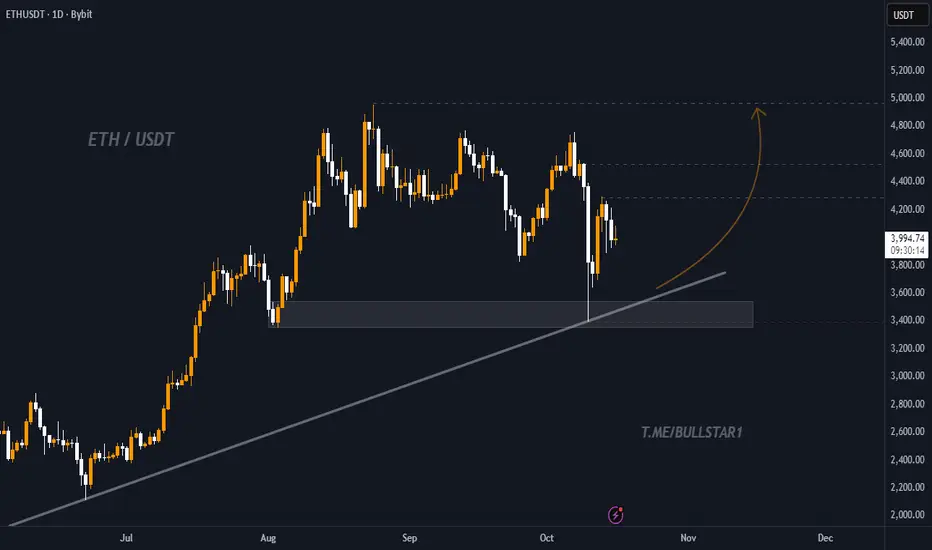
ETH / USDT – Strong Support Retest Before Next Leg UpEthereum is currently retesting a key ascending trendline that has acted as strong support since early summer. The price recently dipped into the $3,400–$3,600 demand zone, showing signs of buyer strength and potential reversal.
If the trendline holds, we could see ETH push toward the next resistance levels at $4,400, $4,800, and potentially $5,000 in the coming weeks.
A daily close below the $3,400 support zone would invalidate this bullish setup and could signal a deeper correction.
📈 Targets:
TP1: $4,400
TP2: $4,800
TP3: $5,000
🛑 Stop Loss:
Below $3,350
ETH remains in a long-term uptrend structure. The current pullback provides a possible entry opportunity if support holds, offering an attractive risk-to-reward setup.
ETH - Ascending Channel Breakdown - Short the WickETH has broken down this large ascending parallel channel.
Expecting a wick down to the uber low levels coinciding with Bitcoin.
Short Entry - 4,000 to 4,020
Stop Loss - 4,300
Target 1 - 3,370
Target 2 - 2,540
Target 3 - 1,645
Target 4 - 200
- DD

ETHCRYPTOCAP:ETH is currently trading inside an ascending channel pattern. Once it breaks out, the measured move points toward a target around $8,100. Structure looks healthy and momentum continues to build.

eTH-USDTTo rise, it needs to break this trend line.
So the condition for rising in Ethereum is to break the downtrend line 📈
If it breaks, it can make itself and altcoins rise.

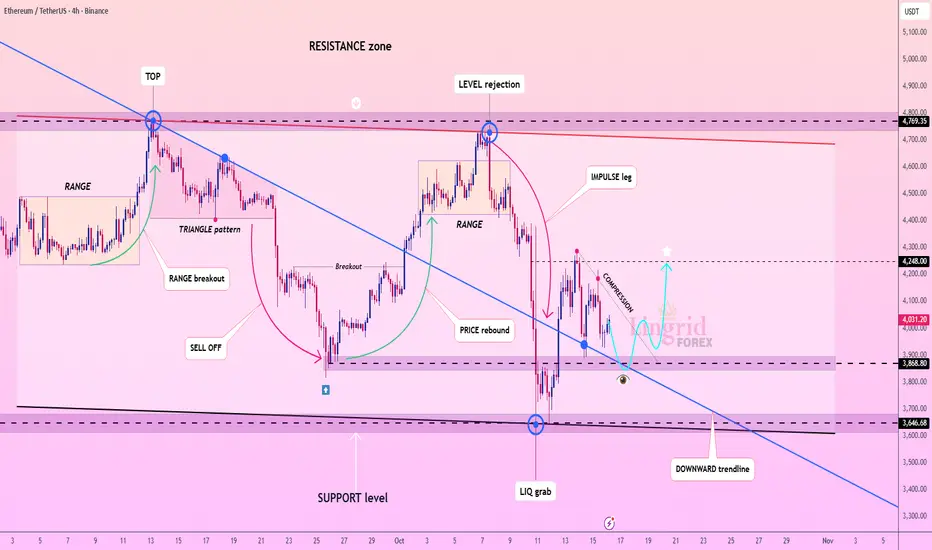
Lingrid | ETHUSDT Squeeze Pattern Breakout ExpectedThe price perfectly fulfilled my previous idea . BINANCE:ETHUSDT rebounded sharply from the liquidity grab near 3500, signaling the defense of the major support level after a deep sell-off. The structure now shows compression just below the downward trendline, hinting at a potential bullish breakout setup. If price sustains above 3900, it could trigger an impulsive rally toward 4250. Momentum remains constructive, and the recovery phase suggests a possible reversal if buyers maintain control.
⚠️ Risks:
Failure to clear the downward trendline may extend the consolidation.
Renewed BTC weakness could cap ETH’s recovery potential.
Unexpected macro data or regulatory developments could pressure the broader crypto market.
If this idea resonates with you or you have your own opinion, traders, hit the comments. I’m excited to read your thoughts!
ETH Bottomed at $39982025-10-16
For the past 5 days, ETH has confirmed $3998 as the bottom.
Buy at this level.
You won't be able to buy at this bargaining level in the future.

ETHUSDTWeak sideways channel and a shade of downtrend with correction to face
the rejection from buyers proves the market will not stand below 3600 and now is upto its new move with 2 hurdles to face before a new high
1. Break Of Downtrend
2. Strong Resistance { purple horizontal line }
Thankyou

ETH completing elliott wave pattern ABCDE or Trendline break? (Left) 2-Hour Chart: ABCDE Descending Triangle
Textbook contracting ABCDE correction for Ethereum/USDT:
A → B → C formed the first three legs of the correction.
D pushed back up into the descending trendline but failed to reclaim structure.
Now, E is the key — this is either:
1. Final flush to complete the triangle, or
2. Failed breakdown, leading to an upside break.
Typical E-wave behavior:
Often weak and lacks momentum (especially compared to A and C).
Sometimes makes a marginal lower low below C, then reverses sharply.
Volume tends to contract during the E-wave, then expand at breakout.
E-wave target zones often line up with
0.618 FIB to 1.0 FIB extension of the C leg.
For the chart on the right, the descending trendline
If price rejects at this line, it’s the clean start of E-wave down (to finish the ABCDE).
If price breaks above this line on strong volume, it invalidates the E-wave flush, likely triggering a triangle breakout early.
What to watch:
Breakout confirmation = strong candle close above $4,180–$4,200 on the 15-min + volume surge.
Breakdown confirmation = failure near the trendline, followed by controlled drift down (E-wave style).
It maybe closer to Friday before we see any sign of breaking out, if the chop continue.
Happy Trading!

ETH/USDT – Ethereum’s Downtrend May ContinueAlthough Ethereum saw a slight recovery on October 14th, it remains under significant pressure from US-China trade tensions, negatively impacting the financial markets and Ethereum’s value. The US imposing 100% tariffs on Chinese goods, along with retaliatory measures from China, has raised concerns about global economic stability. These factors have pushed ETH/USDT down to a low of $3,893.
The chart shows that Ethereum is trading within a clear downtrend channel, with $4,130 acting as a strong resistance level. After hitting this resistance, Ethereum may continue to decline towards $3,530 in the coming days if there is no positive shift in the fundamental factors.
With the market still uncertain and US-China trade tensions unresolved, Ethereum is likely to remain under downward pressure in the short term.

ETH Game Plan – FTKZ ModelETH Game Plan – FTKZ Model
📊 Market Sentiment
After the sharp 10/10 crash triggered by Trump’s 100% tariff announcement on Chinese imports, altcoins saw heavy liquidations some exceeding -80%.
On 12/10, Vice President Vance clarified Trump’s remarks, causing a temporary rebound.
However, Trump’s 15/10 statement reaffirming a trade war with China reignited selling pressure.
Sentiment remains bearish, as volatility and geopolitical risk continue to shape short-term direction.
📈 Technical Analysis
ETH maintains a bullish structure on the weekly timeframe.
If the weekly candle closes below 3350$, it would signal a potential bearish reversal.
Price is currently retracing toward the HTF Key Zone, aligning with both an FFVG and HTF trendline confluence ideal for long setups if support holds.
📘 Model to be used – FTKZ Model (HTF FFVG + Trendline + Key Zone)
1️⃣ Determine the HTF weekly trend — trade only in that direction.
2️⃣ Identify the HTF Fair Value Gap (FFVG) that price may rebalance.
3️⃣ Confirm confluence with HTF trendline support.
4️⃣ Locate the HTF Key Zone showing strong order flow.
5️⃣ Enter after LTF confirmation.
📌 Game Plan
I will be watching ETH to test the 3350$ HTF Key Zone (weekly swing liquidity & monthly FFVG).
If the weekly close forms back above 3350$, I will expect continuation toward higher levels.
🎯 Setup Trigger
Weekly close above 3350$ confirming bullish continuation.
📋 Trade Management
Stoploss: Weekly close below 3350$
Targets: TP1: 4300$ | TP2: Bearish Trendline
Move stoploss to breakeven after TP1 hits.
💬 Like, follow, and comment if this breakdown supports your trading! More setups and market insights coming soon — stay connected!
⚠️ Disclaimer: This content is for informational and educational purposes only and does not constitute financial, investment, or trading advice. Always DYOR before making any financial decisions.

ETH/USDT Long Setup – Demand Zone BounceHi Everyone,
Ethereum is sitting just above the $4,000 support after bouncing from the $3,500–$4,000 demand zone and reclaiming the 20W EMA. As long as price holds this level, I’m looking for continuation to the upside.
My target for this trade is $5300,
A break back below $3,500 would invalidate this setup, however I have my stop loss priced at $3200.
Simple plan: hold above demand, ride it higher.
I believe this trade will hit target within 2-4 weeks.

ETH/USDT 4H chart review📉 Main trend (short-term)
• The price is below the black downtrend line, which means sellers are dominating.
• There is an attempt to break out above the trendline, but there is no continuation - i.e. a false breakout (so-called "bull trap").
⸻
🔴 Key support and resistance levels
• Resistances:
• 4,252 USDT – local resistance, the limit of the previous rebound.
• 4,471 USDT – strong resistance, earlier peak after breakout.
• 4,750 USDT – main resistance from a higher interval (possible target after a trend change).
• Support:
• 3,963 USDT – current price level, acts as local support.
• 3,763 USDT – next strong support, confirmed by the previous rebound.
• 3,435 USDT – critical zone, bottom of the structure.
⸻
📊 RSI (oscillator)
• RSI (bottom chart) is close to the oversold zone (<30).
• This means that the market is overloaded with selling and a technical rebound may occur in the short term.
⸻
🔍 Volume
• Volume decreases with subsequent declines → a sign of supply fatigue.
• This may suggest that a local bottom is approaching and a possible corrective move upwards.
⸻
📈 Scenarios
✅ Bull scenario
• If ETH stays above USDT 3,960-3,970, there may be a rebound to:
👉 USDT 4,250-4,470 (first target).
• Confirmation: a candle closing above the black trend line.
❌ Bear scenario
• If the price drops below USDT 3,960 and stays there for 4H,
next drop target is:
👉 3,760 USDT, and in the event of a breakout – 3,435 USDT.

#ETHUSDT: Currently On The Way Towards Filling The FVG?ETCUSDT is currently experiencing a significant correction as the price approaches a pivotal juncture where a substantial bullish price reversal is anticipated, potentially propelling it to new all-time highs or even surpassing them. It is imperative to exercise meticulous risk management and conduct your own thorough analysis before engaging in any cryptocurrency trading or investment activities.
Should the price indeed undergo a major correction, it is likely to decline to our second designated area, where it is anticipated to fill the liquidity gap and subsequently reverse course, continuing its trajectory towards our established targets.
Please consider this analysis as a secondary influence only, or even solely for educational purposes. It is crucial to conduct your own independent analysis and risk management prior to engaging in any cryptocurrency trading or investment endeavours, as they inherently carry substantial financial risks.
We extend our best wishes and encourage you to trade safely and responsibly.
Should you wish to demonstrate your support, you are welcome to express your appreciation through likes, comments, or sharing this information.
Thank you for your consideration.
Have a pleasant weekend.
Team Setupsfx_
