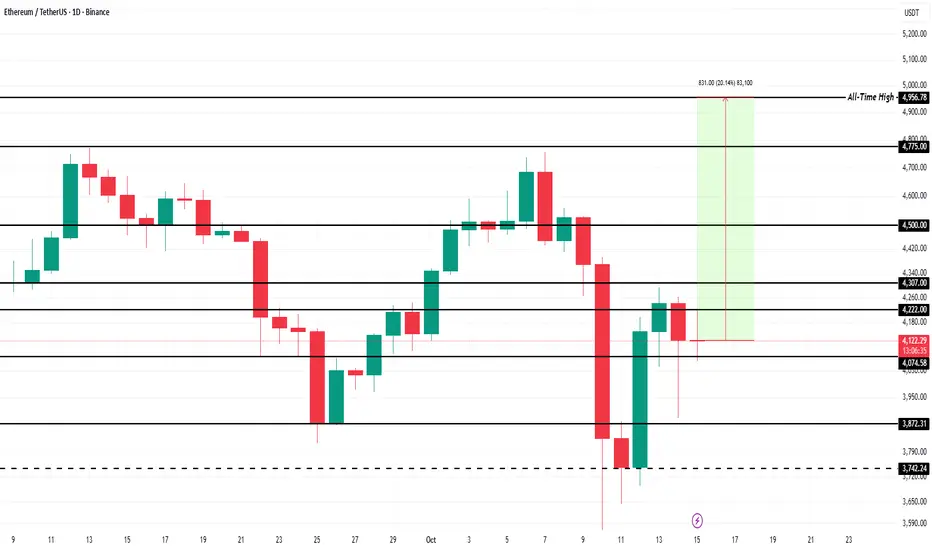
Ethereum’s Path to $5,000 Likely Blocked by LTH ActionsEthereum is currently priced at $4,147, trading just below the key $4,222 resistance level. A successful breach of this barrier could enable ETH to climb toward $4,500. This would attract stronger inflows from institutional and retail investors alike.
If accumulation strengthens and confidence returns, Ethereum could advance toward $4,956 — its previous all-time high — and potentially touch $5,000. This would represent a decisive signal of market recovery and renewed bullish momentum.
However, if bearish sentiment grows or long-term holders continue offloading their holdings, Ethereum could slip below $4,000. A deeper correction could pull the price down to $3,872 or lower, invalidating the bullish thesis and signaling renewed selling pressure in the market.
Trade ideas
ETH - MONTHLY DOJI - UPDATE:#ETH - price analysis: Tricky times Ahdea? 📊
Global Structure (Long-Term View):
🔸The chart remains bullish above the $ 3,180 level (monthly view). 📈
🔸That said, prices are stuck under a potential double-top ATH resistance at 4,800– 4,950. ⚠️
🔸Monthly High: $ 4,755
🔸Monthly Low: $ 3,435
🔸Current price is showing a Doji candle on both monthly and weekly charts, sitting exactly in the middle range from low to high. Neutral vibes for now! 🤔
Daily View:
Price is holding above the previous key resistance zone of 3,700 - 3,750.
Upper Key Resistances to Watch:
$ 4,300 - $ 4,540 - $ 4,75 - $ 4,950
What to Expect (Medium-Term Outlook):
We're in a sideways phase within the yellow zone: 4,250– 3,700, until a real breakout happens.
If bulls keep consolidating above $ 3,180, an upward move seems likely.
Tricky moment-there's literally no clear long-term or medium-term direction right now.
I've highlighted key levels and possible setups in my charts below. #DYOR
In case of a bad market event and bearish breakout, 2,850 and 2,500 could act as key bottoms.
My Take: This feels like a consolidation trap, bulls or bears, who's winning?
Share your thoughts below!
Bullish rebound or more downside? 👇
Key levels, yellow zone, and Doji highlights in my charts.

Ethereum 1H Analysis – Key Battle at $4,278 Resistance | D1👋 Hey everyone! Hope you’re doing great!
💥 Welcome to Satoshi Frame — today we’re diving into the 1-hour Bitcoin analysis. Stay tuned and follow along!
👀 1-hour timeframe of Ethereum, and we can see that Ethereum, after the heavy drop it experienced, broke down from the 4278$ area and moved toward its lower support levels. A major support level has formed around the 3692$ area, where we saw strong buyer support, and they pushed the Ethereum price upward. After the upward movement and buyer support, as Ethereum approached its resistance in the 4278$ area, the buying volume decreased, and then buyers’ strength ended. Sellers, with strong momentum and multiple red candles, pushed the price down toward the 3941$ support, where the price was supported again. Now a higher low has formed compared to the 3941$ bottom, and the price is moving toward its key resistance area at 4278$.
🧮 We can see in the RSI oscillator that there is a key level around 70, which is the OverBuy boundary. If the fluctuation limit passes this area, Ethereum can break its resistance around 4278$.
🕯 Regarding volume, there is an educational note that when the price approached the 4278$ resistance, it faced a decrease in buying volume and was rejected from this area with many red candles. Now that the price is moving toward this resistance, if it is accompanied by an increase in buying volume, it increases the probability of breaking this resistance for us.
🧠 For the Ethereum position, a breakout of the 4278$ area is needed, and now if the price moves toward this area, it will form our second touch and create several scenarios for us.
↗️ First scenario for long position: breakout of resistance accompanied by an increase in volume and setting the trigger at 4278$, which gives us a large stop size and reaches its risk-to-reward ratio later.
↗️ Second scenario for long position: wait for the price to have a reaction to the 4278$ area and then create a higher high and higher low for us, and we can enter on the created higher low and place our stop below that same low.
❤️ Disclaimer : This analysis is purely based on my personal opinion and I only trade if the stated triggers are activated .

ETH-USDTThere is a major downtrend line that has intersected with a static breakout 📣
If the 4200 number is broken
a new lag will start for it 🚀💰💎

BTC here is the both of my opiniones
first off all i'm bullish , i dont think that we are on the end bullrun but i definitely know this is will be the last wave of the bullrun + altseson.
now in the graph your guys can see that we get big shakeout that cunfused every body in the market , pepole got 100% liquidation
in the hourly RSI i can see that we are oversold and i think we gonna take the last low soon
so basicly we can get reaction from 2 areas
the fisrt opinion we'll go to the area between 118,000-119,000 and go down to make lower wick under the last wick 101,500 to the area of 94,000-96,000and RSI diverge .
the second opinion its go directly to the area of 94,000-96,000 and than go uo to the next station 137,000-144,000
if the wave will be more agressive i'll say even 158,000.
for now i'm out side and i wanna se what process we gonna see , on the daily chart we are on phase C.

Possible bear-ish channel incoming.We should have some confirmation in our next candle to determine if we are entering another bear cycle. After multiple rejection on the 0.618 level, I had discovered a possible down trend channel that can take us down to the 39xx.
bear scenario
If the market remain bear in the next 2 weeks, the ultra bear target would be between the 3600-3700 range. (corrective wave 5 going down)
bull secnario
This bear wave going down maybe retest the 0.382 level on chart then go up and start a sub wave 3 going up, which turns my 12345 within Wave 5 on going down assumption into an ABCDE down wave that is part of the big wave 4 structure in the 4-hr time frame, which means we are in a sub structure of wave 5 in the 4HR+ time frame.

0.618 rejected 4 times, what's next? What a ride ETH has been, but the invisible wall at 0.618 fib is keeping us down. Can we finally break to the top at the 4th attempt? I am waiting for some kind of Wave 3 to happen.
I hope we don't get stuck in a consolidation phase.

15-10-2025As shown in the figure: 1D Bullish Bat
The market is not always chaotic and disorderly, and there is a precise geometric beauty hidden in price fluctuations. The harmonic form long strategy is a powerful tool for accurately identifying potential market reversal points based on the Fibonacci ratio. When the form forms perfectly at the key support level, it often indicates the depletion of bearish momentum and the initiation of bullish trends.

ETH LONGAfter a large crash that hit crypto on friday clearing the assets and leaving people without positions this looks good to long into the equal highs above, we respecting bullish PD arrays so far and have received good reaction from the discount

Volatility Period: October 16 (October 15-17)
Hello, traders!
Follow us to get the latest information quickly.
Have a great day!
-------------------------------------
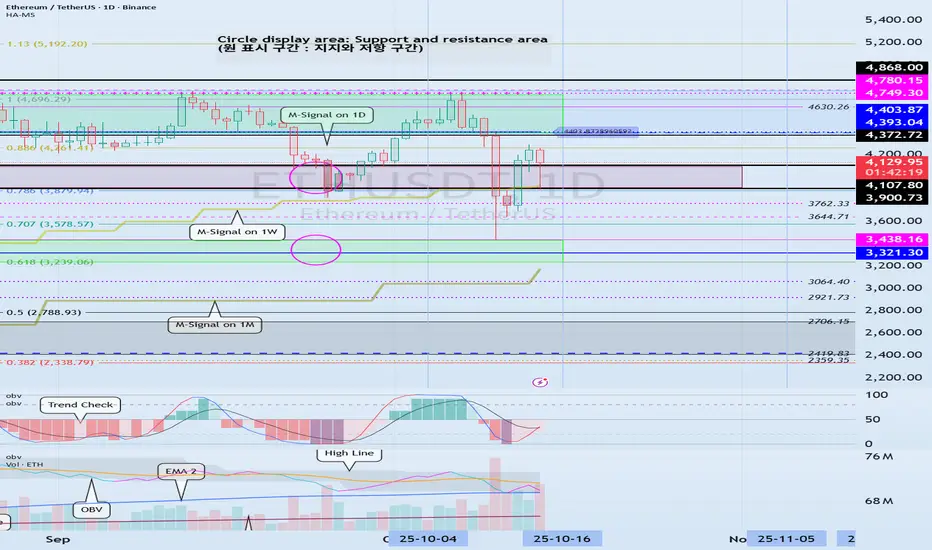
(ETHUSDT 1D Chart)
Following BTC, ETH is also entering a volatility period.
This period of volatility for ETH is expected to last until October 16th (October 15th-17th).
After this period of volatility, the key question is whether the price can find support around 3900.72-4372.72 and rise above 4403.87 to maintain its price.
If the price fails to rise, it is expected to encounter the M-Signal indicator on the 1M chart, so a response plan should be considered.
-
(1M chart)
The StochRSI indicator on the 1M chart is entering an overbought zone, potentially limiting its upward movement.
Therefore,
1st: 3900.73-4107.80
2nd: 3321.30-3438.16
We need to determine whether the price can rise after finding support near the 1st and 2nd levels above.
In other words, we need to see if the price remains above the M-Siganl indicator on the 1M chart.
-
(1W chart)
Looking at the 1W chart, the HA-High ~ DOM (60) range is formed in the 4393.04-4780.15 range. Therefore, a rise above this range is necessary for a stepwise uptrend.
Ultimately, the key question is whether the price can rise above the 4393.04-4780.15 range.
----------------------------------
Therefore, the key question is whether the 4393.04-4780.15 range, which corresponds to the HA-High ~ DOM(60) range on the 1W and 1D charts, can rise after this period of volatility.
As I always say, to break above this important point or range and continue the uptrend,
1. The StochRSI indicator must be trending upward. If possible, it's best to avoid entering the overbought zone.
2. The On-By-Sign-Observable (OBV) indicator must be trending upward. If possible, it should remain above the High Line.
3. The TC (Trend Check) indicator must be trending upward. If possible, it should remain above the 0 level.
If the above conditions are met, the uptrend is likely to continue.
It's recommended to draw support and resistance points or ranges on the 1M, 1W, and 1D charts and utilize auxiliary indicators to determine the significance of these points or ranges.
When drawing support and resistance points or zones, we often think of them as important, but it can be difficult to recognize how important they actually are.
Therefore, when drawing support and resistance points or zones, it's important to be able to develop a basic trading strategy.
Once you've established a basic trading strategy, the key to trading is figuring out how to maintain that strategy and respond accordingly.
No matter what chart analysis you use, you'll ultimately need to draw support and resistance points or zones.
Therefore, the first step is to draw support and resistance points or zones on the 1M, 1W, and 1D charts.
Next, you should check auxiliary indicators to determine the importance of the drawn support and resistance points or zones and determine whether you should respond.
To achieve this, you need to understand your investment size and how to manage your reserve funds.
You should always keep a certain portion (approximately 20%) of your total investment in cash.
This allows you to respond to volatility when it occurs.
If you've invested too much money in a single coin (token, stock), it's a good idea to sell some of it when the price rises to a certain level and secure cash.
Ultimately, overcoming the relentless volatility of the beginning and achieving profit depends on how you manage your funds.
-
Thank you for reading to the end.
I wish you successful trading.
--------------------------------------------------
The most hated rally on ETH incoming? Hello traders,
A really strong setup in the makes for ETH. Not financial advice :)
I woul love to take a loss on these structures.
Max pain is on the upside after the horror has been taken place.
Trade safe

ETH/USD Bearish Retracement from Daily FVG Zonea bearish retracement setup on Ethereum (ETH/USDT) in the daily timeframe. After a strong bearish impulse, the price entered a highlighted Daily Fair Value Gap (FVG) zone — a potential area of supply where sellers may regain control. The projection indicates a likely short-term pullback into the FVG before continuing downward toward Target 1 (≈ $3,601) and Target 2 (≈ $3,399).

ETHUSDT — RMBS Momentum Setup near $4000 SupportAfter the previous bearish phase (~–5 %), RMBS Smart Detector is now showing a momentum setup at the $4 000 support zone.
Current metrics → RMBS = 4.7 | ADX = 33 | AHOW = ACTIVE → indicating improving trend strength and directional momentum.
If pressure holds above this support, a technical reaction toward the 4 200 –4250 region remains a possible scenario (educational purpose only, not financial advice).
#TradingView #ETH #RMBS #MomentumTrading #PineScript

Is my Wave 1 too short? a 5th wave is coming? Are we starting C?I am very neutral on ETH, I thought 5 waves were done last night where the Wave 3 ended on my chart. But today, I see a possibility that the 5 waves was really end of wave 3, and we may have a 5th wave coming before the drop.
If you zoom out further, u can also see this current structure is a lot like a wave 4 that's going up, and the 12345 in my chart would be ABCDE.
I am staying put for the time being.
if 5th ended where 3 is on my chart, then the Fib 0.236 (4138.38 level) might be end of a Wave B before the Wave C starting

ETHUSDT STRCTUREETH/USDT is currently trading within a defined range between two key levels of support and resistance.
In the short term, we could see a correction or consolidation toward the resistance level as the market awaits a potential breakout pattern.
If the support holds and the price shows a positive reaction followed by a breakout above the trendline, Ethereum could begin forming a new bullish wave, targeting the next resistance zone around 52,50.
"Thank you for your support! If you found this idea valuable or learned something new, please consider liking and leaving a comment. I’d really appreciate hearing your feedback and thoughts."

ETH – Key Scenarios #ETH – Key Scenarios
Current price: $3,913
Ethereum remains inside a corrective structure following rejection near $4,250–$4,300.
The chart outlines three potential paths — continuation, consolidation, or deeper correction.
Technical Context
• ETH lost momentum after failing to break above the prior swing high near $4,300.
• Price action remains guided by a descending channel, while short-term volatility spikes around macro events.
• The mid-term structure depends on whether ETH can break above this channel or remain trapped within it.
1️⃣ Bullish Continuation (White / Cyan Path)
• Structure: Impulse wave 1–2–3–4–5 forming a new major wave (3).
• Confirmation: breakout above $4,200–$4,300, supported by high volume.
• Targets:
– Wave 3 ≈ $4,700–$4,900
– Extended 5th ≈ $5,200+
• Invalidation: daily close below $3,700.
• Probability: Moderate–High, if risk appetite returns and BTC leads the rally.
2️⃣ Extended ABC Correction (Orange Path)
• Structure: A–B–C correction unfolding toward lower Fibonacci retracements.
• Key levels:
– Wave A ≈ $3,600
– Wave B bounce ≈ $3,900–$4,000
– Wave C ≈ $2,800–$2,600
• Narrative: macro tightening or BTC rejection near resistance.
• Probability: Moderate, especially if liquidity contracts or sentiment weakens.
3️⃣ Channel Consolidation / Range Scenario (Gray Path)
• Structure: price remains within the descending channel, oscillating between support and resistance.
• Range:
– Upper boundary ≈ $4,200–$4,300
– Lower boundary ≈ $3,400–$3,600
• Character: prolonged sideways correction forming a triangle or complex W-X-Y pattern.
• Implications: market indecision, volatility compression before the next macro move.
• Probability: High (short-term) — typical after sharp drops and in anticipation of new catalysts.
🧭 Summary
• ETH is currently consolidating inside a descending channel, forming a decision point for Q4.
• Three paths remain open:
- Breakout and impulsive continuation above $4,300.
- Range-bound sideways phase within the channel.
- Full ABC correction toward $2.8K–$2.6K.
Trend bias: Neutral-bullish while above $3,700, turning bearish on a confirmed channel breakdown.

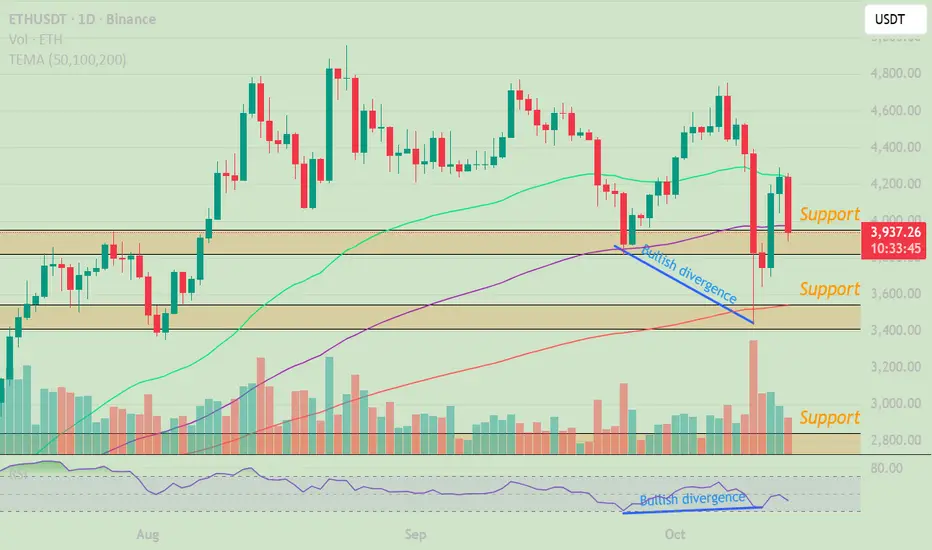
$ETH showing a bullish divergence on the daily timeframe.CRYPTOCAP:ETH daily chart: Despite the bearish tone, a bullish divergence is forming. A proper bounce seems inevitable, just a matter of time.
Is the bottom in at $3,800 or $3,500? You tell me.
COINBASE:ETHUSD BINANCE:ETHUSDT BITSTAMP:ETHUSD BINANCE:ETHUSD
ETH : BUY OR SELL ?Hello friends
Given the good decline we had, there was a good opportunity to buy at good prices with capital and risk management and in steps and move towards the specified goals.
*Trade safely with us*

#ETHUSDT Daily Chart
Price got rejected off the EMAs and it is currently close to tapping into our 12h demand at $3,800. MACD is bearish, RSI is sold and EMAs are neutral. Price needs to tap and bounce off this demand zone in order to expect further bullish movements.

Ethereum Teknik Analizi / Ethereum Technical Analysis🇬🇧 English Explanation:
🚀 Bullish breakout or liquidity hunt? Key highlights from the chart:
🔼 Higher Highs and 🔽 Higher Lows suggest a continuation of the uptrend.
📏 Fibonacci levels mark critical zones:
0.618: 3848.00
0.535: 3945.00
1.414: 4053.57
📈 Red and green moving averages (MA) support the current price structure.
🔵 The blue projected path outlines a bullish scenario.
💥 The colored horizontal lines represent liquidity zones. Price may bounce from these areas. However, it's uncertain how much liquidity will be collected and whether price will reverse direction from these zones.
📌 Keep an eye on support and resistance levels. 💡 This is not financial advice—purely for analysis purposes.
✨ #Ethereum #ETHUSDT #CryptoAnalysis #TradingView #LiquidityZones #Fibonacci #TechnicalAnalysis #BullishOrTrap

ETH LONG SETUP 30mPrice has tapped into a key demand zone after a strong sell-off.
Current structure shows potential for a relief bounce toward upper liquidity zones.
Entry: Around current price (~3920-3940)
Stop Loss: Below 3580 zone (recent swing low)
Target Zones: 4200 → 4315 → 4520
R:R: ~3.5 : 1
⚠️ Waiting for confirmation (bullish candle close or volume pickup) before executing.
If the zone fails to hold, next downside liquidity lies around 3600-3700.

DeGRAM | ETHUSD above the $4000 level📊 Technical Analysis
● ETH/USD is holding above dynamic support near 3,870 after a deep pullback, forming a structure of higher lows that signals potential recovery.
● Price aims toward 4,300 as it approaches dynamic resistance; a breakout could extend toward the 4,880 level within the medium-term bullish channel.
💡 Fundamental Analysis
● Ethereum sentiment improves amid rising network activity and positive institutional flows into ETH-based ETFs.
✨ Summary
● Long bias above 3,870; targets 4,300–4,880. Technical rebound aligns with strengthening on-chain and macro sentiment.
-------------------
Share your opinion in the comments and support the idea with a like. Thanks for your support!

ETHUSDTHello Traders! 👋
What are your thoughts on Ethereum?
Ethereum is currently trading between two major zones of support and resistance.
In this range, we expect a short-term correction toward the ascending trendline, followed by some consolidation before a potential breakout above the resistance zone.
If the support holds, followed by a positive reaction from the trendline and a breakout above the resistance level, Ethereum is expected to begin a new bullish wave and move higher toward the identified target levels.
If a daily candle closes below $3,500, this bullish scenario will be invalidated and a deeper correction could follow.
Don’t forget to like and share your thoughts in the comments! ❤️
