nearing top of bull market for ETHseems like we're nearing the top of the bull market for ETH, if you still feel like you wanna take the risk of entering the market with new positions, 3.5-4k seems like a risky buying range, and selling would be around 5.5-6.5k
Trade ideas

ETH at Critical Support: Can $3,850 Hold?CRYPTOCAP:ETH has faced a sharp rejection from the supply zone around $4,800 and is currently trading near $4,100. There's another strong support zone around $3,850.
I'm personally expecting a sharp rebound from this level. However, if the price fails to hold, we could see a further decline towards $3,600.
DYOR, NFA

[SeoVereign] ETHEREUM BEARISH Outlook – October 05, 2025Hello everyone.
I hope you are all having a peaceful day.
Today, I am writing to share my short position perspective on Ethereum as of October 5th.
The first basis is the 1.13 Alternate Bat (ALT BAT). The Alternate Bat is a variation of the harmonic pattern established by Scott Carney, and its core principle lies in defining the PRZ (Potential Reversal Zone) where point D is located at 1.13 times the XA leg (=1.13XA). The convergence of these ratios creates a relatively narrow and reliable retracement (or reversal) zone, so when D is positioned around 1.13XA, it is necessary to carefully observe the potential for a short- or mid-term reversal.
The second basis is that an arbitrary wave N forms a 0.618 length ratio (that is, N ≒ 0.618 × M) with another arbitrary wave M. Among Fibonacci ratios, 0.618 (61.8%) is one of the representative standards used in Elliott Wave and harmonic analyses for measuring wave length and retracement. When one wave exhibits approximately 61.8% of another’s length, that point tends to act as a natural retracement or termination zone, and the reliability increases especially when it overlaps with other technical grounds.
Accordingly, the average target price is set around 4,415 USDT.
As the chart movement unfolds, I will provide updates on position management through revisions to this idea.
Thank you for reading.

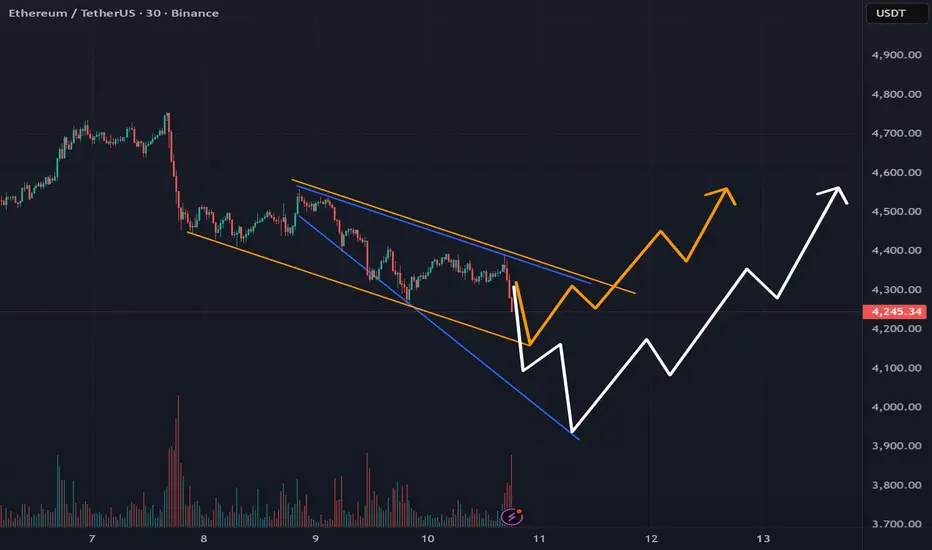
ETH forms two bullish patternsETH is forming two local bullish patterns within a global descending corridor, which could later develop into a bullish flag pattern
Current price: $4,329
If both patterns are broken, as their upper borders are at the same level, a price breakout to $4,389 , $4,460 , and $4,555 is likely
The price could also fall to $4,159 and $3,939 within these patterns
If the second lower border is broken, both patterns will be broken, and the price could go lower
ETH Market Structure — Multi-Timeframe OverviewETH is coiling after a strong impulse; higher-highs and higher-lows remain intact. We map the paths, define the sweep zones, and let price confirm. When a condition is met, we decide based on live LTF confluence (15–60m PA, CVD, funding, OI) and post signals in real time for precision.
1W
• Holds near 4.37k after an impulsive ≈2.9k → 4.8k leg.
• Weekly structure bullish (clean HH–HL).
• 4.1–4.2k = first structural defense before next markup.
2D
• Compression between 4.15–4.75k.
• Reclaim > 4.75k → continuation toward 5.0–5.2k liquidity pocket.
• Close < 4.1k → deeper pullback to ≈3.8k mid-range.
• Declining volume = equilibrium before the next impulse.
12H
• Local sweep of 4.6–4.7k highs met rejection with soft OI unwind.
• Short-term structure mildly corrective inside the larger bullish leg.
• POC ≈ 4.37k acts as a magnet.
📈 Orderflow / Derivatives (Binance + Bybit)
• POC: ≈ 4.35k
• OI: ≈ $27B, flat — no cascade risk
• Funding: +0.01–0.02% (neutral/slightly positive)
• CVD: spot bids absorbing shorts
• Liquidation clusters: < 4.25k and > 4.75k
• 3-mo basis: 5.5% → 4.8% — healthy cool-off
⚔️ Sweep Zones / Execution Boxes
🔶 Resistance Sweep Zone — 4.72k → 4.85k
• Liquidity from equal highs + weekly wick confluence.
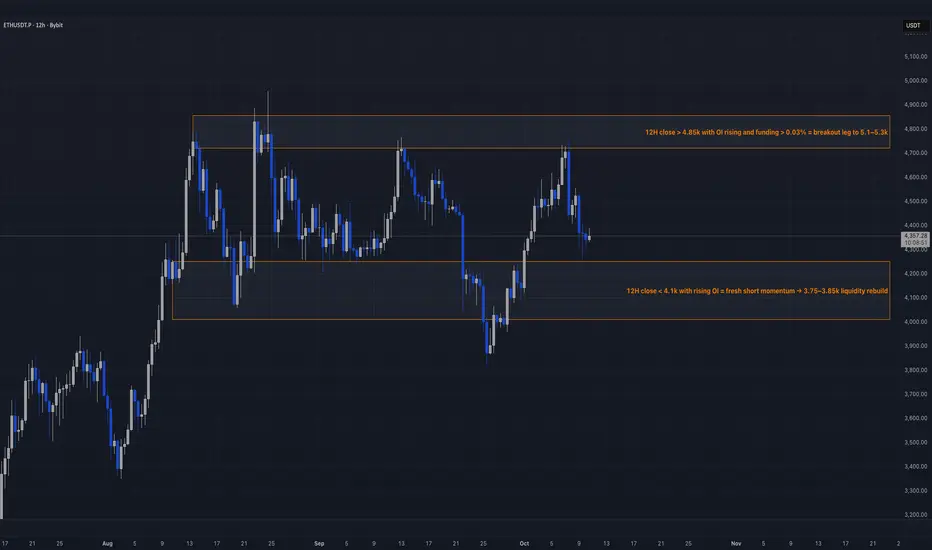
• 12H close > 4.85k with OI rising and funding > 0.03% = breakout leg to 5.1–5.3k.
• Fast rejection + OI drop = short scalp reversion → 4.35k POC.
🟩 Support Sweep Zone — 4.10k → 4.25k
• Last bullish OB + visible footprint POC.
• 12H close < 4.1k with rising OI = fresh short momentum → 3.75–3.85k liquidity rebuild.
• Hold + delta absorption = reload zone → 4.7k target.
⚫ Deep Liquidity Zone — 3.70k → 3.85k
• Macro support shelf + monthly FVG fill.
• Failure here = macro structure shift → risk toward ≈3.3k.
🧭 Two-Path Playbook
Bullish IF: HTF acceptance > 4.75k (breakout confirmation if 12H > 4.85k with OI↑ & funding > 0.03%) → 5.1–5.3k.
Bearish IF: 12H < 4.1k with OI↑ (fresh shorts) → 3.75–3.85k liquidity rebuild.
Context note: ETHBTC ≈ 0.0358 stabilizing after a multi-month downtrend → green shoots for ETH-ecosystem rotation if BTC.D < 60% persists.
We post signals only when triggers actually fire, using live lower-timeframe confirmation for reliability and precision.
#ETH 1D📊 **Ethereum Daily Analysis (ETH/USDT)**
The price is consolidating inside a symmetrical triangle, showing strong signs of a major breakout.
I’m watching this pattern closely — once the resistance is broken and the price retests the breakout zone, a strong bullish rally could follow.
📈 **Scenario:**
- Entry: Around the breakout of the triangle (~$4400)
- Target: $5800 - $5900 zone
- Stop Loss: Below the trendline support (~$3800)
RSI is recovering from mid-levels, and EMA200 is acting as a strong dynamic support — both suggesting bullish momentum might accelerate soon.
⚠️ *Watch out for a potential fake breakout before confirmation. A successful retest could provide a high R:R trade opportunity.*
Do you agree with this setup? Share your thoughts below 👇

Ethereum is reaching a critical resistance level where risk incrEthereum is approaching a decisive zone. A breakout above $4,780 could trigger a brief rally before a correction phase, allowing $4,780 to act as a new support level. From there, the next upside target would be around $5,100. However, if the price fails to hold and breaks below the channel support — specifically under $4,750 — bearish momentum could take over, opening short opportunities toward $4,350 and $4,000.

ETH : analysis of the main timeframes!Hi😊
Today we'll be analyzing the ETH USDT trading pair.
We'll start with the higher timeframe and move on to the lower one.
Let's start with the daily chart: after breaking the high, the price continued to trade sideways.
The IMB was tested from below, which responded and sent the price into a correction toward the downward wave.
After the local liquidity drain, the price showed bearish aggression.
Nearest support zone $4 332 - $4 245
1h timeframe: the price is showing a corrective movement, and has identified zones above from which a reaction to a further decline may occur
15m timeframe: there is a buildup of local liquidity for asset growth and price delivery to nearby problem areas
Leave your reactions and comments if you like these short reviews

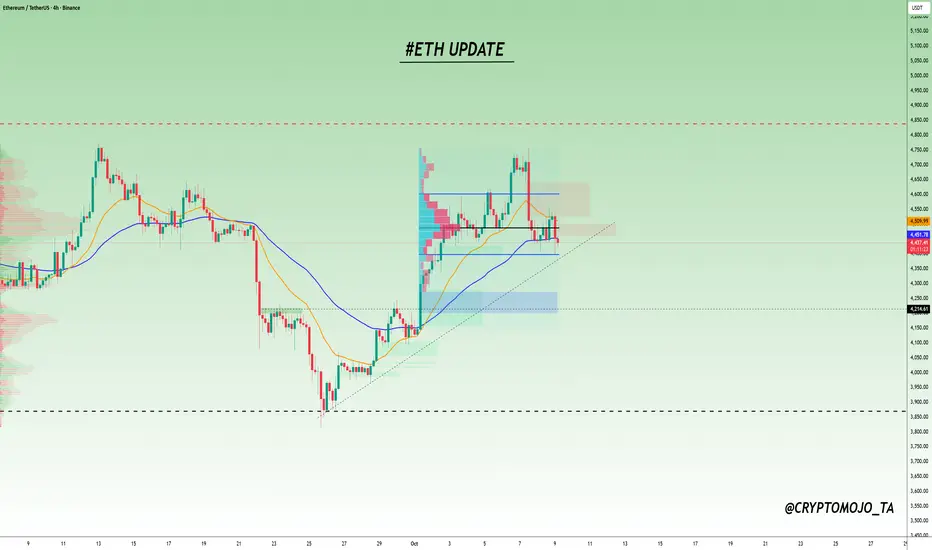
$ETH Update !!CRYPTOCAP:ETH Update
#Ethereum is facing significant resistance between $4,450 and $4,550. After rejecting the recent local highs, it’s currently holding the 55 EMA (green) as short-term support. However, it’s getting squeezed between the 21 EMA (yellow) above and a high-volume node on the Volume Profile, which acts as a heavy liquidity zone.
If ETH fails to reclaim the high-volume node and starts closing below the 55 EMA, we might see further downside towards the $4,200 support area.
ETH has already broken structure to the downside, showing weakness. If price closes below $4,397 (Value Area Low of the current range), we could see a continuation toward the $4,200 bullish FVG zone.
Key Levels to Watch:
Resistance: $4,450–$4,550
Support: $4,250
A break below $4,397 confirms more downside toward $4,200.
CRYPTOCAP:ETH BITSTAMP:ETHUSD BINANCE:ETHUSDT
ETHUSDT 1H - Key Liquidity Zones & Bullish Reversal Potential ETHUSDT 1H Analysis: Price is reacting from a critical support zone between the Fib 0.5 - 0.618 retracement and previous day low, both marked as high-liquidity areas. If current support holds, expect a potential bounce targeting the previous day’s high ($4,530.80), with further upside toward the buy side liquidity at $4,748.04. Watch for confirmation in the highlighted demand zone for low-risk long setups. A break below $4,143.60 would invalidate this scenario and shift focus to lower sell side liquidity.”
This chart setup is useful for traders seeking possible long opportunities, with clearly defined risk and upside targets.

ETH Forming a Bullish Reversal – Inverse Head & Shoulders on 1D!#Ethereum is showing a strong bullish setup on the daily time frame, forming a clean Inverse Head and Shoulders pattern — a classic sign of trend reversal.
Trade Plans:
1️⃣ Spot Trade:
Entry: Current Market Price (CMP) looks ideal for accumulation.
Stop Loss: Just below the “Head” of the pattern.
Target: Wait for the full pattern completion to reach the final TP zone.
2️⃣ Futures Trade:
Wait for a confirmed breakout above the neckline.
Enter a long position with proper risk management.
Aim for the final TP once the breakout is validated.
This setup is one of the most reliable bullish formations — if #ETH breaks the neckline with strong volume, it could trigger a powerful upside rally.
Let’s see if the bulls take control!
Drop your thoughts below
Do you think #ETH will break the neckline soon?
#ETH #Ethereum #Crypto #ETHUSD #ETHAnalysis #TradingView #TechnicalAnalysis #BullishSetup #CryptoTrading #PriceAction #InverseHeadAndShoulders

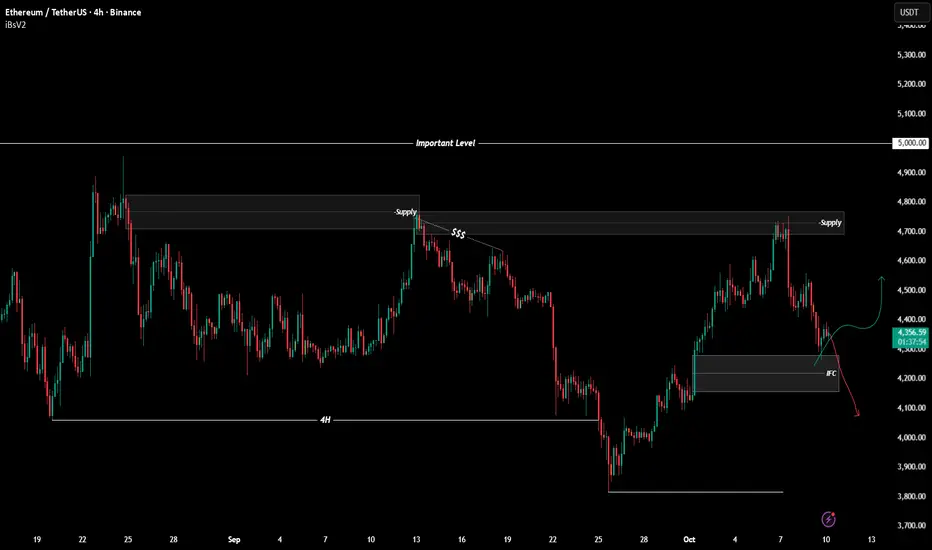
$ETHUSDT Analysis - Oct 10 | 4H Time FrameBINANCE:ETHUSDT Analysis - 4H
Hello and welcome to another analysis from the Satoshi Frame team!
I’m Abolfazl, and today we’re going to analyze Ethereum on the 4-hour timeframe.
After rejecting from the supply zone, Ethereum has reached an IFC, which could cause a price pullback.
On the 15-minute timeframe, look for confirmation signals to enter a long position — the first target is around $4,520, followed by $4,750.
Keep in mind that this setup is very risky, and no entry should be taken without proper confirmation.
The second scenario is a break below $4,200, which could provide a short opportunity targeting $3,950, and then the 4H low. (The break must be confirmed by a full candle close, not just a shadow.)
These scenarios allow you to align with price movement in both directions — the key is to wait for precise confirmations before entering any trade.
See you in the next analyses!
Stay tuned with the Satoshi Frame team...
U.S. Federal Reserve Policy and Interest RatesThe Backbone of Global Economic Stability.
Introduction
The United States Federal Reserve (commonly known as the Fed) stands as one of the most influential institutions in the global financial system. Its policies, particularly regarding interest rates, have far-reaching consequences — not only for the U.S. economy but also for financial markets, currencies, trade flows, and economic stability across the world. The Fed’s ability to adjust interest rates and implement monetary policies allows it to control inflation, influence employment levels, and stabilize economic growth.
In this essay, we will explore in detail the evolution, mechanisms, tools, and impacts of the Federal Reserve’s policy decisions, with a special focus on interest rates — their role, rationale, and implications for both domestic and international economies.
1. The Role and Structure of the U.S. Federal Reserve
The Federal Reserve System was established in 1913 through the Federal Reserve Act, in response to recurring financial panics and instability in the U.S. banking system. Its primary mission is to promote a stable monetary and financial environment.
The Fed operates through three key entities:
The Board of Governors – Located in Washington, D.C., consisting of seven members appointed by the President and confirmed by the Senate.
Twelve Regional Federal Reserve Banks – These regional banks represent different districts and carry out the Fed’s policies locally.
The Federal Open Market Committee (FOMC) – Comprising the Board of Governors and five Reserve Bank presidents, this committee is the primary decision-making body for setting interest rates and implementing monetary policy.
The Fed’s dual mandate is to achieve:
Maximum employment, and
Stable prices (low and predictable inflation).
In addition, the Fed seeks to moderate long-term interest rates and maintain the stability of the financial system.
2. The Tools of Federal Reserve Monetary Policy
To achieve its goals, the Federal Reserve uses several key tools:
a. Open Market Operations (OMO)
This is the primary tool for controlling short-term interest rates. The Fed buys or sells government securities (like U.S. Treasury bonds) in the open market.
Buying securities increases money supply, lowers interest rates, and stimulates economic activity.
Selling securities decreases money supply, raises interest rates, and curbs inflationary pressure.
b. The Discount Rate
This is the interest rate the Fed charges commercial banks for short-term loans through its discount window. Lowering this rate encourages banks to borrow more and lend to businesses and consumers, while increasing it discourages lending and cools the economy.
c. Reserve Requirements
This refers to the percentage of deposits that banks must hold as reserves. Lowering reserve requirements increases available funds for lending, boosting liquidity and credit growth. Raising them does the opposite, restricting credit.
d. Interest on Reserve Balances (IORB)
The Fed pays interest on reserves that banks hold at the central bank. Adjusting this rate influences how much banks lend versus how much they keep in reserves, indirectly impacting money supply.
e. Quantitative Easing (QE) and Tightening (QT)
In extraordinary circumstances, such as the 2008 financial crisis or the 2020 pandemic, the Fed uses QE to purchase long-term securities, injecting liquidity into the economy. Conversely, Quantitative Tightening (QT) involves selling assets or allowing them to mature to reduce liquidity and combat inflation.
3. Interest Rate Policy: The Core of Monetary Control
Interest rates lie at the heart of the Federal Reserve’s monetary policy. The Federal Funds Rate — the rate at which banks lend reserves to each other overnight — is the most critical benchmark.
When the Fed changes the target range for this rate, it indirectly affects:
Consumer borrowing costs (credit cards, mortgages, auto loans),
Business investment decisions,
Government borrowing costs, and
The valuation of financial assets globally.
a. When the Fed Raises Interest Rates
Inflation Control: Higher rates make borrowing more expensive, slowing spending and investment, thereby cooling inflation.
Currency Appreciation: The U.S. dollar strengthens as higher rates attract foreign investors seeking better returns.
Stock Market Impact: Equity prices often fall due to higher discount rates and reduced profit expectations.
Global Ripples: Emerging markets may face capital outflows as investors shift to U.S. assets.
b. When the Fed Lowers Interest Rates
Stimulating Growth: Cheaper credit encourages consumption, business expansion, and investment.
Weakening of Dollar: A lower yield reduces demand for the U.S. dollar, making exports more competitive.
Boost to Financial Markets: Lower discount rates increase asset valuations, benefiting equity and bond markets.
Support During Crises: Rate cuts are often used during recessions to stimulate economic recovery.
4. Historical Perspective: Major Fed Rate Cycles
a. The Volcker Era (Late 1970s–1980s)
Inflation had surged due to oil shocks and loose monetary policy. Chairman Paul Volcker implemented drastic rate hikes, pushing the federal funds rate above 20% in 1981. This aggressive stance broke the back of inflation but triggered a short-term recession.
b. The Greenspan Era (1987–2006)
Under Alan Greenspan, the Fed emphasized gradualism and market-friendly communication. It managed crises like the 1987 stock market crash, the dot-com bubble, and early 2000s recessions through strategic rate adjustments.
c. The Bernanke and Yellen Years (2006–2018)
The 2008 Global Financial Crisis marked a shift to unconventional tools. The Fed slashed rates to near zero and launched Quantitative Easing to revive the economy. Later, under Janet Yellen, gradual normalization began.
d. The Powell Era (2018–Present)
Jerome Powell has faced extraordinary challenges: trade tensions, the COVID-19 pandemic, and post-pandemic inflation. After slashing rates to zero in 2020, the Fed initiated its most aggressive tightening cycle in decades starting in 2022 to combat inflation exceeding 9%, raising rates to over 5% by 2023.
5. Impact of Fed Interest Rate Decisions on the U.S. Economy
a. Inflation Control
Rising rates slow consumer and corporate spending, helping control inflation by cooling demand. Conversely, rate cuts stimulate demand and can raise inflation expectations.
b. Employment and Wages
As borrowing costs rise, companies may delay hiring or expansion. High rates can increase unemployment in the short run, but the Fed’s goal is to maintain long-term price stability, which supports sustainable employment.
c. Housing Market
Mortgage rates move closely with the Fed’s actions. A rate hike can significantly slow housing demand, reduce affordability, and depress home prices.
d. Business Investment
When borrowing becomes costly, companies cut capital expenditure. Sectors such as manufacturing, technology, and real estate often feel the strongest impact.
e. Consumer Behavior
Interest rate changes directly affect credit cards, auto loans, and savings yields, influencing household spending patterns and savings rates.
6. Global Implications of U.S. Interest Rate Policy
The Federal Reserve’s decisions ripple through the global economy because the U.S. dollar is the world’s dominant reserve currency.
a. Capital Flows
When U.S. rates rise, capital often flows from emerging markets to the U.S. in search of higher returns. This can weaken developing economies’ currencies and strain their debt servicing.
b. Exchange Rate Volatility
Higher U.S. yields strengthen the dollar, making imports cheaper but hurting exports. For other countries, a strong dollar raises the cost of dollar-denominated debt.
c. Commodity Prices
Commodities like oil and gold are priced in dollars. A stronger dollar typically depresses commodity prices, affecting global trade balances.
d. Global Stock Markets
U.S. rate hikes often lead to a decline in global equity valuations as risk-free yields become more attractive compared to stocks.
7. Challenges in Monetary Policy Implementation
Despite its tools and experience, the Fed faces several challenges:
a. Balancing Inflation and Growth
The dual mandate creates trade-offs. Tightening to control inflation may harm employment, while loosening to support jobs risks fueling inflation.
b. Time Lags
Monetary policy operates with delays — it can take months for rate changes to influence inflation, employment, and GDP.
c. Global Linkages
The interconnected global economy means domestic policy changes can trigger unintended international consequences, such as currency depreciation or capital flight in other nations.
d. Market Expectations
The Fed’s credibility and communication are vital. Miscommunication or unexpected decisions can cause financial volatility.
8. The Role of Forward Guidance and Communication
In modern monetary policy, communication is as powerful as action. Through forward guidance, the Fed provides information about its future policy intentions to shape market expectations.
For instance, during periods of uncertainty, clear communication can stabilize bond markets and prevent panic. Conversely, unexpected policy shifts — often referred to as “Fed shocks” — can cause sharp asset price movements.
9. The Future of Fed Policy and Interest Rates
The future of Federal Reserve policy will likely be shaped by new economic realities:
Digital Currency and Technology: The rise of digital payments and discussions on a Central Bank Digital Currency (CBDC) could redefine how monetary policy is transmitted.
Climate Risk and Sustainability: The Fed is beginning to factor climate-related risks into its analysis, recognizing their long-term economic impact.
Geopolitical Uncertainty: Global tensions, trade wars, and supply chain disruptions can complicate inflation dynamics and policy effectiveness.
Data-Driven Policy: The increasing use of real-time data and AI-driven forecasting tools will make policy more responsive and precise.
In coming years, the Fed must navigate between promoting growth and preventing inflation resurgence — a balancing act made harder by evolving global economic dynamics.
Conclusion
The U.S. Federal Reserve’s policy and interest rate decisions lie at the center of global economic stability. Through meticulous management of the federal funds rate and other instruments, the Fed influences inflation, employment, and investment patterns across the world.
While its actions are designed primarily for the U.S. economy, the ripple effects extend to every major financial center and emerging market. In an era of globalization, digital transformation, and persistent uncertainty, the Fed’s challenge is to maintain credibility, transparency, and flexibility.
Ultimately, effective Federal Reserve policy ensures not only the health of the American economy but also the broader balance of the global financial system — a responsibility that underscores its position as one of the most powerful economic institutions in the world.

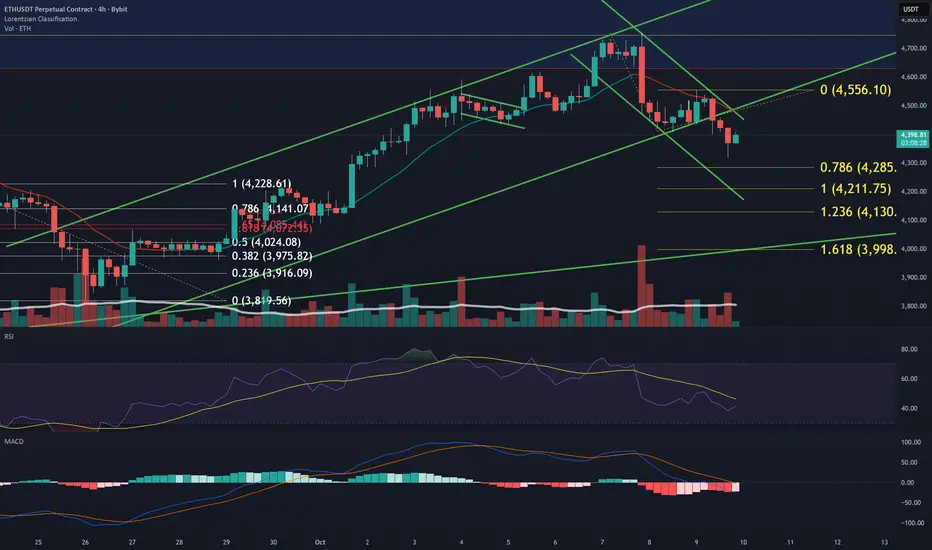
ETH Daily – Pullback After Rejection, Eyes on 0.5 FibETH Daily – Rejected at the Highs, Searching for Support
ETH was once again rejected from the ATH zone on Monday, October 6, failing to establish a breakout above resistance.
After losing the 50MA, price is now approaching the 0.5 Fibonacci retracement level at $4321, which could serve as the next key support area.
From a system perspective, the structure reads:
Price < SMA < MLR < BB Center — confirming a short-term bearish trend.
Momentum indicators also point to weakness:
RSI has crossed below its moving average, and MACD is starting to turn red.
This pullback mirrors broader market consolidation after BTC’s ATH, showing that ETH remains sensitive to overall liquidity flows.
For now, the short-term bias remains bearish unless price manages to hold the 0.5 Fib support and stabilize around it.
A close above that level would be the first sign of potential recovery.
Always take profits and manage risk.
Interaction is welcome.

Ethereum (ETH/USD) Technical Analysis - Key Levels and TrendsThis chart analyzes Ethereum's price action on the timeframe using TradingView. Key support levels are identified at , with resistance at . The chart highlights showing signals. Potential breakout or reversal zones are marked, with volume trends indicating momentum. Watch for for confirmation of the next move. Always manage risk and stay updated with market news.

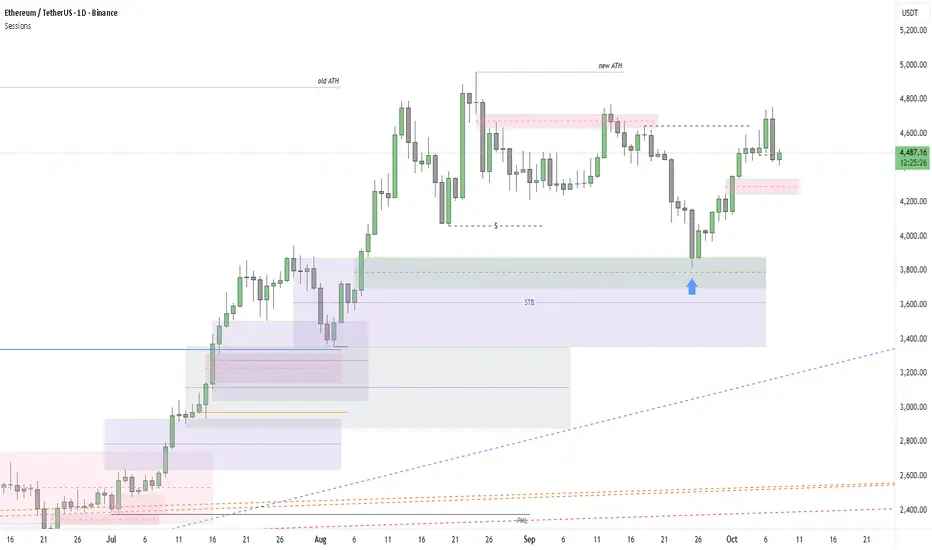
ETH Game Plan – DLRMD ModelETH Game Plan – DLRMD Model
📊 Market Sentiment
The FED has resumed its rate-cutting cycle with a 0.25% cut in September and two more expected in the coming months. Institutional liquidity inflows are accelerating as the U.S. officially adopts crypto as part of its reserves. While inflation remains elevated, a weakening labor market is pushing the FED to ease, channeling more capital into risk-on assets such as crypto.
📈 Technical Analysis
ETH ran the weekly swing low and closed above, signaling a shift in structure. A strong daily structure break followed, forming a fresh daily demand zone. The first tap into this demand zone resulted in a solid rejection — confirming its validity.
Afterward, price briefly deviated above the lower time frame bearish trendline, then retraced back, showing potential accumulation before the next leg up.
📘 Model to be used – HTF Demand w/ Liquidity Run & Max Discount Zone (DLRMD Model)
1-Identify the HTF trend and take setups only in that direction.
2-Mark the active HTF demand zone.
3-Confirm liquidity sweep within that zone.
4-Use Fibonacci retracement to locate the 0.75 max discount area.
5-Wait for LTF confirmation before entering.
📌 Game Plan
I’ll be waiting for price to return and retest the daily demand zone, ideally running the 12H swing liquidity at $4,090 and tapping the 0.75 max discount zone around $4,050 before considering entry.
🎯 Setup Trigger
4H structure break confirmation after price taps the $4,050 level.
📋 Trade Management
Entry: $4,050 (expected zone)
Stoploss: Below the 4H swing low that breaks structure
Targets:
TP1: Bearish trendline retest (≈$4,445)
TP2: All-time high (≈$4,965)
Once TP1 is reached, I’ll move stoploss to breakeven and manage partials actively.
💬 Like, follow, and comment if this breakdown supports your trading! More setups and market insights coming soon — stay connected!
⚠️ Disclaimer: This content is for informational and educational purposes only and does not constitute financial, investment, or trading advice. Always DYOR before making any financial decisions.

ETH BOTTOMETH BOTTOM 97% confidence is in. no need to go lower.
It has my blessings and permissions to run higher from here.

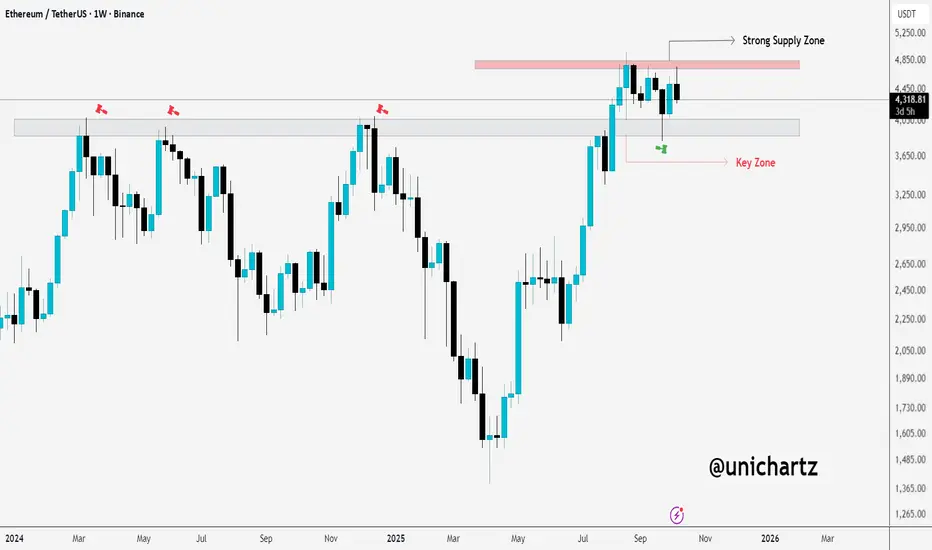
ETH: Critical Levels to Watch Now!The chart shows Ethereum ( CRYPTOCAP:ETH ) on the weekly timeframe, and we're currently at a crucial point. Ethereum is approaching a strong supply zone around $4,800, which has acted as a resistance level in the past. This suggests that the price could face selling pressure in this range. If Ethereum fails to break through this level, it might experience a pullback or sideways movement.
On the other hand, the key zone around $4,100 is providing current support. As long as this level holds, there is potential for Ethereum to attempt another move upwards toward the supply zone at $4,800. However, if the price breaks below this key support zone, we could see a deeper pullback, possibly targeting lower support levels.
#PEACE
Stay tuned for more update
Eth finally So the thing is if you're trading only use what you can afford to lose
I posted this earlier about chart not clear but also looking like a break and retest
If you check my earlier post
So I entered on the break and retest using what I can afford to lose as usuall
And we did it
If you took the trade congratulations 💯

ETH - Updated ChartHere is an update to our two previous posts:
ETH perfectly bounced from our "First Key Test" to our original green trendline we pointed out would act as a new level of selling pressure.
Price did respect this green trendline as a new resistance level for many days until having a false breakout above to test the "Supply Zone".
Upon getting rejected at the Supply Zone (Red Box), price broke back below our green trendline, reclaimed it as resistance, and has fallen more.
What's next? Will have another post following this update.

Hunting a eth bounceLooking for eth bounce... Eth got its first support bounce. Waiting for the retest. before entering long.
Buy On Dippers Beware: The Identify TrapNOTE – This is a post on mindset and emotion. It is not a trade idea or system designed to make you money. My aim here is to help you preserve your capital, energy, and focus so you can execute your own trading system with calm and confidence.
“Buy the dip” has become part of trading folklore.
But for many, it’s not just a strategy, it's a statement of self.
You’ve been rewarded for it before.
You’ve built confidence on seeing value where others saw panic.
Each time it worked, it reinforced a powerful story:
“This is what I do. This is who I am.”
So when price drops, that instinct fires fast.
You tell yourself you’re being disciplined - waiting for the next opportunity.
But often, something deeper is happening.
THE IDENTITY BEHIND THE DIP BUYER
Surface story:
“I’m the one who spots opportunity when others panic.”
“I’m disciplined. I buy when others are afraid.”
It sounds like confidence. But beneath that surface sits a hidden driver…
“I am only good when I’m right.”
“I am valuable because I can see what others can’t.”
“If this doesn’t work, what does that say about me?”
What's going on here is ego preservation .
WHAT’S REALLY DRIVING IT
Emotion: Defiance a need to prove that you know what you’re doing, and that you’re right.
Impulse: Reclaim certainty through action.
Underlying belief: “I know how this game works. I’ve done this before.”
It feels like conviction, but it’s really an attempt to confirm that as a trader you are generally always right. Remember though, markets broadly trend only 30% of the time so the chances of being wrong may be higher.
THE RISK
When markets shift regime, identity-based trading becomes dangerous.
You stop trading what’s in front of you and start defending the idea of you
Overconfidence, stubbornness, refusal to adapt can all be disguised as “discipline.”
The more attached you are to the identity , the harder it becomes to see the reality of what is.
THE REFRAME
Next time you feel the pull to “buy the dip,” pause and ask:
“Am I trading what I see or am I trading what I want to happen?
REFLECTION
If this feels familiar, take a moment to notice what being right means to you.
For some, it’s safety.
For others, it’s significance.
Either way awareness is where change begins.
By the way - since Non Farm is still scheduled to be released tomorrow (10th October) here's a link to the most recent post on preparing your mindset for NFP for anyone that's curious.
I also just noticed after posting this that the there's a great post on buy the dip from TradingView itself - for anyone wanting to get into the technicals a bit more
