#ETHUSDT 4H ChartPrice is currently sitting on the EMAs and consolidating on lower timeframes after getting rejected off our 6h supply zone and leaving another 4h supply at $4,650. MACD is showing bearish weakness, RSI is sold and EMAs are bullish. Price should tap into the 4h supply zone before potentially retracing again.
Trade ideas

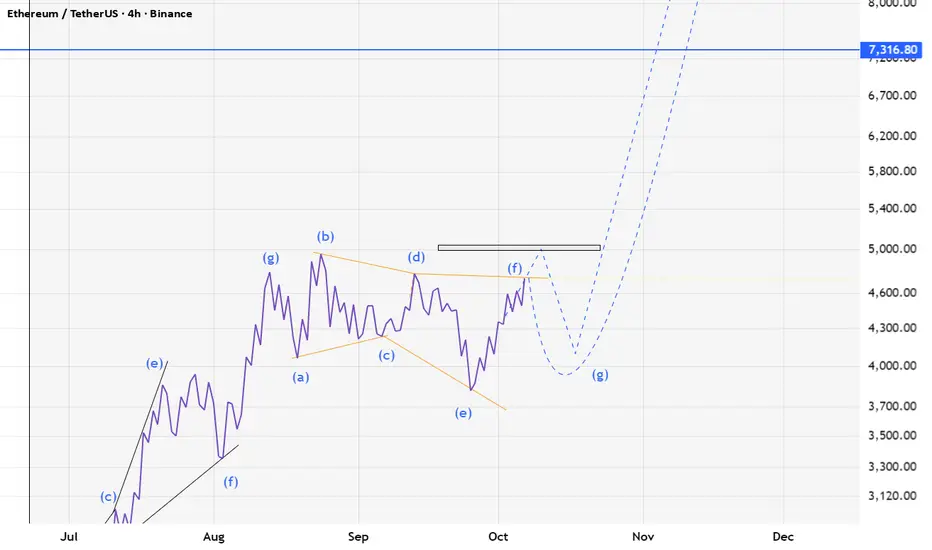
ETH - UPDATECRYPTOCAP:ETH - price update: 5000$+ next? 👀📈
Let's keep it simple and not change the plan.
🟩Weekly candle close above 5000$ could confirm price discovery mode 📈
🟨Double top resistance under 4950$ & rejection possible.
Bullish momentum building above 3800$, exactly as predicted (50% fib test) (correction) to grab liquidities & confirm potential new uptrend + ATH breakout.
The best to do for me is to keep an eye on the consolidation area: 4800$ - 3800$ to track the next big wave!
Without breakout confirmation, price could move on both side for now.
Overall, as long as the monthly and weekly candle remain above 3780$, bulls are in control.
Key levels:
4950 - 4840 - 4750 - 4400 - 4350 - 4230 - 4090 - 3850 -3800 - 3560 - 3200

ETH - UPDATE - MASTERCLASSCRYPTOCAP:ETH - 22/09 vs today: Update - MASTERCLASS 🔥
"Still bullish medium/long term, but a further correction is very possible before liftoff!
Bulls need to hold $3780. Below = trouble…Above = game still on for ATH attempts later. 📉"
Insane setup shared if you followed! 3800$ liquidities grab ✅
Prices is up 23%+ from this zone mentionned! 🔥
Are we ready to fly toward 5000$ now??
I'll let you discover on the next analysis Im working on!
Life if you want to see it! 👍

Ethereum (ETH): Looking For Reversal And Bullish Dominance!ETH had a good rally to upper zones until yesterday's liquidity sweep, where the price had taken out high-leverage traders.
Despite that, we are still above our local support zone and EMAs so our game plan for Ethereum has not changed at all. Currently seeing signs of MSB forming on smaller timeframes, so as soon as we get one, we expect a similar price movement to happen like we had yesterday (just in upside direction)
Swallow Academy

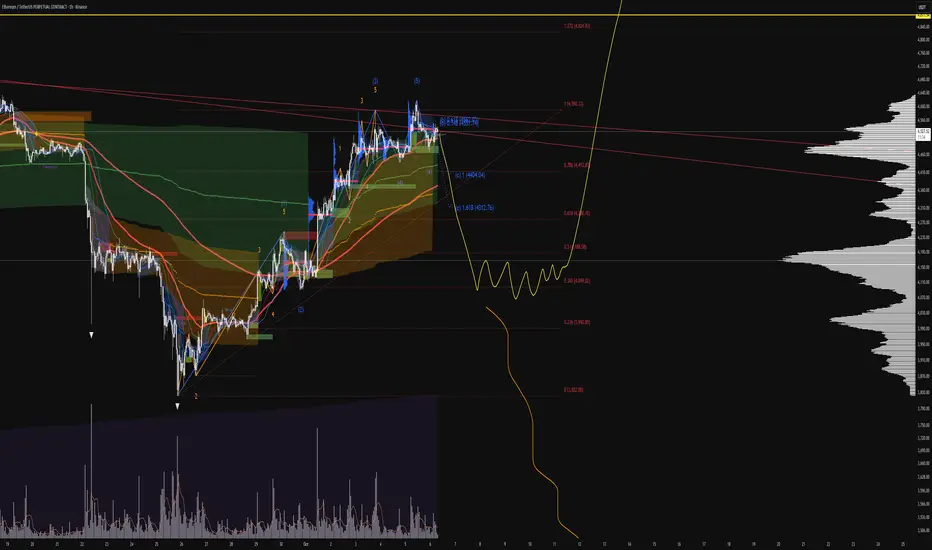
ETH USDTEthereum I expect to see prices between 5200 and 5800 in the short term
And with this jump I think wave 5 will end and we can enter a correction wave
No analysis is 100%

ETH -bias long Bullish indications:
Previous day's close is respected.
MA 21 being respected.
HHHL
Hammer candle formed.
Bullish wedge formation
Trend line resistance break.
Bullish divergence.
IHS formation in 15 min.
Bearish indications:
MA 21 is still bove the price in 1 hr
Trade plan bias long @ 4497
SL:4417
TP1:4585
TP2:4663

ETH Pullback Setup – Eyeing the Next Wave Down💥 🌊
📊 Current Setup
On the lower time frames, ETH couldn’t hold that $4,750 zone — price got smacked down hard by the bears, printing a clean double top up there 😤. After that rejection, we broke structure and even printed a new low, showing that bulls are runnin’ low on energy for now ⚡.
🚦 Scenarios
👉 I’m watchin’ for a pullback into resistance — a clean retrace could offer a sweet entry for the next leg down.
👉 Target zone sits near $4,250 support, where the next bounce might line up 🌊.
👉 If ETH somehow regains momentum and flips $4,750 back into support, that’d cancel the bearish play and open room for a higher push 🚀.
🧭 My Take
Structure looks clean, momentum’s clear — bears got control short-term. I’m just waitin’ for that perfect retracement setup to jump in and ride the next wave down for some solid gains 🏄♂️💥. Until then, patience over impulse 🤙.
💬 What do you think about this scenario? Only share your idea if you’ve got another opinion — otherwise just hit that button 👍

ETH Range Watch – Calm Before the Next Set🌀 🌊
📊 Current Setup
ETH’s been cruisin’ sideways for a bit now — price is locked inside a tight range and the daily chart’s showing clean consolidation. Zoom out to the weekly and you’ll spot it shaping into a wedge pattern, pressure building like a tide ready to shift 🌊.
We’re basically boxed in between $4,000 support and $4,750 resistance. That’s the battlefield — bulls are holding the floor, bears are guarding the ceiling.
🚦 Scenarios
👉 Bullish breakout: If ETH can break and hold above $4,750, then build a fresh higher low on the retest, that’s when the next leg of the run could kick off 🚀.
👉 Range continuation: If we keep bouncing inside, the play’s just to surf the channel, buying support, trimming near resistance, and keeping stops tight.
👉 Bearish break: A clean drop below $4,000 would flip structure short-term — but so far, buyers keep paddling back every time it dips.
🧭 My Take
No need to fight the chop here. The best trades come when the market shows its hand — patience pays. Set your alerts around the key zones, manage exposure, and let the next big move come to you, not the other way around 🏄♂️💨.
💬 What do you think about this scenario? Only share your idea if you’ve got another opinion — otherwise just hit that button 👍

ETH-USDTThe first target I gave was hit
5% correction without leverage from yesterday to now ✔️🔽
Now the failure or not can determine whether the move continues to 4230 or not

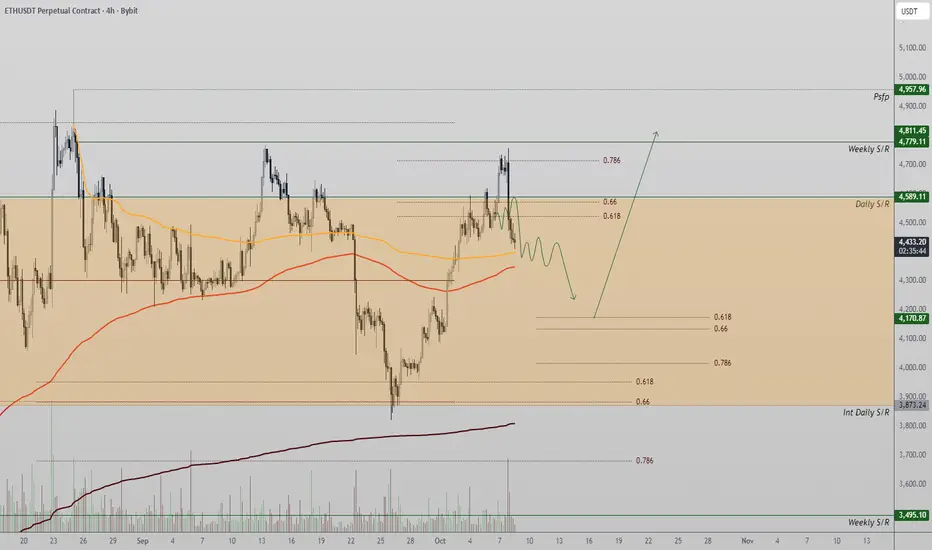
Ethereum Maintains Bullish Structure Despite Range Re-entryEthereum re-entered its prior trading range after a failed breakout above $4,589. Despite the retracement, market structure remains bullish, with a potential higher-low formation developing near the 0.618 Fibonacci zone.
Ethereum’s recent failure to sustain momentum above the $4,589 resistance led to a quick re-acceptance back into its prior range. This type of “failed auction” pattern often triggers short-term corrections, allowing the market to rebalance and find fresh demand at lower levels. However, despite the rejection, the broader uptrend remains intact, supported by higher highs and higher lows on both the daily and weekly timeframes.
The area between $4,250 and $4,300 represents a critical support zone — aligning with the 0.618 Fibonacci retracement level. Historically, ETH has treated this level as a springboard for continuation moves during trending conditions. A controlled pullback into this region would likely attract dip buyers, reinforcing the macro bullish narrative. Furthermore, on-chain metrics show steady network activity and staking participation, which supports long-term accumulation.
Should ETH reclaim the $4,589 zone, bullish continuation toward $4,950–$5,000 becomes likely. Conversely, if the 0.618 level fails to hold, a deeper retracement into $4,050 could occur before recovery.
What to Expect:
Ethereum remains bullish overall, with the current dip seen as corrective. A confirmed higher low at the Fibonacci zone would reaffirm momentum toward $5,000 resistance in the sessions ahead.
ETH/USD on Support! Buy Setup!ETH/USD is testing a strong support. With an Instant Buy entry, we can take a 1:3 trade with low risk.

ETH/USD Buy Setup on Range BreakoutETH is in a range on 1H Timeframe. If it breaks this range in the upward direction, we can take a 1:1 trade. I have placed a Buy-Stop order above the range. Let's see how it goes.

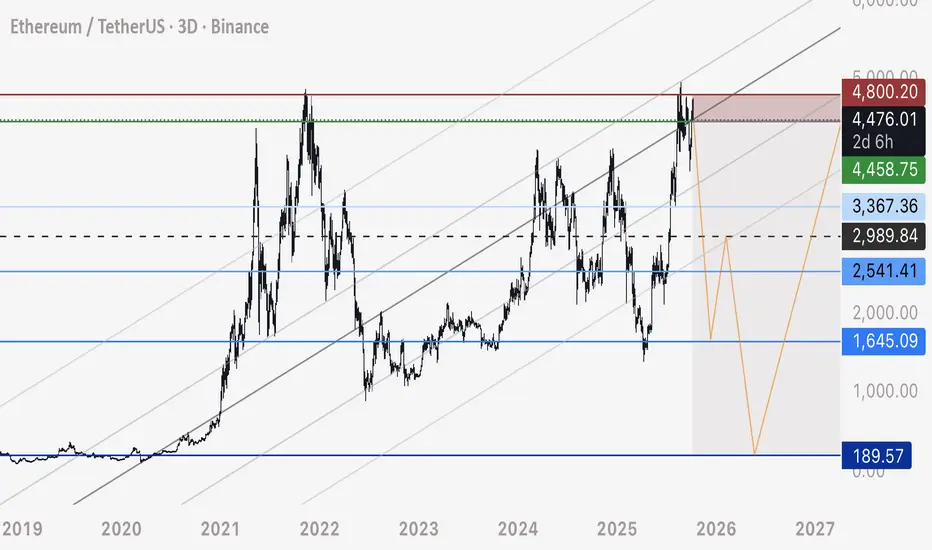
ETH UPDATE - Return to Entry Level, Short Trade InitiatedIn similar fashion to the Bitcoin trade today, here is details on my ETH Short Flash Crash idea.
For detailed information and explanation, please see my linked related posts made today.
Entry / Risk Management:
Entry - 4,460 to 4,480
Stop Loss - 4,800
Take Profits:
1) 3,400 - 20-50% Closure
2) 2,550 - 20% Closure
3) 1,650 - 40-60% Closure
4) 200 - 100% Closure
ETH may create a 3 wave corrective move - and I will be hedging with a long position from 1,600 to 3,000 - timed entry with Bitcoin hitting 35,000
I will buy SPOT ETH only at the range of 200-500
Yours truly,
- DD
ETH | 6 Hrs | Long | Target +10%This technical analysis is for informational and educational purposes only. It does not constitute financial advice. Remember to always research and consult with a professional before making investment decisions. Good luck! 📈💼🚀

ETHUSDT price have strong resistenceRight now, Ethereum is at the third touch on the descending (resistance) trendline.
Usually, when we reach the third touch, the price tends to fall.
We’re currently below the major resistance level at 4877, and in my opinion, on the monthly and three-month timeframes, the price doesn’t have enough strength to break through this level yet.
A correction is needed before we can break it.
That’s why at the moment, I’m more inclined toward short positions.
If you like the idea, please put a ‘like’. It's the best ‘Thank you!’ 😊 P.S. Always do your own analysis before a trade. Set a stop loss. Capture profits in instalments. Withdraw profits in fiat and make yourself and your friends happy.
ETHEREUM New Update (12H)The upward retracement has invalidated the previous analysis.
The best area for a strong price rejection is the QM L zone up to the historical high.
If you’re looking to take a short (sell) position, wait for the price to reach the red-marked zone in the coming days.
For risk management, please don't forget stop loss and capital management
When we reach the first target, save some profit and then change the stop to entry
Comment if you have any questions
Thank You

ETH - LONG SET-UPBINANCE:ETHUSDT
ETH Long Set-up
1️⃣Entry Between 4430-4500
SL below 4325
2️⃣ Entry Between 4200-50
SL Below 4100
Margin & Leverage as per your risk capacity

ETHUSDT Daily Analysis – Key Downtrend & Swing SetupEthereum is currently in a downtrend after the sharp surge toward $5,000. This move lower was expected following the extended bullish rally.
Looking ahead, I see a high probability of ETH reaching the $3,730 daily support. This level is a key swing trade setup and could serve as the foundation for the next big leg upward, potentially supporting a push toward a new all-time high in the longer term.
🔑 Technical Levels – Support & Stop Loss
📍 $3,730 | SL: $3,536 (Daily support – key swing setup)
📍 $2,680 | SL: $2,481 (Weekly support – deeper retracement zone)
Bias: Bearish in the short term while ETH remains under $4,400, but turning strongly bullish long term if $3,730 holds as support.
📊 Fundamental Insight
Regulatory uncertainty continues to weigh on crypto sentiment in the short term.
On-chain activity shows resilience, with active addresses and DeFi usage stabilizing.
Institutional demand remains present, with ETH staking and ETF developments reinforcing long-term value.
Overall, ETH is consolidating after an extended run. A retest of support zones could present high-probability swing opportunities for patient traders.
👉 If you find this content helpful, don’t forget to like & follow for more daily analysis.

ETHEREUM $10,000 TARGET by 2030When GCR said that $10k #ETH by 2030, then most likely the journey will be like this

ETH(based on NEo wave)soon eth will start a temporary correction and goes for higher bullish waves.
it is the last chance to buy it.
Stop loss is 3800.
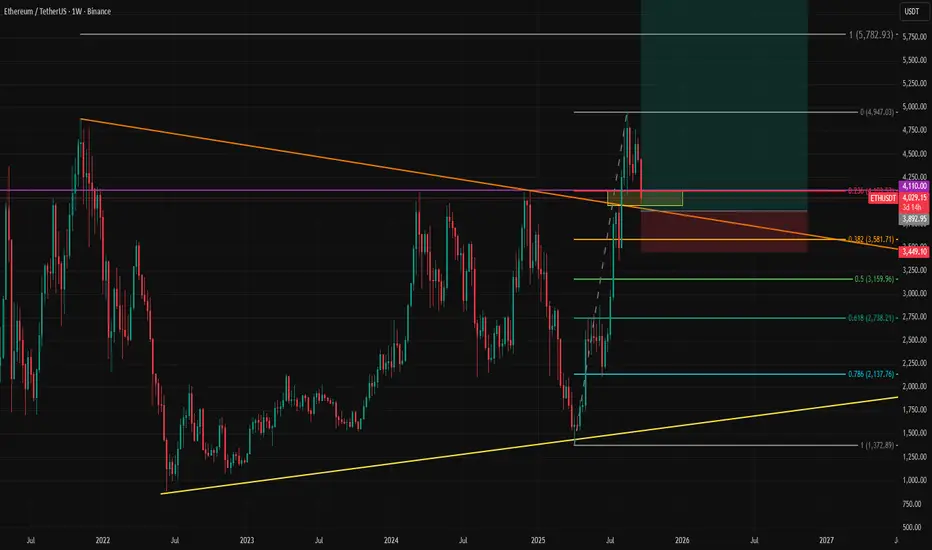
ETHUSD Retests Broken Trend on Weekly TimeframeEthereum is retesting the broken trendline and is likely setting up for another leg higher. Unless there is persistent pricing below $4,000, this selloff is likely to become a buying opportunity for those who missed the earlier rally.
Our year-end (or end of the first quarter of 2026) target above $7,000 still stands. The main risk is a potential selloff in the US stock market, which could drag crypto lower if the correlation remains intact.
DeGRAM | ETHUSD is preparing to refresh ATH📊 Technical Analysis
● ETH/USD is trading within a broad ascending channel, recently breaking above the consolidation pattern that formed from August to September. The price has reclaimed the mid-channel and is approaching the key $4800 resistance.
● Sustained momentum above $4800 would validate a bullish continuation toward the $5500 upper boundary, supported by the ascending support line that has held since early 2025.
💡 Fundamental Analysis
● Ethereum’s network activity is recovering as institutional demand for ETH staking grows and Layer-2 adoption increases, reinforcing the bullish mid-term outlook.
✨ Summary
● Breakout above $4800 opens the path to $5500. Channel structure and improving fundamentals favor continued upside momentum.
-------------------
Share your opinion in the comments and support the idea with a like. Thanks for your support!

ETH-USDTI talked about its rise yesterday and it is clear in the previous analysis
It rose to the resistance of 4770 ✔️🔼
But I think it needs a correction in the short term
I have identified two support levels for you 📊📉📉
