Ethereum ATH Incoming - As soon as BTC goes back to sleep.
Our BINANCE:ETHUSDT.P algorithm triggered a long position.
All of our technical indicators calculate a 77.8% arithmetic average long signal strength . The most important piece of "evidence" for our speculation that Ethereum will reach new ATH levels within the next month is the fact that Extreme Trend BREAKOUTS and the High-Volatility TREND FOLLOWER conditions triggered the trade together and sit at 100% long signal strength at the time of writing.
Our other breakout condition - Double-Filtered Channel BREAKOUTS sits at 80% long signal strength too. Why is all that relevant? Because these conditions (made up out of 5-6 technical indicators each) are meant to detect and enter breakouts, following the trend from the very start.
While it is programmed to exit at 2%, we believe that a bigger move is in preparation. We recently saw BINANCE:BTCUSDT.P reach unprecedented highs. Historically, when Bitcoin stops it's parabolic growth and money starts flowing back into fiat and other cryptos - ETH benefits first.
Fundamentally, Ethereum is the backbone of the smart-contract and Web3 revolution. Solana, PolkaDot, BNB and other alt-coins are all derived from and inspired by the Ethereum virtual machine. This makes us ask the question - why is Ethereum lagging behind so much behind Bitcoin?
Well, there are a couple of possible answers and they all lead to the same conclusion:
- Solana, with it's lower barriers for entry, profited the most from the retail excitement around meme-coins. The easy coding language and simple, but functional and cheap websites for creating these "meme-coins" took away a large chunk of the retail volume that would otherwise go towards Ethereum.
- Ethereum's switch from proof-of-work to proof-of-stake is just now completing. The release of pre-PoS era staked ETH to large investors over the last year is finally reaching a point in time and price where it is more profitable for large ETH stakers to be incentivized to start keeping their original investment. Basically - there is less and less incentive to sell your staked Ethereum and more incentives to stake more (and therefore buy on Spot).
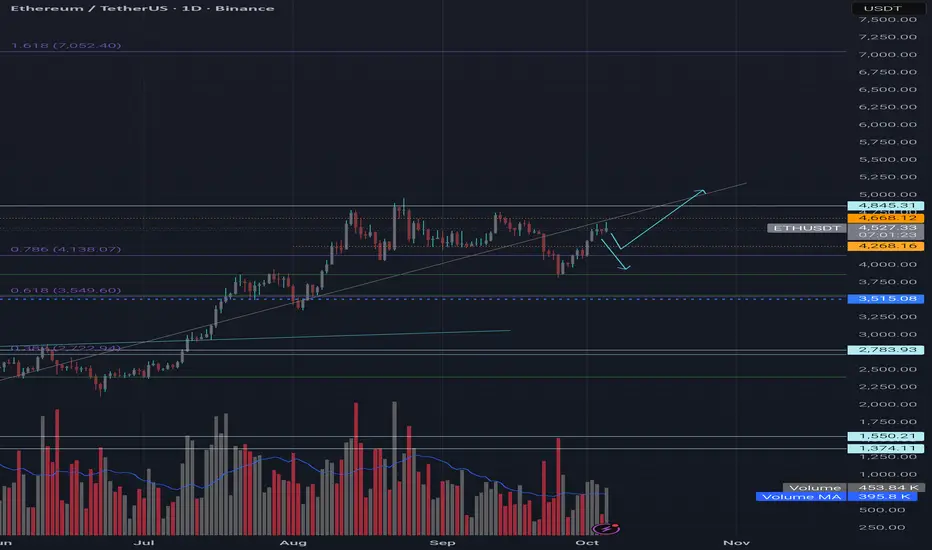
From the picture above we can see that the $4700 level is a major resistance level. Once that is broken, we have very little historical references for what may happen.
Or in other words - 4700 is the level from which we will bounce into price discovery after hopefully turning into support.
Not a lot of time is left in this crypto cycle. And Ethereum tends to finish it's parabolic increase towards the end of the classical 4-year cycle.
Trade ideas

ETH/USDT – Ready for a Bullish Move (Daily Chart)Ethereum is showing strong signs of a potential bullish breakout on the daily timeframe. Price is consolidating above key support with higher lows forming, indicating accumulation. A breakout above resistance could trigger a strong upward move. Watch for volume confirmation and sustained close above resistance for trend continuation.
#ETH #Ethereum #Crypto #Trading #Breakout #Bullish
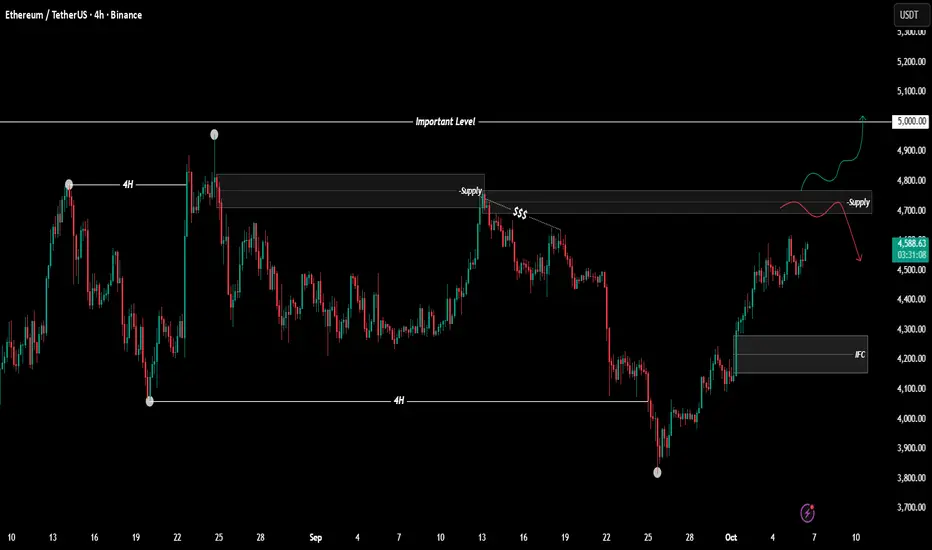
#ETHUSDT 4H ChartPrice is still pushing upwards and it is currently testing the 6h supply zone. MACD is still neutral, RSI is overbought and EMAs turned bullish. We may see price trade deeper into this area of supply before potentially retracing.

ETH USDT predictionprice prediction for ETH in short term - seems to go up until 7k~ where it tops as per the timeline

Ethereum (ETH): Good Signs of Recovery | Bullish AF | Breakout?After a fakeout below the middle line of Bollinger Bands, we have had a nice recovery ever since, just like last time when the price dipped below that line.
Now the game plan remains the same; we look for a breakout of the current ATH and once we get the breakout, we are aiming for that new ATH target of ours!
Swallow Academy
$ETHUSDT Analysis - Oct 6 | 4H Time FrameBINANCE:ETHUSDT Analysis - 4H
Hello and welcome to another analysis from the Satoshi Frame team!
I’m Abolfazl, and today we’re going to analyze Ethereum on the 4-hour timeframe.
As you know, USDT dominance has been trending downward, and the overall market structure is bullish. On the other hand, Bitcoin has set a new all-time high! Considering these factors, it’s clear that Ethereum also has the potential to move toward $5,000, which isn’t unrealistic.
From another perspective, Ethereum has shown a change of character (CHOCH) on the 4-hour timeframe, and the marked supply zone could create a pullback in price.
When the price reaches the supply zone, make sure to look for proper entry confirmations, and keep in mind that there’s a higher chance of the zone being broken and I’m personally looking for long positions.
See you in the next analyses!
Stay tuned with the Satoshi Frame team...
ETH/USDT Bullish Breakout Heist Plan – Are You Ready to Strike?🔥💎 ETH/USDT Crypto Heist Plan: Swing Trade Edition 💎🔥
Dear Thief OG’s & Market Robbers 🕵️♂️,
The vault is loaded, and Ethereum vs. Tether (ETH/USDT) is about to get cracked wide open. We’ve spotted the weak spot in the system — and this time, it’s a bullish breakout heist. 📈💰
📊 Heist Blueprint: The Setup
Asset: ETH/USDT (Crypto) 🌐
Style: Swing Trade ⏰
Plan: Bullish Breakout & Layered Entries ⚡
🚪 Entry Points (Breaking Into the Vault)
Breakout Entry: Break above 4800.00 — that’s our signal to strike 🚀
Layered Buy Orders (Thief Style): Stack your loot with multiple limit layers:
4700.00
4600.00
4500.00
(You can add more layers depending on your loot bag 💼)
🔔 Pro Tip: Set TradingView alarms at 4800.00 so you don’t miss the breakout moment.
🛑 Stop Loss (Cover Your Tracks)
Thief SL placed at 4200.00 once breakout confirms ⚠️
Adjust your stop loss based on your own risk style & strategy — every thief has their own getaway plan. 🏃♂️💨
🎯 Target (Escape Point)
Police barricade seen at 5300.00 🚔
Safer escape: 5200.00 — grab the loot and vanish before the cops arrive. 💸
📡 Why This Heist Works
Breakout momentum above 4800 shows ETH is ready to run.
Layering strategy = smarter accumulation while minimizing risk.
Targeting clean levels where liquidity + resistance hide.
⚠️ Risk Warning: Every heist has danger — manage size, use layers, and don’t overexpose. Protect your loot like a true Thief OG. 🏴☠️
💥 Support the Crew! 💥
Drop a like 👍, share a comment 💬, and follow 🚀 for more Thief Trader Heist Plans. The more noise we make, the stronger our gang becomes! 🕵️♂️💰


Ethereum (ETH): Waiting For Clarity | Breakout of Current ATHThe game plan for ETH remains the same; we still keep waiting for that clean breakout from the ATH zone and so far last week and the current week show some promising volume, which is leading us closer and closer to the breakout.
So nothing is left but to wait, and once we see that breakout, we are going to get into a good rally!
Swallow Academy

ETH Testing Descending Trendline — Targets 4,736 & 4,940Last week, Ethereum showed strong growth. The price is now right at a key descending trendline and trying to break through it. As long as the price stays above the SMA 50 , the green scenario remains in play, with targets at 4,736 and 4,940 .
If the SMA 50 breaks, there’s a high probability of the ascending trendline breaking as well, which could send the price down to the weekly pivot point at 4,404 . I expect support around this level, as the SMA 200 could also reinforce it.
After a successful bounce or a recovery above the pivot point, the next targets will be 4,600 – 4,700

ETH SELL 4HEthereum’s descending channel on the 4H timeframe is still valid, and the current momentum shows signs of potential bearish continuation. However, if the channel is broken to the upside and price stabilizes above 4750, the scenario will turn bullish, and we should start looking for long opportunities.

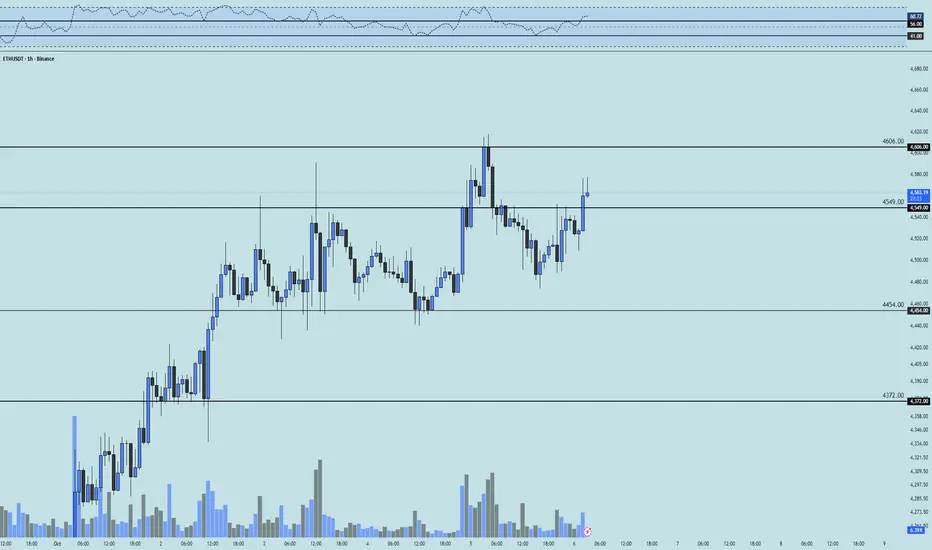
ETH 1H Analysis - Key Triggers Ahead | Day 31☃️ Welcome to the cryptos winter , I hope you’ve started your day well.
⏰ We’re analyzing ETH on the 1-Hour timeframe .
👀 On the 1-hour timeframe, Ethereum recovered after yesterday’s drop, moving toward its support zone, where it consolidated briefly before forming a short-term trigger at $4,549. This level was then broken in a single 1-hour candle, and ETH is now stabilizing above it — confirming the trigger activation. A new resistance has now formed around $4,606, and a breakout above that level would activate another bullish trigger for Ethereum.
🧮 The RSI oscillator currently highlights two key zones for ETH trading — levels 56 and 41. Crossing either of these levels typically increases Ethereum’s volatility. At the moment, the RSI sits near 62, indicating growing long momentum and increasing buying pressure.
🕯 The recent candle structure shows clear bullish volume and upward momentum. After activating the trigger zone, Ethereum is pushing higher with a strong whale-driven candle, targeting upper resistance levels. Yesterday’s drop allowed some profit-taking by whales and filled several sell orders — meaning ETH now has a cleaner path upward compared to previous attempts.
🧠 For ETH positioning, you can either wait for a breakout above $4,606 for confirmation, or enter early at the $4,549 trigger zone if you spot a low-volume indecision candle interacting with the SMA7 line — signaling potential bullish continuation.
❤️ Disclaimer : This analysis is purely based on my personal opinion and I only trade if the stated triggers are activated .
DeGRAM | ETHUSD will retest the support level📊 Technical Analysis
● ETH/USD bounced from the 4,000 support zone after a false break, confirming strong demand and the validity of the long-term ascending channel.
● Price structure suggests potential upside with targets toward 4,950 resistance, supported by rejection wicks and consolidation above 3,920.
💡 Fundamental Analysis
● Ethereum’s momentum is fueled by rising institutional flows and expectations of ETH ETF approvals, strengthening medium-term bullish sentiment.
✨ Summary
ETH/USD holds above 4,000 with bullish recovery signals. Key support lies at 3,920, while upside targets remain 4,950. Momentum favors buyers in the medium term.
-------------------
Share your opinion in the comments and support the idea with a like. Thanks for your support!

Continuation of the previous idea based on the Harmonious EnergyThe consolidation phase is coming to an end. The market structure is gradually moving into the next stage of the energy cycle, where a new flow direction is forming.
At the moment, I am observing a continuation of the energy movement with a noticeable manifestation of buyer strength. The key focus is on price behaviour near the resistance level — this is where it will become clear whether buyers will be able to maintain control and continue the upward momentum, or whether the market will enter a redistribution phase.
According to the GPE concept, this moment reflects the transition from balance to energy release — when the accumulated potential turns into real movement.
📌 Observation: price reaction to resistance and confirmation of the flow's strength.
💬 If you have any questions or would like to discuss the idea in more detail, I am always open to dialogue.

#ETH/USDT LONG CHART ANALIYSIS !!🔹 Ethereum (ETH/USDT) Analysis
Ethereum has shown a strong recovery from the $3,800 support zone, bouncing sharply and now trading above the 50-day moving average (50MA) — a key bullish sign.
You can see from the chart that ETH has broken out of the descending wedge pattern that had been forming for weeks. This breakout, along with the reclaim of the 50MA, indicates a shift in momentum from bearish to bullish.
Additionally, price is currently sitting above the Ichimoku Cloud, which further strengthens the bullish bias. When ETH is trading above both the 50MA and Ichimoku Cloud, it often signals the start of a potential trend continuation move.
Bullish Structure – ETH has consistently made higher lows since hitting $3,800.
MA Confirmation – The move above the 50MA suggests renewed buyer strength.
Ichimoku Cloud Breakout – Indicates improving sentiment and trend reversal.
Volume Support – The recovery was backed by healthy buying volume.
Key Levels to Watch:
Support: $4,270 – $4,300 zone (previous resistance now support)
Resistance: $4,800 – $4,850 zone (next major target area)
Invalidation: Below $4,200 (would weaken bullish momentum)
If ETH holds above $4,270 and consolidates, we could see a continuation toward the $4,800–$5,000 range in the coming sessions.

Ethereum - too big to failIf you try to find top100 coinmarketcap coin list, you will be amazed by how many cryptocurrencies are now forgotten or even dead. Even 100M+ mcap coins die because they turn out to be merely speculative or scammy ventures. But one of the few that stayed on top of all the garbage was Ethereum.
It stayed on top of everything because it was the first crypto which created an ecosystem hosting multiple
"protocols" and tokens, which also helped crypto market grow not only in terms of market cap but infrastructurally.
So I believe it is now too big to fail, but not just because of ~400B. market cap but also due to how many project are based on top of EVM.
I think it might reach at least ~700B market cap during this cycle but later it will be among trillion mcap assets

Long trade
🔹 Trade Details
Buy-side trade entry: 3,955.30
Profit level: 4,651.28 (+18.19%)
Stop level: 3,871.54 (−1.63%)
R:R: 11.19
Executed during the London to NY AM session on Fri 26th Sept 25 at 9:00 am, coinciding with a 4H FVG and structural shift on the lower time frame.
🔹 Key Technical Observations
Break of structure (BOS): Occurred after reclaiming the EMA 50 (blue) and surpassing prior swing highs.
👉 EMA alignment: The 50 EMA crossed back above the 200 EMA — a medium-term bullish trend confirmation.
👉 Volume: Expansion seen at the demand retest (high conviction buyers stepping in).
👉 FVG zones: Multiple unmitigated Fair Value Gaps remain below current price (4,430–4,480 area), acting as potential re-entry zones if price retraces.
👉 Supply zone: Around 4,691–4,700 (4H), where price is currently reacting, just beneath the larger FVG target zone (~4,570–4,600).
🔹 Market Narrative
This move reflects a classic Wyckoff accumulation to markup transition.
The “Consolidation Identified Phase” signalled the Phase C–D transition, confirmed by:
Higher timeframe spring event and reclaim of range midline.
Volume expansion with bullish displacement candles.
Structural BOS and retest of the neckline.
👉 Price respected the PD Array (Discount Zone) for entry and is now operating above equilibrium.
🔹 Forward Outlook
If price sustains above 4,480–4,500, expect continuation toward the 4,570–4,600 FVG for full target mitigation.
If retracement occurs:
Watch 4,445–4,460 demand zone (and unmitigated FVG) for buyside continuation setups.
Below 4,430 (WMA zone) would invalidate the short-term bullish structure.

ETHUSDT 1D chart review📊 1. Main trend
• The chart shows a long -term movement in the inheritance trend channel in which the price is currently fighting for the mountain, but here you can see that the inferior canal limit is a strong resistance for the price.
⸻
🧠 2. Medium walking
• We see the cut SMA 50 and SMA 200 (so -called Golden Cross) - this is an upward signal in day interval.
• EMA 50 (green) is approaching the intersection of EMA 200 (red) - if the growth cross is confirmed, it may mean further growth time.
⸻
💹 3. Horizers of support and resistance
Support:
• 4,034 USDT - strong level, defended after the last inheritance.
• 4,252 USDT - short -term support (after breaking above trendline).
Resistance:
• 4 720 USDT - local resistance, previously rejected several times.
• 4,966 USDT - next strong resistance (local peak).
If ETH pierces 4 720 with a volume, the road opens towards 4,950-5,000 USDT.
⸻
⚙️ 4. Indicators
Macd:
• The histogram grows green → growth momentum.
• The MacD line cut the signal line from the bottom → buy signal.
RSI:
• RSI around 60, which indicates the advantage of bulls, but without buying out.
• If the RSI pierces 70, a short -term pullback may occur.

EtheriumEtH usdt daily analysis Time frame hourly Risk rewards ratio >2.3 👈👌
Target 4474$
Move up and down in the rectangle and waiting for good news to pump
I set my SL too far to scrap of sl hunting

Etherium ETH usdt daily analysis
Time frame 4hours
Risk rewards ratio >4.3 👈👌
Target 5.748$
I think this target is final target for this bullrun .
The 5th wave.

Trading idea based on the Harmonious Energy Flow (HEF) conceptAt the current stage, there is a clear manifestation of buyers’ strength, even though the market environment is changing rapidly without any significant price movement. This forms a state of consolidation, where energy is being accumulated for the next impulse.
According to the HEF concept, consolidation represents a transitional phase — the market is searching for balance before initiating a new wave of directional movement. My current expectation is focused on the moment of breakout from consolidation, when the market will reveal the true side of strength.
📌 Main focus: observing how buyers maintain their advantage within this narrow structure and waiting for a signal confirming the exit from balance.
If you find my charting approach interesting, you are welcome to connect and discuss further. I’m open to communication and collaboration.
Would you like me to refine this version for maximum stylistic alignment with TradingView’s publication tone (slightly shorter, more analytical, and visually structured)?
ETH 1H – Holding the Line or Breaking It?ETH 1H – Holding the Line or Breaking It?
Just like BTC, ETH on the 1H is currently testing the 50MA, the short-term line between strength and weakness.
The question now: will it hold as support, or will price break below and look for shelter near the 200MA?
Right under the 50MA sits yesterday’s close, adding an extra layer of support for the short-term structure.
Today’s close could be decisive for next week’s momentum. 👀
Key notes:
ETH testing the 50MA on 1H
200MA below as next support
Yesterday’s close acting as buffer
Close today could shape next week’s direction
Bias:
Neutral-bullish — momentum intact as long as the 50MA holds.
Always take profits and manage risk.
Interaction is welcome.
Clean rejection from trend lineEth couldn't able to break through the trend line , lets see if it can hold the 4200 ish level.
failed to hold above 4200 ish then it will go to next support, particularly keep the eyes on BTC movement