Ethereum (ETH): Bounced Strong & Re-Testing EMAs | BullishETH bounced strongly from the oversold zone, and the recovery candle looks like a reaction to a liquidity grab rather than an actual dump. Price is now pushing back above EMAs, similar to the previous setups we saw in August (althought this time is is a little different)
The key now is a successful re-test of this reclaimed zone. As long as buyers hold structure and manage to break the zone of EMAs, the next step is continuation toward the $5,555 target.
Swallow Academy
Trade ideas

ETH climbs toward key resistance in rising channelThe ETH/USDT 4‑hour chart shows a recovery rally unfolding within a broader downtrend. After a sharp decline earlier in September, prices have been climbing in a rising channel, while still respecting the boundaries of a larger descending channel. Short‑term momentum has shifted bullishly as higher highs and higher lows form inside this smaller channel, and trend indicators suggest strengthening buyers.
Upcoming U.S. economic releases—non‑farm payrolls, the Consumer Price Index, and the Federal Reserve’s October meeting—could inject volatility into the crypto market. These events often alter investor expectations for interest rates and risk assets, so traders should be prepared for sudden swings.
Trade view: A bullish setup would involve waiting for a decisive break and retest above recent highs in the rising channel, with targets at the next major resistance area. A bearish setup would trigger if the asset falls below the rising channel’s base, aiming for the previous swing low and then the broader channel floor. In both cases, stops should be placed just beyond the invalidation level, and risk‑to‑reward ratios should be kept favorable.
Overall, ETH remains in a corrective rebound within a longer‑term downtrend. A confirmed breakout from this pattern could signal a larger upside move, while failure to hold the current support zone might send prices back toward prior lows.

[SeoVereign] ETHEREUM BEARISH Outlook – September 30, 2025Hello everyone,
As of September 30, I would like to share my perspective on an Ethereum short position.
At present, I believe that Bitcoin, among others, still has one more downward wave remaining. Therefore, I am closely monitoring Bitcoin’s movement to capture the timing of its bearish reversal. Given that Bitcoin is likely to enter a declining phase, I am presenting a bearish scenario for Ethereum as well.
The basis of this idea is relatively clear: the entire structure is formed according to the classical ratio relationships of Elliott Wave Theory. All detailed ratios and projections have been drawn on the chart for your reference.
-Ratio Relationships
1. WAVE.C = WAVE.A * 1.618
2. WAVE.C = WAVE.A * 0.786
3. WAVE.C = WAVE.A * 1.272
The average target price for this decline is set around 4030 USDT.
As always, I will continue to share updates on position management based on this idea as the chart develops.
Thank you for reading.

Ethereum (ETH) – Bounce From $3,800 Reclaims Daily SupportEthereum has bounced strongly from $3,800, a level backed by the 0.618 Fibonacci and VWAP
ETH’s correction into $3,800 found immediate buyer interest, marked by an engulfing candle that confirmed market strength. Despite a lack of immediate follow-through, the setup has reinforced confidence in the bullish trend.
Key Technical Points:
- Bounce from $3,800 confluence zone (Fibonacci + VWAP).
- Bullish engulfing candle reinforced strength at support.
- Daily support reclaimed, opening path toward $4,950.
The $3,800 region served as a critical pivot for Ethereum. Price respected this zone and rebounded with strong momentum, confirmed by a bullish engulfing close. The reclaim of daily support marks a structural improvement, creating conditions for continuation.
Volume and follow-through remain key. Sustained buying pressure above current levels would confirm the bullish bias and open the door to higher targets. Failure to hold daily support would weaken sentiment and expose ETH to another corrective move.
What to Expect in the Coming Price Action:
As long as ETH trades above daily support, a rally toward $4,950 is the likely scenario. Losing this level would reduce bullish confidence and reopen downside risk.

Double Tops = LIES. Market Structure is a ScamRetail traders call it resistance.
Smart money calls it liquidity.
This is why price comes back to the highs
Not for confirmation. But for your stop loss.

ETH/USDT Buy-Stop on 1H, Bullish Trend + Bullish DivergenceEther is showing a Bullish Trend on 1H Timeframe. Recently, it also showed a Bullish Divergence on same timeframe. However, there is a slight resistance ahead as well.
So, we can take the risk of taking a 1:1 risk-to-reward "Buy" trade here. Let's see how it goes.
29-09-25
Monday

Ethereum Recovery: Watching 4,229 for Bullish ConfirmationAt the moment, Ethereum is also showing recovery, but at a slower pace compared to Bitcoin. This week’s pivot point is at 4,137 , and the price is currently trading above it.
A local correction would be reasonable, with support expected in the 4,050 – 4,000 range. There’s also an ascending trendline acting as support. The risk level is 3,966 — if it breaks and the price fails to reclaim it, the likelihood of continued downside increases.
A breakout above 4,229 and consolidation would bring back a bullish outlook.

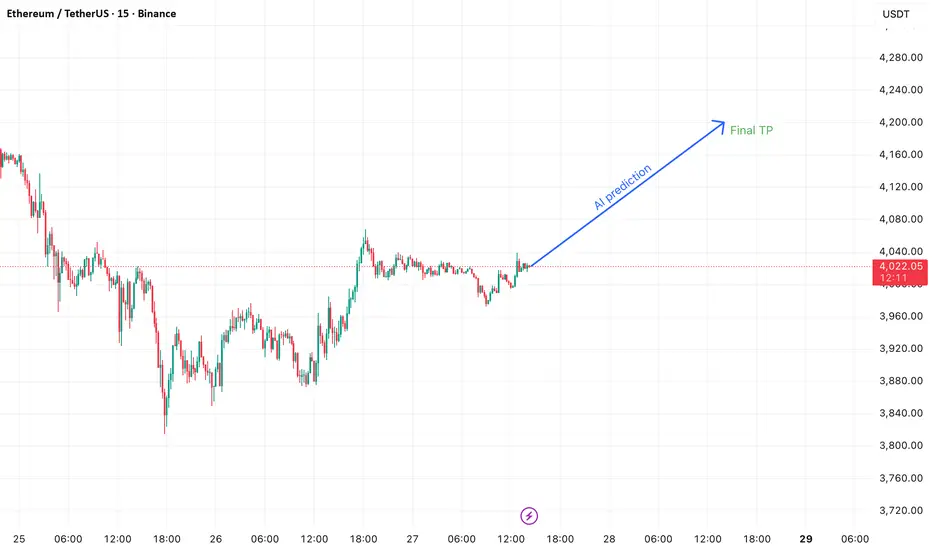
Deep Learning Model for 24-Hour ETH Price PredictionHi everyone,
I’ve developed a deep learning AI model designed to predict ETH’s price movement over the next 24 hours on the 15-minute timeframe.
It’s important to note that this model does not directly provide exact entry points for trades. Instead, it indicates the likely direction of the market, meaning you’ll still need basic trading knowledge to apply it effectively.
After testing it over the course of one month, I achieved a success rate of around 90% in my trades when using the model as part of my strategy.
The model was trained using the following features:
Time-related: Hour, DayOfWeek
Price & volume lags: Close_lag_1, Close_lag_2, Close_lag_4, Close_lag_8, Close_lag_12, Volume_lag_1, Volume_lag_2, Volume_lag_4, Volume_lag_8, Volume_lag_12
Moving averages & statistics: MA_4, Std_4, Dist_MA_4, MA_16, Std_16, Dist_MA_16, MA_48, Std_48, Dist_MA_48, MA_96, Std_96, Dist_MA_96
Technical indicators: Return_log, MACD, RSI
Hourly Forecast for the Next 24 Hours
2025-09-27 13:00:00+00:00 4026.482613
2025-09-27 14:00:00+00:00 4028.550190
2025-09-27 15:00:00+00:00 4036.481202
2025-09-27 16:00:00+00:00 4044.217143
2025-09-27 17:00:00+00:00 4051.725418
2025-09-27 18:00:00+00:00 4059.018598
2025-09-27 19:00:00+00:00 4066.029393
2025-09-27 20:00:00+00:00 4072.871648
2025-09-27 21:00:00+00:00 4079.563074
2025-09-27 22:00:00+00:00 4086.117364
2025-09-27 23:00:00+00:00 4092.561460
2025-09-28 00:00:00+00:00 4098.897422
2025-09-28 01:00:00+00:00 4107.330284
2025-09-28 02:00:00+00:00 4116.884113
2025-09-28 03:00:00+00:00 4126.399899
2025-09-28 04:00:00+00:00 4135.863390
2025-09-28 05:00:00+00:00 4145.268831
2025-09-28 06:00:00+00:00 4154.576873
2025-09-28 07:00:00+00:00 4163.768272
2025-09-28 08:00:00+00:00 4172.835229
2025-09-28 09:00:00+00:00 4181.770921
2025-09-28 10:00:00+00:00 4190.570690
2025-09-28 11:00:00+00:00 4199.232384
2025-09-28 12:00:00+00:00 4207.754681
2025-09-28 13:00:00+00:00 4216.138168
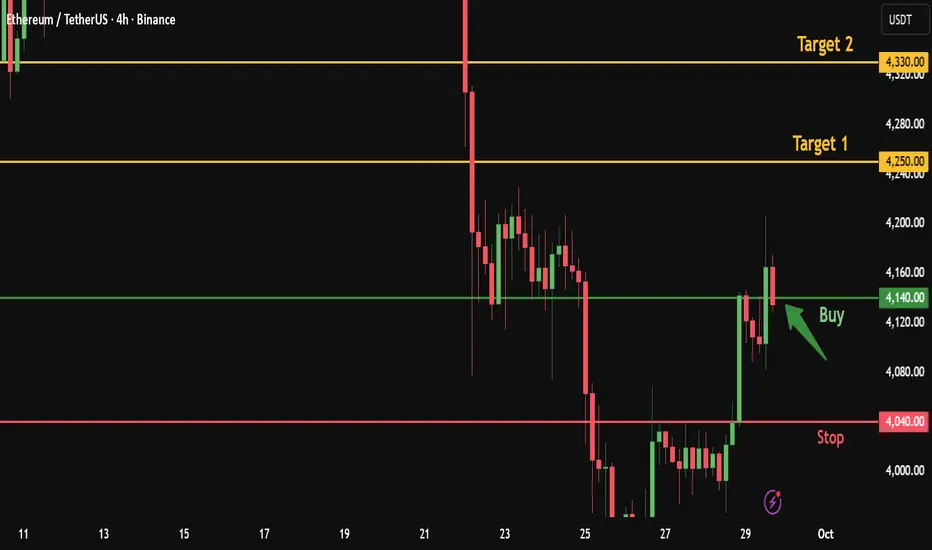
Ethereum Quick Buy from Broken Resistance – Targeting 4330After Ethereum broke the 4140 resistance with a bullish 4H candle and reached 4205, the price has now retested the broken resistance at 4140.
This level acts as a strong entry point for a long position, aiming for higher targets.
Here’s my personal trade plan:
✅ Entry : Buy from current price 4140
🎯 Target 1: 4250
🎯 Target 2: 4330
Stop-loss: 4040
👍 Don’t forget to boost this trading idea if you found it helpful,
and follow me for more daily crypto insights and trade signals.
Please note:
This is not financial advice – I’m only sharing my personal trades.
Always do your own research before taking action.
Best of luck 🌹
#ETHUSDT 6H ChartPrice moved up from the 4h demand zone at $3,850 and it is currently getting rejected off a 6h supply zone. MACD is bullish, RSI is bought and EMAs are bearish. Price needs to break and close above this 6h supply to expect further upward movements towards the next 6h supply at $4,450.

ETH 4H trade Idea Here is an idea to trade Ethereum on 4 hour TF. Entry and Exit points are given. NFA DYOR

ETHUSDT BUY AND HOLD ITI think it is a good time to buy Ethereum and hold it until higher targets. Ethereum has entered the weekly demand zone and has started its uptrend on the 1-hour and 4-hour time frames.

ETH market snapshotFor ETH to continue its upward movement, it needs to break above 4200. Currently, the attempt to approach resistance looks weak and unconvincing. Support is at 3900, but on the next test, there’s a high chance it could fail down to 3500–3600

eth usdt longCurrently, ETHUSDT on the 4-hour timeframe remains in a broader downtrend, although it is showing a pullback after bouncing from the strong support area around 3,850. The rebound from that level indicates that buyers are stepping in, but for a healthier reversal confirmation, the price needs to break and hold above the 4,200–4,300 zone. Until there is a significant breakout above this resistance, the upward movement can still be seen as a relief rally within the bearish trend. If ETH manages to sustain above 4,120 and successfully breaks 4,200, there is potential for a move toward 4,270–4,300, with further upside to 4,500 if momentum strengthens. However, if the price gets rejected in the 4,200–4,220 area, the risk of another decline is high, with a potential retest of 4,050 and even 3,850. Given this setup, the best approach is to prepare for two scenarios: a buy-on-breakout strategy if price clears the key resistance with strong volume, or a sell-on-rejection strategy if the price fails to break above 4,200.

Ethereum in the Accumulation Phase | Valhalla is NearEthereum is following a fractal pattern with consistent sizes. According to on-chain data, withdrawals of Ethereum from exchanges to cold wallets are currently very high, which itself is a supply shock. This chart indicates that we are in the process of accumulating Ethereum, and in the medium term, Ethereum can easily reach new all-time highs. Wishing you success.

Ethereum New Update (12H)On the chart, we have a bearish CH and a resistance SWAP zone has formed. This SWAP zone has been broken downward, and now on the pullback to this area, we can look for sell/short positions. As long as the price does not reclaim and hold above this zone, the bearish outlook on Ethereum remains valid
If the price strongly breaks TP1 to the downside, a much deeper drop may occur
A daily candle closing above the invalidation level would invalidate this analysis
For risk management, please don't forget stop loss and capital management
When we reach the first target, save some profit and then change the stop to entry
Comment if you have any questions
Thank You

Never miss Eth on 4160 !I am all eyes on Eth to break my trigger line (around 4230). then the buy setup on 4160 will be activated :)
First midterm target --> 6300

ETH Trade Update📊 Current Setup
My limit long on ETH got triggered with that bullish push we saw at the start of the week. But here’s the play — I closed it out at break-even. No loss, no gain 💯. Why? Because this bullish leg ain’t showin’ me the structure I wanna see. No bearish reversal forming inside this move, so no clean setup yet.
🚦 Next Moves
👉 I’m waiting for a clearer structure to form.
👉 If we get confirmation of a bullish trend reversal, I’ll hop back in long 🌊🚀.
👉 If instead the market sets up a better short structure, I’ll load up there 😈📉.
🧭 My Take
Patience over forcing trades. Right now ETH feels like it’s in “prove it” mode — I’d rather wait for the wave to shape up than wipe out on chop 🤙.
💬 What do you think about this scenario? Only share your idea if you’ve got another opinion — otherwise just hit that button 👍

Ethereum (ETH): Reclaim of Re-Test and 100EMA | Bullish Monday ETH started the week with a bullish tone after bouncing from the 100EMA and reclaiming the breakout zone.
Yesterday’s candle showed clear buyer strength, and today’s continuation keeps the pressure on the upside. As long as this level holds, we are watching for a break of structure on the upper zones — that’s the next step, and after that only a new ATH!
Swallow Academy

Ethereum (ETH): This is Nothing, We Expect Parabolic Movement!This Bullish cycle can't continue without ETH forming new ATH, and seeing all the manipulation near current ATH we are seeing ismilarities with BTC when it had also been forming new ATH.
Anyways, gameplan remains the same, you want it or not, we are going to see a new ATH very soon.
Swallow Academy
#ETHUSDT (4H Chart)#ETHUSDT
(4H Chart)
🔹️ Ethereum Analysis 🔹️
For Ethereum, we have two important resistance levels that could lead to a significant correction:
🔴 Resistances (marked with red boxes):
🎯 First range: 4260 to 4352 USD
🎯 Second range: 4550 to 4635 USD
Supports:
🟡 Yellow box (short-term support): 3525 to 3445 USD — likely to be touched if Bitcoin reaches 100,000 USD
🟢 Green box (main support): 2800 to 2700 USD
💡 Summary:
We expect a small initial rise, then a correction down to the yellow box, and after the yellow box is touched, this analysis will be updated.
🚀 If you enjoyed this analysis, please give it a boost 💙
And to not miss any new analyses or setups, make sure to follow me 📊
🆔️ @Rasoolahmadi

Is ETH Bottomed?
Observations from ETH 4 Hour Charts – 2025-09-28
• ETH is currently in a downtrend
• Key Support is $3945, Key resistance is $4202
• Projected time for trend reversal is early November with the following two Consolidation Ranges (CR): $3945 and $4202 then break and hold above $4200 level.
Warning Sign (Further Dropping)
1). Cannot make new lower lows than $3821.02
Play Strategy
Swing Trader: Trade the ranges.
Long-term Investor: Buy in dip, 20% - 30% buy

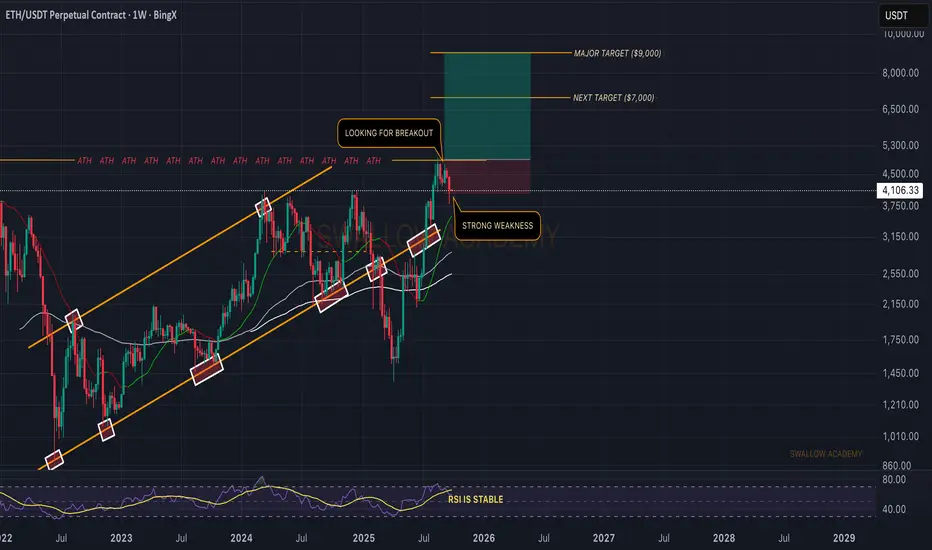
Eth All three corrective patterns in Ethereum have the same shape, with resistance at the top and support at the bottom.
It can be expected that Ethereum might move up to the $7,000 level or to the top of its channel.
